Combining Representations for Improved Sketch
Recognition
by
Sonya J. Cates
MASSACHUSETTS INSTI"TUTE OF TECHNOLOGYSEP 3
0
2009
LIBRARIES
Submitted to the Department of Electrical Engineering and Computer
Science
in partial fulfillment of the requirements for the degree of
Doctor of Philosophy
at the
MASSACHUSETTS INSTITUTE OF TECHNOLOGY
September 2009
@ Massachusetts Institute of Technology 2009. All rights reserved.
Author
Department of Electrical Engineering and Computer Science
September 4, 2009
Certified by..
Randall Davis
Professor
Thesis Supervisor
Accepted by ...
Professor Terry P. Orlando
Chairman, Department Committee on Graduate Theses
ARCHIVES
C-Combining Representations for Improved Sketch Recognition
by
Sonya J. Cates
Submitted to the Department of Electrical Engineering and Computer Science on September 4, 2009, in partial fulfillment of the
requirements for the degree of Doctor of Philosophy
Abstract
Sketching is a common means of conveying, representing, and preserving information, and it has become a subject of research as a method for human-computer interaction, specifically in the area of computer-aided design. Digitally collected sketches contain both spatial and temporal information; additionally, they may contain a conceptual structure of shapes and subshapes. These multiple aspects suggest several ways of representing sketches, each with advantages and disadvantages for recognition. Most existing sketch recognitions systems are based on a single representation and do not use all available information. We propose combining several representations and sys-tems as a way to improve recognition accuracy. This thesis presents two methods for combining recognition systems. The first improves recognition by improving seg-mentation, while the second seeks to predict how well systems will recognize a given domain or symbol and combine their outputs accordingly. We show that combin-ing several recognition systems based on different representations can improve the accuracy of existing recognition methods.
Thesis Supervisor: Randall Davis Title: Professor
Acknowledgments
First, I must thank my advisor Randy Davis, who always asks the right question and provides the right way of looking at a problem, and who may very well be the best advisor at MIT. I didn't know what I was doing when I first arrived at MIT and chose a group, but I certainly chose well.
I would like to thank my committee members Patrick Winston and Pawan Sinha for their valuable suggestions, insights, and questions, and Professor Winston in par-ticular for sharing his renowned presentation skills.
I have been very fortunate not only in my advisors, but in my group mates as well. I have benefited greatly from the advice, feedback, and community the Design Rationale/Multimodal Understanding Group has provided over the years. Thank you in particular to Jacob Eisenstein and Tom Ouyang for being such great officemates and sounding boards, and to Mike Oltmans, Christine Alvarado, and Metin Sezgin for not only being great group mates but also for providing the work upon which this thesis is based. I am particularly indebted to Aaron Adler for being a great officemate and frequent lunch mate, and for his invaluable tech support.
Thank you to T!G, and to Anthony in particular, for solving every problem thrown at them, including but not limited to, excessive processor time demands, mice, leaky ceilings, odd smells and extreme temperatures.
I am grateful to many outside of CSAIL as well. My time spent with the cycling team will always be one of the best experiences of my life, and the women's team in particular has provided me with friendships that will last beyond MIT.
Thank you to my parents for their unwavering love and support (and for not asking too many questions like that pesky "When will you be finished?" one). Thank you to my family, both new and old, for their kindness, support and understanding.
Finally, thank you to my husband Bill, who has been wonderfully supportive and encouraging. I am grateful to have had him with me for the end of this journey, and look forward to the beginnings of many more.
Contents
1 Introduction
1.1 Why Recognize Sketches?
1.2 1.3 1.4 1.5 1.6 1.7 1.8
Nature of Sketches Considered in This Work .
Meaning of Recognition ...
Sketch Representations . ...
1.4.1 Spatial . ...
1.4.2 Temporal ...
1.4.3 Conceptual ...
1.4.4 Relationship to Existing Recognition Systems
Why Use Multiple Representations? ...
Method Overview . ... Contributions . ... Outline . ... 2 Sketch Data 2.1 Domains . ... 2.2 Data Sets ...
2.3 Single Representation Recognition Results
3 Segmentation of Sketch Data
3.1 Basis for Segmentation without Domain Knowledge ...
3.1.1 Human Behavior ... 3.1.2 Human Perception ...
17
. . . . 1 8
3.2 Representation Based Segmentation Methods . ... 3.2.1 Spatial ...
3.2.2 Temporal ...
3.2.3 Conceptual ...
3.2.4 Segmentation Results ...
3.3 Segmentation as a Pre-processing Stage of Recognition ...
3.3.1 Method ...
3.3.2 Recognition Results ...
4 Judging Recognition Credibility with Representation Specific Com-plexity Measures
4.1 Domain Level Complexity ...
4.2 Symbol Level Complexity ...
4.2.1 Confusion Matrices as Indicators of Complexity ...
4.2.2 Approximating Confusion Matrices with Representation
Spe-cific Distance Metrics ...
4.2.3 Symbol Versions for Computing Distances . ...
4.3 Combining Recognition Systems Based on Symbol Level Complexity.
4.3.1 Weighting Recognition Results Based on Credibility ...
4.3.2 Training Recognition Systems Based on Predicted Credibility
5 Related Work
5.1 Sketch Recognition . ...
5.2 Representations ...
5.2.1 Knowledge Representation . ... ...
5.2.2 Multiple Representations in Sketch Recognition . . .
5.2.3 Multiple Representations in Handwriting Recognition
5.3 Combining Representations . . ...
5.3.1 Combining Classifiers and Recognizers . . . .
5.3.2 Distance Measures . ... ... 75 . . . . 75 . . . . 76 . . . . 76 . . . . 77 . . . . 78 . . . . 79 . . . . 79 . . . . 81
6 Future Work 83
List of Figures
1-1 Examples of symbolic and nonsymbolic sketches. . ... 19
1-2 Parts (a) and (b) show the same symbol drawn with one and four strokes. 20 1-3 Parts (a) and (b) show the same set of symbols drawn with three strokes and with one stroke, which must be divided among the symbols. 21 1-4 A sketch of a circuit diagram. ... ... 21
1-5 A correct segmentation of the sketch in 1-4. Symbols are spatially separated to indicate groupings of stroke segments. . ... 22
1-6 An example of classification of a segmented sketch. Symbols are spa-tially separated to indicate groupings of stroke segments. . ... 23
1-7 A LADDER shape description for a rectangle. . ... . . 26
1-8 Simple shapes whose recognition may be helped or hindered by the choice of representations ... ... 27
2-1 Lexicons for each domain. ... ... 34
2-2 Family tree and flow chart sketches. ... 36
2-3 Circuit diagram sketches. ... ... . 37
3-1 A family tree sketch. Knowledge of the concept of an arrow is useful for segmenting this sketch. ... ... 40
3-2 The arrow bodies were all drawn before the arrow heads. Numbers indicate drawing order. ... ... .. 42
3-3 Parallelism as a singularity. The same change in the angle of line a and line c affects the perception of the shapes differently. ... 43
3-4 To produce a spatial segmentation, the sketch is first scanned and ink density is found for many overlapping windows. Overlapping windows
with similar density are then clustered. . ... 44
3-5 An excerpt of a larger family tree sketch and the timeline illustrating
how it was drawn. . ... ... ... . 45
3-6 Temporal clustering resulting in the segmentation of the sketch in
Fig-ure 3-5(a) ... ... ... 46
3-7 An excerpt from a larger family tree sketch and a partial description
of its components and constraints. ... . 47
3-8 The constraint graph corresponding to the sketch and description in
Figure 3-7 ... ... 48
3-9 The minimum cuts of the graph in 3-8 and the resulting segmentation. 49
3-10 A sketch of a flow chart. ... . . . . . 50
3-11 Segmentations of a flow chart sketch. . ... 51
3-12 Segmentation resulting from the combination of the representation
spe-cific segmentations in Figure 3-11. ... . 52
3-13 Segmentation error in Figure 3-12 indicated by the circle. ... . 52
3-14 Incorrect segmentation of one symbol can result in other segmentation
and classification mistakes. ... ... . . 53
3-15 Presegmenting with spatial and temporal methods improves later
con-ceptual recognition. ... . . . . . . 55
4-1 The relationship between our spatial domain complexity measure and
recognition rates. ... .... . . . . 59
4-2 The relationship between our temporal domain complexity measure
and recognition rates. . ... .... . . . 60
4-3 The relationship between our conceptual domain complexity measure
4-4 Symbols a and b are from the flow chart domain. Symbols c, d, and e are from the circuit domain. The ellipse is more likely to be confused with the circle than the battery, and likewise the battery is more likely to be confused with the capacitor or ground than with symbols from
the flow chart domain. ... ... 61
4-5 Confusion matrix for the conceptual recognition system on a subset of family tree data. ... ... 62
4-6 Steps in the generation of an edge direction histogram. . ... . 64
4-7 Temporal representation of a resistor and an arrow. . ... . 65
4-8 Conceptual graph representations of two simple symbols. . ... . 66
4-9 Sequence of edits required to convert one graph into another... 67
4-10 Ideal versions of a resistor and ground symbol. . ... . 68
4-11 Several sketched versions of resistor symbols. . ... . 68
4-12 Several sketched versions of ground symbols. . ... ... .. 69
4-13 An example of serial recognition. At each stage, black shapes have been recognized and blue areas of the sketch are unrecognized. .... 73
Chapter 1
Introduction
Sketching is a critical first step in many design problems. Architects and engineers, for example, commonly make many rough sketches on the way to a design. Designers often make these initial sketches on paper and must later transfer their work to a computer for further development. Computer recognition of sketches could streamline this common process, but for many applications users require an error rate near zero before adopting a new technology. Until then they prefer to use predictable, if cumbersome methods. While there exists a diverse and advancing body of work on sketch recognition, none of the current systems have both the flexibility and accuracy required in a realistic design setting. The general goal of this work is to improve recognition accuracy and thereby advance sketch recognition applications.
The sketches that this work examines are created with a digital pen, which records both position and timing information, so the sketches have both spatial and temporal aspects. As sketches are also frequently conceived as compositional, i.e. made up of a hierarchical structure of shapes and subshapes (as, for example, a square is made up of lines), they also have a conceptual structure. This multi-faceted quality, i.e., the spatial, temporal, and conceptual aspects, allow a sketch to be thought of and represented in several ways. Later in this chapter we describe three types of representations corresponding to the spatial, temporal and conceptual views of a sketch. Most existing sketch recognition systems are based primarily on one of these representations and do not fully use all of the information contained in a sketch.
This thesis is based on the idea that these different representations may have different strengths and that the choice of representation can affect what recognition is feasible or easy. We show how to combine multiple representations as a way to improve recognition accuracy. We demonstrate improved recognition accuracy by combining existing recognition systems based on different representations and suggest a combined approach for the development of future recognition systems.
1.1
Why Recognize Sketches?
Consider a collaborative meeting of engineers, designers, scientists, or artists. Now take away the whiteboard, pens, and paper. Likely, you will be left with a roomful of unhappy and unproductive people making frantic and indecipherable gestures. Natural communication occurs in different forms, with sketches communicating some information most effectively, as for example, a complex diagram or map. This is true both in collaborative processes [64], and in the design process of an individual, because it extends the designer's memory and cognitive ability [46, 63, 32].
As computers become more powerful and more pervasive, we would like both to communicate with them in the same efficient ways that we communicate with people and to use them to facilitate design and collaboration. This desire for more natural human-computer interaction and for a more effective role for computers in the design process is one compelling motivation for the development of pen based input for computers. Recent work by Adler and Davis [1] and by Zamora and Eyjolfsdottir [70] demonstrates how a computer might aide in the design of mechanical devices and digital logic circuits; however, much remains to be done before a computer can recognize and understand unrestricted sketching.
Tablet computers are currently used commercially for taking notes and recognizing handwriting, but ultimate goals for sketch based interfaces presented by Davis [11] and Forbus et al. [16] include human-like understanding, reasoning, and participation. While these are distant goals, a clear intermediate step is recognizing what has been drawn, i.e. parsing and associating meaningful labels to a collection of pen strokes.
List of Tables
2.1 Statistics for the data sets used throughout this work. . ... 35
2.2 Recognition results (% correct symbols) for the spatial, temporal, and
conceptual recognition systems. ... .. 37
3.1 The average length of time between temporally adjacent strokes within
a symbol and between adjacent strokes in different symbols are
signif-icantly different ... ... .... 41
3.2 Geometric components and constraints used in sketch descriptions. 47
3.3 Segmentation accuracy. ... ... 50
3.4 Recognition accuracy for sketches presegmented with cross-representational
information. ... ... .. 56
3.5 Recognition results (% correct symbols) for the individual spatial,
tem-poral, and conceptual recognition systems. . ... 56
4.1 Recognition results (% correct symbols) for the spatial, temporal, and
conceptual recognition systems. ... . . 58
4.2 Domain complexity measures. ... ... 59
4.3 Recognition results (% correct symbols) for the combination of
recog-nition systems. ... ... 71
4.4 Recognition results (% correct symbols) for presegmentation followed
by spatial recognition and presegmentation followed by the combined
recognition. ... ... .. 72
4.5 Recognition results (% correct symbols) for serial combination of
1.2
Nature of Sketches Considered in This Work
There are many different kinds of sketches. Those considered in this work are sym-bolic, in the sense that they are made up of symbols that have a mental association with a type of object or relationship in the world, but they need not resemble that which they represent [44]. Additionally, the symbols are standardized (we can define a lexicon) and are used to compose sketches by combining them according to rules (we can form a full or partial grammar). Figure 1-1(a) contains an example of a sym-bolic sketch. Element, compound, and bond symbols in this chemical diagram have defined meanings and relationships with each other. This work does not consider more artistic sketches, such as that in Figure 1-1(b), which do not have a defined lexicon or composition rules.
N
I
cm.O
M~s
0
(a) Symbolic sketch. (b) Nonsymbolic sketch.
This work considers sketches drawn with a digital pen (in particular, all of the sketch data described below was captured using digitizing LCD tablets), rather than those drawn on paper then scanned and digitized. This distinction means that the data considered here contains time information: each point has spatial coordinates as well as an associated time stamp. This allows for the use of temporal properties of a sketch including stroke order, drawing speed, and the length of time between strokes, in addition to properties based on spatial distribution of ink.
The sketches are also minimally constrained, or unconstrained. In creating these sketches the user is allowed to draw freely, rather than required to draw symbols with a fixed number of strokes, or to signal the system after each symbol is completed. This means that the same symbol may be drawn with one or many strokes; a stroke may also belong entirely to one symbol or may be split'among two or more. Figures
1-2 and 1-3 illustrate these two scenarios. Furthermore, the sketches are frequently messy or imprecise. For example, the sides of the rectangle in Figure 1-2(a) are curved rather than straight lines, while the corners of the resistor in Figure 1-3(b)
are rounded rather than sharp.
(a) Rectangle drawn with one (b) Rectangle drawn with
stroke. four strokes.
pvli7\_
(a) Resistor and two wires drawn with three (b) Resistor and two wires drawn with one
stokes. stroke.
Figure 1-3: Parts (a) and (b) show the same set of symbols drawn with three strokes and with one stroke, which must be divided among the symbols.
1.3
Meaning of Recognition
While other applications for digital pen input devices have been conceived and devel-oped, this thesis is specifically concerned with sketch recognition. We define recogni-tion in terms of its two necessary components: segmentarecogni-tion and classificarecogni-tion. We define these processes separately for clarity; however, they may be performed either sequentially or simultaneously by a recognition system.
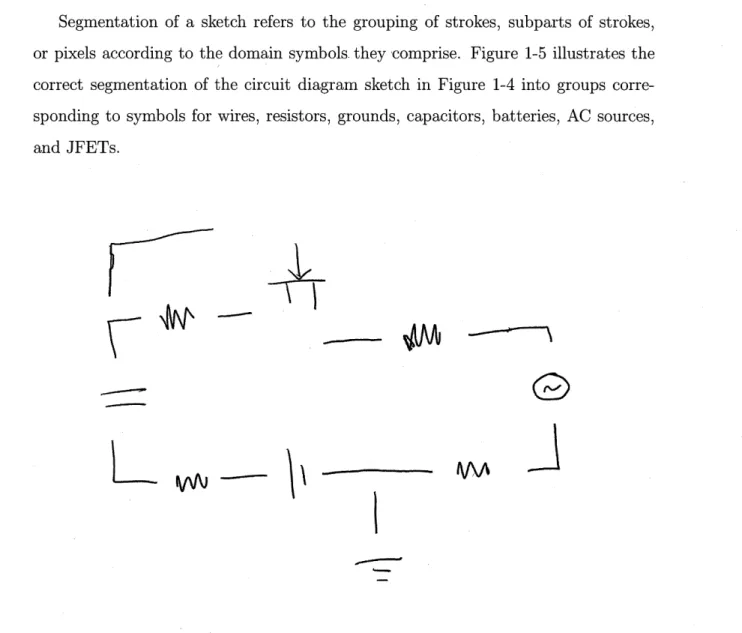
Figure 1-4: A sketch of a circuit diagram.
I u
Segmentation of a sketch refers to the grouping of strokes, subparts of strokes, or pixels according to the domain symbols they comprise. Figure 1-5 illustrates the correct segmentation of the circuit diagram sketch in Figure 1-4 into groups corre-sponding to symbols for wires, resistors, grounds, capacitors, batteries, AC sources, and JFETs.
Figure 1-5: A correct segmentation of the sketch in 1-4. Symbols are spatially
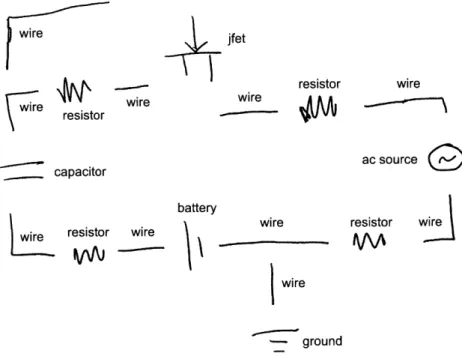
We define classification as assigning labels to the resulting groupings. Figure 1-6 illustrates the assignment of labels to the segmented sketch in Figure 1-5.
wire wire wire resistor jfet resistor wire capacitor resistor wire
V
--battery wire
Swire
groundFigure 1-6: An example of classification of a segmented sketch. Symbols are spatially separated to indicate groupings of stroke segments.
1.4
Sketch Representations
We identify three primary aspects of sketches: the spatial, the temporal, and the conceptual. Each aspect provides a way of thinking about a sketch and a means to represent it, and each has advantages and drawbacks for recognition. Throughout this work we consider three representations of sketches corresponding to the three aspects of sketches.
wire
wire
resistor
1.4.1
Spatial
By the spatial aspect of a sketch, we mean literally what the sketch looks like: the areas of ink and absence of ink that we see when looking at the sketch on a screen or piece of paper. Obvious spatial representations are simply an array of pixels or a list of coordinates. This type of representation is appealing both because of its simplicity and because of the large existing body of work in the field of computer vision that uses similar representations.
1.4.2
Temporal
The temporal aspect of a sketch is based on the way the sketch was drawn, including drawing order, pauses, etc. We create the most basic temporal representation with a sequence of time-stamped pen positions. From that higher level abstractions may be created such as time-stamped Boolean observations corresponding to whether or not a drawing action occurred, velocity vectors, or other relevant features. The temporal aspect of sketching is an appealing basis for representation because it is a unique quality of online pen-based interaction; without the timing information, we have only a static image, as might be obtained by drawing on paper and scanning the result.
1.4.3
Conceptual
We define the conceptual view of a sketch as its geometric or symbolic contents and the configuration of the contents within the sketch. A conceptual representation indicates the sketch's geometric primitives, for example line segments and curves, and their spatial relationships, for example locations or whether or not two segments meet. We might alternatively list more complex geometric or symbolic objects as the sketch's contents, such as triangles or resistors. A conceptual representation is attractive because it reflects how the sketch may have been conceived by its author and facilitates high level inferences about what has been drawn.
1.4.4
Relationship to Existing Recognition Systems
It is unclear how to evaluate a representation directly, independent of an implemented system. Furthermore, a representation is interesting only in so far as it facilitates recognition (or other task). Therefore, we evaluate, compare, and combine recognition systems, rather than representations.
Given that we want to discuss systems rather than representations, it is useful to note that the three sketch representations that we have presented can be used to categorize sketch recognition systems as well, according to which representations are used. While most systems do not take purely one approach, many do strongly focus on one of the representations that we have described. Our work builds directly on three existing recognition systems, which are described below. We discuss other related systems in Chapter 5.
Spatial
The recognition method developed by Oltmans [40] performs recognition based on visual parts, also referred to as image patches. Shapes are classified by comparing the parts of a candidate symbol to a standard set of parts, resulting in a vector of measurements that represent the degree to which each standard part appears in the candidate symbol. Classifying this vector then results in a classification of a shape. Segmentation is performed by locating many candidate symbols and keeping only those with a high classification score.
Temporal
Sezgin and Davis [55] developed a recognition method that represents a sketch as a sequence of observations (strokes or substrokes). A Hidden Markov Model is trained for each symbol in a domain. A sketch may then be recognized by using dynamic programming to find a sequence of symbols that accounts for all of the strokes in a sketch and that maximizes the overall probability of the observations.
Conceptual
The SketchREAD recognition system developed by Alvarado [5] uses the shape
de-scription language LADDER [23] to describe shapes in a domain in terms of
compo-nents and constraints between those compocompo-nents. Figure 1-7 illustrates an example of a LADDER description for a rectangle. A sketch is recognized by parsing strokes into possible interpretations. The system generates likely interpretations for groups of strokes, then corrects mistakes in the low level interpretations of components and constraints based on high level domain knowledge.
(define shape Rectangle (components (Line linel) (Line line2) (Line line3) (Line line4) (constraints (touching linelline2) (touching line2 line3) (touching line3 line4) (touching line4 linel) (perpendicular linel line2) (parallel line2 line4) (equal linel line3)
Figure 1-7: A LADDER shape description for a rectangle.
1.5
Why Use Multiple Representations?
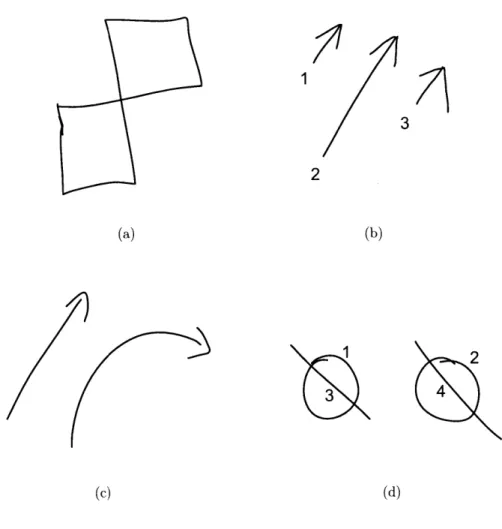
In this section we provide some motivation for the use of multiple representations for sketch recognition. Figure 1-8 presents several simple shapes, the recognition of which is made easier or harder depending on the representation selected.
S23
2
(a) (b)
34
(c) (d)
Figure 1-8: Simple shapes whose recognition may be helped or hindered by the choice of representations
Figure 1-8(a) contains two squares. These squares might be easily recognized with computer vision pattern matching techniques; however, recognizing these shapes with a conceptual representation could pose a problem. If the entire figure is drawn with one stroke, that stroke must be broken and divided between the two squares. Testing all such possible divisions may not be feasible (the time complexity of segmenting and grouping strokes grows exponentially with the number of strokes in a sketch), and it is difficult to define heuristics that are sufficiently thorough and accurate.
Figure 1-8(b) demonstrates the opposite case; here a spatial representation may make recognition difficult while a conceptual approach is clear. We identify both shapes 1 and 2 as arrows, though they are related by a non-affine transformation. However, another non-affine change made to shape 1 produces shape 3, which is something that we do not identify as an arrow. Specifying all possible transforms to shape 1 that will result in an arrow would be cumbersome with a purely spatial representation. However, recognizing shapes 1 and 2 as arrows without including shape 3 may be done simply with a conceptual definition that specifies an arrow as a line forming the shaft and two lines of roughly equal length forming the head.
The arrows in Figure 1-8(c) present another case where a spatial representation might be cumbersome. In a sketch these groups of strokes are likely to have the same interpretation, though they appear different, again as a consequence of a non-affine transformation. A temporal representation, however could be useful in determining this similarity, as the arrows would likely be drawn with the same temporal pattern. For example, one might consistently draw an arrow's shaft before drawing its head.
In Figure 1-8(d) the numbers correspond to drawing order, so the two circles were drawn first, followed by the two lines. This interspersing of the parts of different symbols can be problematic for a temporal approach since parts that are relevant to
each other are not adjacent temporally. Thus segmenting the sketch on purely
tem-poral grounds would be unsuccessful. However, this interspersing poses no problem
visually because the parts that are relevant to each other are adjacent spatially.
These simple scenarios are representative of common phenomena in hand-drawn sketches. Employing an appropriate representation can greatly simplify the problem
and improve the accuracy of recognition. However, the wide variety of phenomenon in hand-drawn sketches means that a domain or a sketch is unlikely to contain only
1.6
Method Overview
In this chapter we have introduced three ways of representing sketches and a
recog-nition system based on each of them. The remainder of this thesis explores ways of
combing these representations and recognition systems in order to improve recognition
accuracy. Two combination methods are discussed.
The first method improves recognition by improving segmentation. While
exist-ing systems classify isolated symbols with a high degree of accuracy [43], localizexist-ing
symbols within a sketch remains a difficult problem. Improving segmentation is a
critical step towards improving recognition of whole sketches.
We present three methods for approximately segmenting sketches, one
corre-sponding to each of the three representations described above. That is, we develop
segmenters based on spatial, temporal, and conceptual representations. These
seg-menters are based on characteristics of human behavior and perception as they pertain
to each representation, rather than domain knowledge. As a consequence they do not
rely on knowing what symbols may be drawn. As one example, a long pause between
two strokes is a good indication that the two strokes are part of different symbols.
We demonstrate that the resulting segmentations can be used improve recognition
by processing sketches with our approximate segmentation methods, then recognizing
the segmented pieces of the sketches with systems based on different representations
than those used for the presegmentation. This two stage process enforces break points
that are very likely to be symbol boundaries, thus preventing recognition errors made
in one part of a sketch from propagating.
Our second combination method seeks to determine which representation/system
is most likely to be correct for a given domain or symbol, and combine outputs
accordingly. The method does not require running an actual recognition system and
may be applied prospectively to decide what type of system or what approach to take
for a new recognition problem.
We first propose simple complexity measures for each representation that predict
recognizer performance on a domain. We then expand the idea of complexity to
the symbol level by defining symbol complexity in terms of confusability with other symbols in a domain. This symbol complexity, which may be computed without empirical data, is used to judge the credibility of each recognition system for each symbol it recognizes in a sketch. The three recognition systems may then be combined by comparing the likelihoods of their outputs or by training the systems only for those symbols for which they are judged to be highly credible.
1.7
Contributions
This thesis makes four primary contributions, listed here in the order of presentation.
* First, the thesis presents segmentation methods corresponding to each of the representations. We demonstrate that combining the segmentation methods of multiple representations yields a good approximate sketch segmentation without a need for domain knowledge.
* Second, we demonstrate that the segmentations described above can be used to improve recognition accuracy, by performing approximate segmentation as a preprocessing step.
* Third, this thesis proposes symbol confusability as a means of judging the cred-ibility of a system. We demonstrate that combining recognition systems based on how likely they are to confuse symbols can improve recognition accuracy. * Finally, we present representation specific measures to approximate
confusabil-ity without the need to collect empirical data or build systems. We demonstrate that these measures can be used to effectively combine recognition systems.
1.8
Outline
This thesis is organized as follows. Chapter 2 describes the sketch data considered by this thesis, including the particular domains and data sets used in later chapters.
Chapter 3 presents methods for segmenting sketches corresponding to each of the three representations described in Section 1.4. We then describe how these segmenta-tions may be combined and how the combination may be used to improve recognition. Chapter 4 proposes simple domain complexity measures, and then expands the idea of complexity to the symbol level by defining symbol confusability metrics. We then use these metrics to combine recognition systems in parallel. We end with chap-ters discussing related and future work (Chapchap-ters 5 and 6) and our contributions (Chapter 7).
Chapter 2
Sketch Data
This chapter describes the sketch data considered by this thesis: the particular do-mains and data sets for which results are presented in later chapters.
2.1
Domains
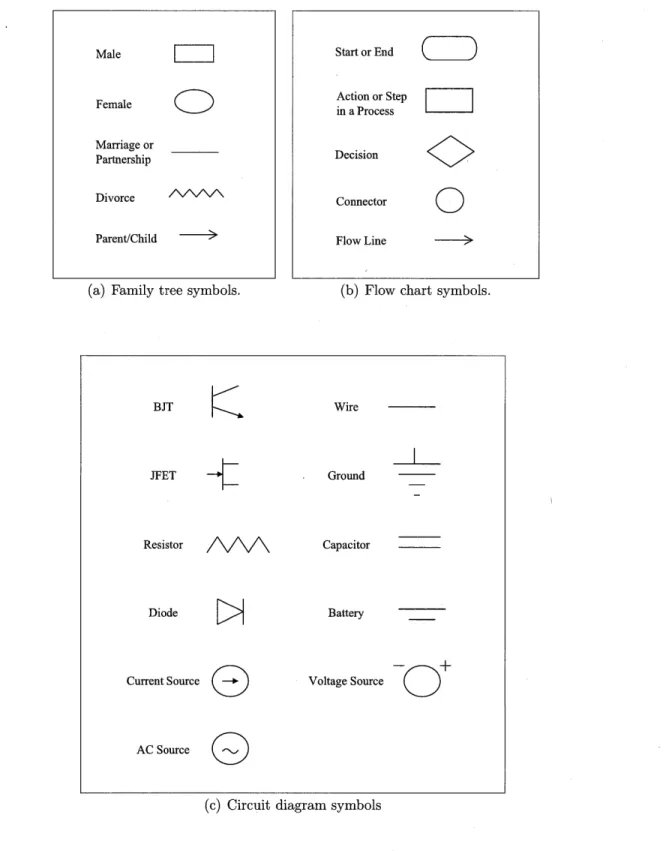
We consider three domains: family trees, flow charts, and circuit diagrams. Lexicons for each are given in Figure 2-1. The family tree domain contains five symbols: male, female, marriage or partnership link, divorce link, and child link. The parent-child link is defined as linking one male or female to another male or female, thus each child is linked by an arrow to each parent (rather than joining the marriage or partnership to the child with a single arrow). The flow chart domain, with five symbols, and circuit domain, with eleven symbols, are each made up of a subset of standard symbols for such diagrams.
Female
Marriage or Partnership
Divorce
Parent/Child
(a) Family tree symbols.
BJT
MET
Resistor Diode Current Source Start or End Action or Step in a Process Decision < Connector O Flow Line(b) Flow chart symbols.
Wire Ground Capacitor Battery Voltage Source -O AC Source
Q
(c) Circuit diagram symbols
Figure 2-1: Lexicons for each domain.
Male2.2
Data Sets
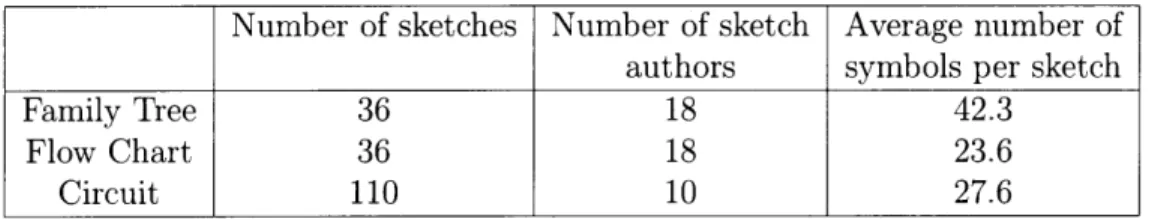
Unlike some areas of research, like speech recognition or handwriting recognition, the field of sketch recognition does not yet have large standardized data sets. Though work towards such data sets has begun, including work by Oltmans et al. [41], avail-able data sets remain relatively small, on the order of tens or hundreds of sketches, rather than the thousands of handwritten addresses or phone interactions used in many recognition applications [28], [20].
Number of sketches Number of sketch Average number of
authors symbols per sketch
Family Tree 36 18 42.3
Flow Chart 36 18 23.6
Circuit 110 10 27.6
Table 2.1: Statistics for the data sets used throughout this work.
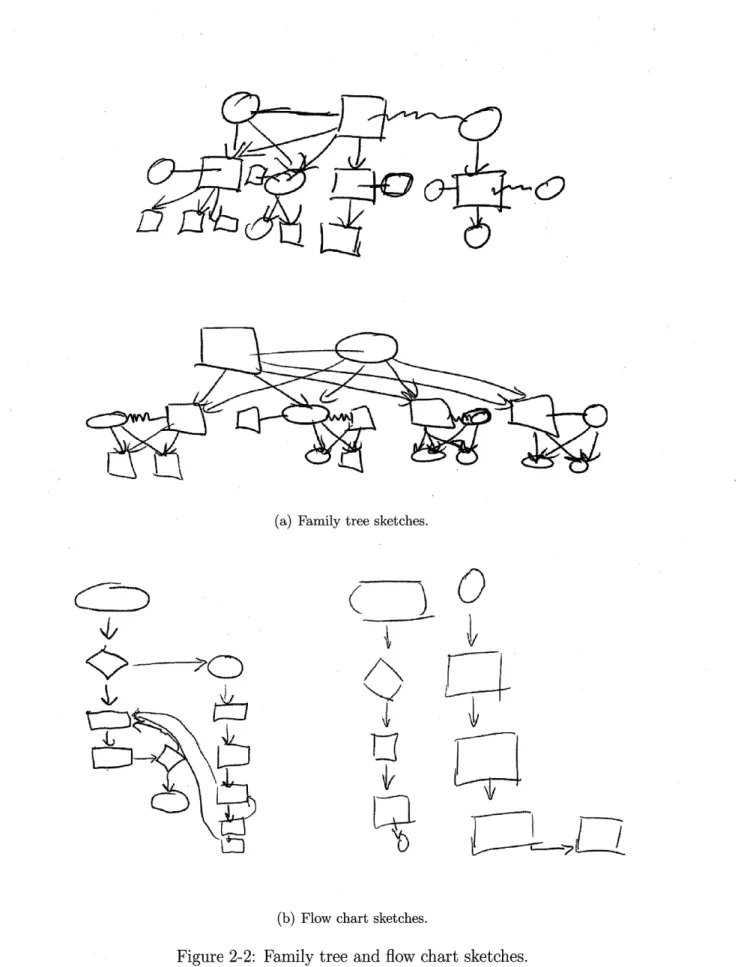
Table 2.1 gives statistics for the three data sets used in this research: family trees, flow charts, and circuit diagrams. Family tree and flow chart data was collected from the same set of subjects [9]. After a warm-up period to become familiar with the drawing environment, sketch authors were asked to draw their own family trees and then were given a textual description of an extended family and asked to draw the corresponding tree. The same subjects were also asked to draw flow charts represent-ing their mornrepresent-ing routines and were given a textual description of a common process and asked to draw the corresponding flow chart. Figure 2-2 contains examples of family tree and flow chart sketches.
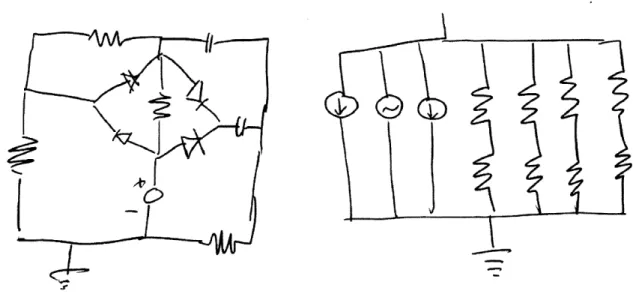
Circuit diagram data collection was conducted by Alvarado [4]. Sketch authors familiar with circuit design were asked to draw several circuits, each with a specified numbers and types of components, but no constraints on function or layout. Figure 2-3 contains examples of circuit diagram sketches.
(a) Family tree sketches.
4,
liii?
(b) Flow chart sketches.
Figure 2-2: Family tree and flow chart sketches.
L
--ccii
0
L7-/
VI--Figure 2-3: Circuit diagram sketches.
2.3
Single Representation Recognition Results
Table 2.2 contains recognition results for the three recognition systems described in Section 1.4.4 on each of the three data sets described above. Numbers in the table are the percentage of symbols rbcognized correctly, meaning the percentage of symbols across the entire domain that were both correctly localized and correctly classified.
Family Tree Flow Chart
Spatial 21.3 37.3
Temporal 36.7 25.8
Conceptual 47.3 25.1
Table 2.2: Recognition results (% correct symbols) for conceptual recognition systems.
Circuit
49.9
6.0
13.9
the spatial, temporal, and
The goal of this thesis is to examine the improvement that combining representa-tions can offer. Throughout this work, we use the results in Table 2.2 as a baseline for comparison. We seek to improve upon the single system recognition rates in
Ta-ble 2.2 and to produce a combined approach that outperforms the best single approach
(highlighted in bold) across all three domains.
Chapter 3
Segmentation of Sketch Data
This chapter discusses sketch segmentation, one subproblem of recognition. Section 3.2 details a segmentation strategy corresponding to each of the three representations discussed in Section 1.4: spatial, temporal, and conceptual. The methods described in this chapter are based on human behavior and perception rather than domain knowledge, meaning that they do not rely on knowing what symbols may be drawn. We show that these segmentation methods may be combined to produce a good approximate segmentation. Section 3.3 demonstrates the resulting segmentations improve recognition by combining knowledge from different representations.
3.1
Basis for Segmentation without Domain
Knowl-edge
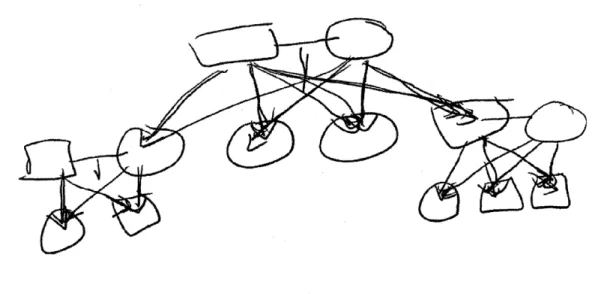
Many methods of in-context recognition perform segmentation jointly with classifi-cation (the assigning of labels to stroke or pixel groups). Examples of this approach include [59], [42], and [69]. In these cases, segmentation relies on domain knowledge, which can be highly useful in the segmentation of a messy sketch with overlapping symbols. Consider the family tree sketch in Figure 3-1. In this sketch, knowledge of the concept of an arrow can be very useful for grouping strokes, because arrowheads tend to be closer to each other or closer to the shapes they point to than to the
corresponding arrow shaft strokes.
While in many cases a perfect segmentation requires this type of domain
knowl-edge in order to group strokes or pixels, in this chapter we describe methods for
approximate segmentation that do not rely on knowledge of what is being drawn.
These methods are based on how humans tend to express ideas and perceive the
world. Later in this chapter we show that these approaches provide useful
segmenta-tion informasegmenta-tion that complements domain specific approaches to recognisegmenta-tion.
Figure 3-1: A family tree sketch. Knowledge of the concept of an arrow is useful for
segmenting this sketch.
3.1.1
Human Behavior
Timing is one characteristic of human behavior that may implicitly convey meaning.
In particular, pause placement and duration can aide in sketch segmentation. Authors
are more likely to pause between drawing two symbols than in the middle of drawing
one symbol. Across the data sets described in Chapter 2, the average length of time
between temporally adjacent strokes within a symbol and between adjacent strokes
in different symbols is significantly different, which suggests that useful segmentation
clues are contained in this time stamp information. Mean pause lengths in
millisec-onds and statistics for t-tests for differences in the means are shown in Table 3.1.
The average length of time between temporally adjacent strokes within a symbol and between adjacent strokes in different symbols are significantly different for each of the three domains. Pause behavior has also been used for analyzing organization of spoken discourse. Grosz and Hirshberg [21] note the usefulness of pauses for locating topic boundaries.
Within Symbol Across Symbol T-statistic
Mean Pause in ms Mean Pause in ms
Family Tree
692
2683
9.09 (p<.05)
Flow Chart 1155 5707 13.14(p<.05)
Circuit 982 1929 8.59(p<.05)
Table 3.1: The average length of time between temporally adjacent strokes within a symbol and between adjacent strokes in different symbols are significantly different.
Continuity in expressing ideas is a second characteristic of human behavior that is useful for analyzing sketches. Sketch authors are likely to finish drawing one symbol before beginning the next. Therefore, temporal adjacency is also one indicator of symbol groupings, i.e., nonconsecutive strokes are less likely to belong to the same group than are consecutive strokes. It is not a perfect indicator, however, since interspersing of symbols does occur. For example, in Figure 3-2 the arrow bodies were all drawn before the arrow heads. In the sketches examined in this work between 3% and 22% of symbols are drawn with interspersed strokes.
Like temporal continuity, spatial continuity is useful as an indicator of segmenta-tion: similar areas of ink that are near each other are more likely to be related than those that are not or those that are separated by blank areas of the page. However, this indicator is also imperfect when taken by itself, as Figure 3-1 illustrates.
These basic properties of human behavior underlie the spatial and temporal seg-mentation methods described in Section 3.2.
1 2
4
Figure 3-2: The arrow bodies were all drawn before the arrow heads. Numbers indicate drawing order.
3.1.2
Human Perception
We also base segmentation on ideas about human perception, in particular that some relationships among shapes are more important than others. In tests of human per-ception, Goldmeier [19] noted that subjects preferentially notice some qualities of shapes, referred to as singularities. Salient singularities such as parallelism or verti-cality are special cases of geometry and are distinct because small variations away from the singularity affect perception of a symbol. Figure 3-3 illustrates a visual singularity. The small variation away from the parallelism of lines a and b affects the interpretation of the shape in 3-3(a) more than the equal variation in lines c and d in 3-3(b).
Such observations about human perception form the basis for the recognition model for learning from a single example proposed by Veselova [66]. In the segmen-tation model described in Section 3.2.3, we consider a subset of the geometric prop-erties proposed by Veselova, including parallelism, perpendicularity, and equality of size (Table 3.2 contains the full list of properties). In the next section we describe how grouping these important shape properties can yield a sketch segmentation.
a b a
Figure 3-3: Parallelism as a singularity. The same change in the angle of line a and line c affects the perception of the shapes differently.
3.2
Representation Based Segmentation Methods
Each of the three sketch representations described in Section 1.4 attends to different aspects of a sketch and highlights different information contained within it. This section describes how to use these differing sets of information to produce different segmentations, which may then be combined, yielding a better approximate segmen-tation. These approximate segmentations are then used in Section 3.3 to improve on previous recognition results.
3.2.1
Spatial
A spatial representation is concerned with the distribution of ink on a page or colored pixels on a screen. In any drawing, the distribution of ink varies, with areas of higher ink density separated by areas of lower ink density. A spatial segmentation may be constructed by dividing relatively dense areas from areas that are relatively empty.
To produce a spatial segmentation, first the ink density is calculated for many
overlapping windows. Figure 3-4(a) illustrates these windows. Ink density is defined
as the number of drawn points divided by the area of the window. Next, windows
are grouped with bottom-up clustering. Each window begins as its own group and
overlapping groups with similar ink densities are merged. Figures 3-4(b) contains
six windows that have been grouped in three clusters, indicated by different colors.
Windows of the same color are overlapping and have similar ink density. Finally
strokes are segmented at corners according to the method described by Sezgin et.
al [57] and stroke segments are assigned to only one group, meaning strokes may not
be divided between two groups at arbitrary points. This is a simplifying assumption
that departs somewhat from a purely spatial method.
(a) (b)
Figure 3-4: To produce a spatial segmentation, the sketch is first scanned and ink
density is found for many overlapping windows. Overlapping windows with similar
density are then clustered.
3.2.2
Temporal
A temporal representation views the sketch as a sequence of events. For the purpose
of this segmentation method, we consider only two types of events: sketching and
pausing. Sketching refers to any uninterrupted time period during which the pen is
in contact with the screen (or page). Pausing refers to any block of time when no ink is
being laid on the screen (or page). Figure 3-5(b) illustrates the timeline corresponding to the sequence of events in the creation of the sketch shown in Figure 3-5(a).
C
t
-Sketching Pausing
(b)
Figure 3-5: An excerpt of a larger family tree sketch and the timeline illustrating how it was drawn.
We segment a sketch temporally by using a bottom-up clustering approach, similar to the spatial segmentation method described in the last section. Each stroke segment begins as its own group, and groups are continually merged as long as two groups are close temporally. Temporal distance between two stroke groups is defined as the ratio of the length of the pause between stroke groups to length of sketching time of the adjacent groups. Thus the temporal distance is relative: short strokes separated by a long pause would not be grouped, but longer strokes separated by the same
/
... ... ; ; ; ; ; ; ; ;
---pause length could be. This results in groups of temporally adjacent strokes that were drawn in relatively quick succession, with groups separated by longer pauses. Figure 6 demonstrates this successive grouping of strokes for the sketch in Figure 3-5(a). The bottom row of strokes contains each stroke as its own group, and each higher row shows two stroke groups being merged.
t-I
Sketching PausingFigure 3-6: Temporal clustering resulting in the segmentation of the sketch in
Fig-ure 3-5(a).
3.2.3
Conceptual
We produce a conceptual segmentation of a sketch, by representing the conceptual elements as a graph. Segmenting the graph yields a corresponding segmentation of the sketch. We define two types of conceptual elements: components and the constraints between components. This representation is based on the LADDER shape description language [23].
Components Constraints
Line Intersect Parallel
Ellipse Perpendicular Contains
Arc Coincident Touching
Equal
Table 3.2: Geometric components and constraints used in sketch descriptions. First, a low level processor identifies components, including lines, arcs, and ellipses [57]. Single strokes may be broken at corners to produce more than one component. Next, pairs of components are tested exhaustively for the binary constraints listed in Table 3.2. These two steps result in a list of components and constraints. Figure 3-7(b) contains an excerpt of the description of the conceptual representation, formatted as a LADDER shape description, corresponding to the same sketch in Figure 3-5(a) reproduced in Figure 3-7(a).
(define shape sketch (components (Line linel) (Line line2) (Line line3) (Line line4) (Line line5) (Line line6) (Line line7) (Ellipse ellipsel) (constraints
(touching linel line2) (touching line2 line3) (touching line3 line4) (touching line4 linel)
(perpendicular linel line2) (perpendicular line3 line4) (parallel line2 line4) (parallel linel line3) (equal linel line3) (touching line6 line2)
(touching line7 line2) (equal line6 line7)
Figure 3-7: An excerpt from a larger family tree sketch and a partial description of its components and constraints.
z
Next a graph is constructed that represents components as nodes and constraints between components as edges. Figure 3-8 contains the graph corresponding to the partial text description in Figures 3-7.
Ie lnparallel,
coii e line6 equaellipsel
Figure 3-8: Figure 3-7.
The constraint graph corresponding to the sketch and description in
The constraint graph is divided by computing the minimum cut, defined as a partition of the graph into two disjoint sets such that the number of edges with end points in different sets is minimized. The graph is further divided by computing the single minimum cut among the two resulting subgraphs. This process continues while the minimum cut is less than an empirically set threshold. Figure 3-9 illustrates the minimum cuts of the graph in Figure 3-8 and the resulting segmentation. By dividing the graph through areas of minimal connectivity thus preserving densely connected groups of nodes, groupings of constraints and their components in the sketch are grouped as well.
- -
(b)
Figure 3-9: The minimum cuts of the graph in 3-8 and the resulting segmentation.
3.2.4
Segmentation Results
Figure 3-10 contains a sketch from the flow chart data set, and Figure 3-11 contains a
segmentation of that sketch with each of the three methods described in this section:
spatial(3-11(a)), temporal(3-11(b)), and conceptual(3-11(c)). The three resulting
seg-mentations are all different. They all also undersegment, meaning that many groups
contain more than one symbol. The segmentation methods described in this section
are not intended to be used alone, since by using single representations they each
attend to valuable but incomplete information. Rather they are to be taken together,
Figure 3-10: A sketch of a flow chart.
with each contributing some segmentation indicators. Thresholds that determine how finely each single representation method segments a sketch are set empirically.
Figure 3-12 shows a combined segmentation, produced by considering all of the break points found by the spatial, temporal, and conceptual segmentations: if a break point is found in any of the three representation based segmentations it is included in the combined segmentation.
The segmentation in Figure 3-12 contains only one mistake, highlighted in Fig-ure 3-13: the arrow and rectangle should not be grouped together. While this sketch appears quite neatly drawn, this near perfect segmentation was produced with no knowledge of the domain, that is no knowledge of what an arrow, rectangle, or diamond is, and allows for symbols consisting of any number of strokes or stroke segments.
Table 3.3 contains the segmentation accuracy for the combined segmentation for each of the data sets described in Chapter 2. Accuracy is defined as the percentage of symbols, across all sketches in the domain, that were correctly isolated.
% correct segmentation
Family Tree 48.3
Flow Chart 59.5
Circuit 29.7
LI
L=2
(a) Spatial segmentation. (b) Temporal segmentation.
(c) Conceptual segmentation.
Figure 3-11: Segmentations of a flow chart sketch. f,\
-~j---1~
IfI
Figure 3-12: Segmentation resulting
cific segmentations in Figure 3-11.
Cz:-
r
K>
IZZIKc1
0 'ifI,
from the combination of the representation
spe-o
E1
Figure 3-13: Segmentation error in Figure 3-12 indicated by the circle.
3.3
Segmentation as a Pre-processing Stage of
Recog-nition
The method described above for approximate segmentation may have applications on
its own, for example, neatening a messy sketch or applications such as those described
by [29] and [53] where recognition is not required or desirable. However, segmentation
as a pre-processing step can also boost performance of existing recognition systems,
which themselves also perform segmentation.
I/O
8'0
(a) Excerpt from a family tree sketch.
i
Q
(b) Incorrect segmentation.jI
L /
(c) Correct segmentation.Figure 3-14: Incorrect segmentation of one symbol can result in other segmentation
and classification mistakes.
_
Recognition systems that perform both segmentation and classification, such as those described in Section 1.4.4, may be subject to error propagation, particularly if stroke segments may not be assigned to more than one symbol. A segmentation mistake (or classification mistake, if context is being used to aide recognition as in [5]) in one part of a sketch may cause segmentation mistakes elsewhere in the sketch. Those segmentation mistakes are then likely to cause classification errors.
Consider the example in Figure 3-14. The red square in Figure 3-14(b) is formed from strokes that belong in four different symbols. This error precludes the correct segmentation of the four symbols (two arrows and two rectangles), shown in Figure 3-14(c). This section describes how small, cross-representational segmentation clues can prevent this sort of error propagation.
3.3.1
Method
In order to boost the performance of an existing recognition system based on a single representation, sketch data is first pre-processed with complementary representations.
Sketches are roughly segmented according to the methods described in Section 3.2, taking strong indicators of symbols boundaries and erring on the side of underseg-mentation. Segmentation is based on complementary representations than that of the recognition step. The resulting segments are then recognized independently from one another, meaning that a symbol may not span both sides of a segmentation boundary.
3.3.2
Recognition Results
Figure 3-15(a) shows the correctly labeled flow chart sketch from Figure 3-10. Col-ors indicate symbol labels: diamonds(decision symbols), for example, are blue and ovals(start/end symbols) are green.
Figure 3-15(b) shows results of processing the sketch using the conceptual repre-sentation based system described in Section 1.4.4. If, however, we first presegment the sketch according to strong temporal and spatial clues, then process it with the same conceptual representation based system, we get the results in Figure 3-15(c).
Recognition is improved significantly by considering strong break points in other rep-resentations to be enforced symbol boundaries.
Start or End
E
Process Step Decision Flow Line Connector(a) Correctly labeled flow chart sketch.
(b) Conceptual recognition the sketch in part (a).
results of (c) Conceptual recognition results after presegmenting.
Figure 3-15: Presegmenting with spatial and temporal methods improves later con-ceptual recognition.
Table 3.4 contains quantitative results for this method of presegmenting, then recognizing sketches. In all cases sketches are presegmented with strong break points from two representations and then recognized with the remaining representation, noted in the table.
The results in Table 3.4 indicate that by applying the segmentation methods described in this chapter, the single system recognition described in Chapter 2 (results repeated in Table 3.5) is improved in all cases, and significantly so in some cases. This suggests that domain independent indicators of segmentation can compliment segmentation and recognition methods that rely on domain knowledge.
Presegmented
Family Tree Flow Chart Circuit
Spatial 62.3 51.3 63.1
Temporal 37.5 45.6 13.4
Conceptual 60.1 54.9 25.7
Table 3.4: Recognition
representational information.
accuracy for sketches presegmented with
cross-Single Representation
Family Tree Flow Chart Circuit
Spatial 21.3 37.3 49.9
Temporal 36.7 25.8 6.0
Conceptual 47.3 25.1 13.9
Table 3.5: Recognition results (% correct
ral, and conceptual recognition systems.
tempo-Chapter 4
Judging Recognition Credibility
with Representation Specific
Complexity Measures
This chapter explores the idea that different representations are good at different things, and specifically that one representation may be better or worse at recognizing symbols in a particular domain than another representation. When combining repre-sentations we would like to take advantage of these variations. This chapter suggests ways of predicting such differences in performance prospectively, i.e., without having to build recognition systems. In Section 4.1 we propose ways of predicting perfor-mance for a domain, which can be used to select the best recognition system for that domain. Section 4.2.2 extends this idea to the symbol level and introduces symbol confusability metrics, which judge how well a system can be expected to recognize a particular symbol within a domain. Section 4.3 applies the metrics of Section 4.2.2 to combine recognition methods.
4.1
Domain Level Complexity
The results in Table 2.2, repeated in Table 4.1, show that the accuracies of the recognition systems described in Section 1.4.4 vary, in both absolute value and relative
to one another. For example the spatial system has the best performance on the circuit domain, but it has the worst performance on the family tree domain. There is not a single best method for recognition across all domains.
Family Tree Flow Chart Circuit
Spatial 21.3 37.3 49.9
Temporal 36.7 25.8 6.0
Conceptual 47.3 25.1 13.9
Table 4.1: Recognition results (% correct symbols) for the spatial, temporal, and
conceptual recognition systems.
Table 4.1 suggests that the difficulty of the recognition problems for each sys-tem can vary. One could determine how difficult a recognition problem is for the three systems by simply running each on available data. However, we would like to
prospectively decide what type of system, or what approach to take for a new recog-nition problem. This leads to the questions: what makes a problem hard for a spatial representation, for a temporal representation, and for a conceptual representation? As partial answers to those questions, we propose the domain complexity measures listed in the left column of Table 4.2. A high degree of spatial overlap among symbols complicates recognition for a system based on a spatial representation, which may not be able to distinguish ink from one symbol if it is drawn on top of another symbol. Similarly, a high degree of temporal overlap, or the interspersing of symbol strokes while drawing, complicates recognition for a system that distinguishes symbols based on their temporal patterns. For a conceptually based system, the structural complex-ity of a domain's symbols, as measured here by the length of the LADDER shape descriptions for the symbols [23], increases the difficulty of recognition for a domain. A symbol with a longer description has a greater number of subcomponents that may be incorrectly located or classified.
Family Tree Flow Chart Circuit
Mean Symbol Overlap in Pixels 565.2 297.9 43.8
(a spatial metric)
Percentage Interspersed Symbols 3.8 5.5 22.0
(a temporal metric)
Mean Symbol Description Length 3.8 7.2 7.9
(a conceptual metric)
Table 4.2: Domain complexity measures.
Table 4.2 contains values for each of the properties described above for each do-main. Rows in Table 4.2 correspond to the rows of Table 4.1, i.e., mean symbol overlap is a spatial complexity measure. Low numbers in Table 4.2 indicate less com-plex recognition problems (for example, the description length value of 3.8 in the third row is the smallest in that row, suggesting that the family tree domain is the simplest domain when viewed conceptually). Those cells with lowest values in Table 4.2 (the least complex recognition problems) correspond to the highest recognition rates in Table 4.1. This relationship is shown graphically in Figures 4-1, 4-2 and 4-3. These figures illustrate that recognition is more accurate in less complex domains. This mirrors our intuition that performance on an easy problem is likely to be better than performance on a harder problem.
15 25 35 45 55
Increasing recognition rate
-Figure 4-1: The relationship between our spatial domain complexity measure and recognition rates.
0 10 20 30 40 Increasing recognition rate
Figure 4-2: The relationship between our temporal domain complexity measure and recognition rates. recognition rates.
I
E 0 0 cm C 5 15 25 35 45 55Increasing recognition rate
Figure 4-3: The relationship between our conceptual domain complexity measure and recognition rates.
4.2
Symbol Level Complexity
The domain level guidance for selecting the best representation for recognition can be useful: as shown above, a domain may not be equally hard for all recognition systems or methods. However, domains themselves are often not uniform either; even within a domain one representation may be better for recognizing a particular symbol than another. Extending the idea of complexity as a predictor of performance to the symbol level can further improve recognition.