HAL Id: inserm-00144365
https://www.hal.inserm.fr/inserm-00144365
Submitted on 5 Jun 2007HAL is a multi-disciplinary open access archive for the deposit and dissemination of sci-entific research documents, whether they are pub-lished or not. The documents may come from
L’archive ouverte pluridisciplinaire HAL, est destinée au dépôt et à la diffusion de documents scientifiques de niveau recherche, publiés ou non, émanant des établissements d’enseignement et de
Simulation of biphasic CT findings in hepatic cellular
carcinoma by a two-level physiological model.
Marek Kretowski, Johanne Bezy-Wendling, Pierrick Coupé
To cite this version:
Marek Kretowski, Johanne Bezy-Wendling, Pierrick Coupé. Simulation of biphasic CT find-ings in hepatic cellular carcinoma by a two-level physiological model.. IEEE Transactions on Biomedical Engineering, Institute of Electrical and Electronics Engineers, 2007, 54 (3), pp.538-42. �10.1109/TBME.2006.888834�. �inserm-00144365�
This material is presented to ensure timely dissemination of scholarly and technical work. Copyright and all rights therein are retained by authors or by other copyright holders. All persons copying this information are expected to adhere to the terms and constraints invoked by each author's copyright. In most cases, these works may not be reposted without the explicit permission of the copyright holder.
Simulation of Biphasic CT Findings in Hepatic Cellular Carcinoma
by a Two-level Physiological Model
Marek Kretowski
1, Johanne Bézy-Wendling
2, Pierrick Coupe
21
Faculty of Computer Science, Bialystok Technical University, Wiejska 45a, 15-351 Bialystok, POLAND.
2
Laboratoire Traitement du Signal et de l’Image, INSERM U642, Bâtiment 22, Campus de Beaulieu, Université de Rennes 1, 35042 Rennes Cedex, FRANCE.
HAL author manuscript inserm-00144365, version 1
HAL author manuscript
Simulation of Biphasic CT Findings in Hepatic Cellular Carcinoma by a Two-level Physiological Model
Marek Kretowski1, Johanne Bézy-Wendling2, Pierrick Coupe2
1 Faculty of Computer Science, Bialystok Technical University, Wiejska 45a, 15-351 Bialystok,
POLAND.
2 Laboratoire Traitement du Signal et de l’Image, INSERM U642, Bâtiment 22, Campus de Beaulieu,
Université de Rennes 1, 35042 Rennes Cedex, FRANCE.
Abstract: In this correspondence, we present a two-level physiological model that is able to reflect morphology and function of vascular networks, in clinical images. Our approach results from the combination of a macroscopic model, providing simulation of the growth and pathological modifications of vascular network, and a microvascular model, based on compartmental approach, which simulates blood and contrast medium transfer through capillary walls. The two-level model is applied to generate biphasic computed tomography of Hepatocellular Carcinoma. A contrast-enhanced sequence of simulated images is acquired, and enhancement curves extracted from normal and tumoral regions are compared to curves obtained from in vivo images. The model offers the potential of finding early indicators of disease in clinical vascular images.
Keywords: vascular model, compartment model, computed tomography simulation, enhancement curves, Hepatocellular Carcinoma
1. Introduction
Imaging of vascular networks is of major significance for detection and characterization of various pathologies affecting vessels topology, geometry, or function. It allows for detecting early indicators of disease in a non-invasive manner. In this context, models can help to understand the mechanisms underlying image formation, by testing hypotheses concerning pathology origins. It seems obvious that only physiological models can achieve this task [1]. In [2], we proposed an image modeling approach able to represent geometric and haemodynamic properties of vascular networks, down to the
macroscopic level of arterioles and venules (around 50 to 100µm). However, early signs of onset and
development of the disease generally arise at finer scales (i.e., capillaries) and vascular modeling should not therefore be restricted to the macroscopic level. This is especially crucial for realistic contrast material propagation, where simplified solutions as proposed in [15] are of limited use. In this paper, we propose to combine our physiological model with a microscopic compartment one. The originality of this approach lies in the fact that it is neither limited to a purely geometric description as in many macroscopic models (e.g., [3], [4]), nor to a specifically functional one, like in several studies based on compartment models [5]
, [6]
. The strength of the proposed approach is in the combination of the two main aspects influencing vascular imaging: morphology (vessels) and function (contrast medium propagation). Moreover, this two-level approach offers the possibility to simulate enhancement changes related to focal or diffuse vascular diseases.The proposed method is applied to simulating of Hepatocellular Carcinoma (HCC) observed by means of biphasic CT. In hepatic carcinogenesis, tumor evolution expresses itself by important capillarization [7], with arterialization, and decrease in portal supply. Early tumor characterization (benign nodule vs. malignant tumor) is fundamental in the therapy choice, and imaging markers of malignancy are of crucial importance. Our approach offers the potential to reveal this kind of markers due to the modeling chain going from an organ to time stamped sequences of images (see Figure 1).
In Section 2, the macroscopic and microscopic levels of the model are briefly described and the method of the contrast enhanced CT modeling is also explained. The results are summarized in Section 3, and the paper is concluded in the last section.
2. Model
2.1 Macrovascular model
The model enables us to simulate up to three connected vascular structures. It is especially suitable for the liver, with its two supplying trees (Hepatic Artery – HA, and Portal Vein – PV), and Hepatic Vein (HV). The organ is composed of Macro-Functional Units (MFUs), made of tissue and small vessels. Several classes of MFUs can co-exist in the organ. Variations of physiological properties (such as blood pressure and flow, or time dependent mitosis/necrosis rates) allow us to introduce pathological changes. At each growth cycle of the organ, new MFUs appear, and are perfused by new vessels sprouting from the existing network (angiogenesis). A local optimization process is performed to determine new bifurcations geometry, respecting the minimum blood volume criterion. Each binary tree is composed of consecutive vessel segments (rigid tubes with wall thickness depending on their type and radius), characterized by their geometry, blood pressure and flow (governed by Poiseuille law). After perfusion of a new MFU, characteristics of the vascular structures (blood flow, pressure and radii) are updated [8]. As shown in Figure 1, an independent microscopic model represents each MFU.
2.2. Microvascular model
Compartment models have been applied recently to simulation of vessels/tissue exchanges ([9], [10]) or to estimation of perfusion and capillary permeability [11]. In contrast to such global models our approach enables to locally compute the contrast medium concentration. It also takes into account the portal circulation and integrates liquid movements (not only molecular transfer). Moreover, the direct coupling between the microvascular and the macrovascular models allows us to generate not only enhancement curves, but also dynamic enhanced images.
The model entries are the two blood supplies coming from hepatic arteriole (ha), and portal venule (pv). They are characterized by their flows, Qha
( )
t and Qpv( )
t , and contrast medium concentrations,) (t
Cha and Cpv(t), which are deduced from contrast medium propagation in the macroscopic model.
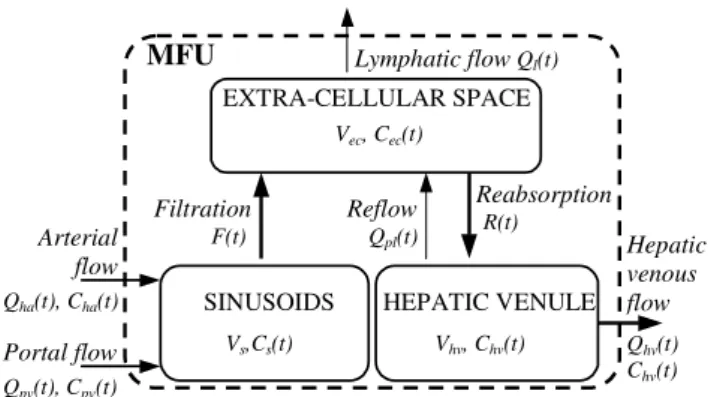
The three compartments of the model are depicted in Figure 2: “sinusoids”, “extra-cellular space” and “hepatic venules”. Blood arriving in the sinusoids is mixed with contrast medium at the concentration
) (t
Cs and goes through the capillary wall into the extra-cellular space with the flow F(t). Plasma and
contrast medium molecules can exit the extra-cellular space compartment by two possible ways: (i) due to the hydrostatic and osmotic pressures [12] toward hepatic venules, with flowR(t), and (ii) toward lymphatic capillaries, with flow Ql(t). In this compartment, the liquid has the concentration
( )
ec
C t . Finally, blood leaves MFU by hepatic venule, with flow
Q t
hv( )
. The re-flow Qpl(t) fromhepatic venules into extra-cellular space [13] is also integrated into the model. The contrast medium
concentration in the third compartment isChv(t). As the macroscopic vascular model does not
currently include the lymphatic circulation, the lymphatic flow from the extra-cellular space (Qpl(t)) is
artificially connected to the venous circulation (Qhv(t)) leading to only one output: the hepatic venous
flow.
In order to study variations in concentration in the different compartments, we formalized exchanges by the following differential equations:
( ) ( ) ( ) ( ) ( ) ( ) ( ) s s ha ha pv pv s dC t V C t Q t C t Q t C t F t dt = + − , (1) ( ) ( ) ( ) ( ) ( ) ( )( ( ) ( )) ec ec s hv pl ec l dC t V C t F t C t Q t C t R t Q t dt = + − + , (2) ( ) ( ) ( ) ( )( ( ) ( )) hv hv ec hv pl hv dC t V C t R t C t Q t Q t dt = − − . (3)
The compartment volumes (Vs,Vec,Vhv) are obtained by dividing the corresponding volumes (sinusoids,
extra-cellular, and hepatic vein) of the liver by the number of MFUs constituting it. For transvascular
flows, we used general circulation data, leading to the following relations [5]: F=Qha +Qpv,
F
R=0.84 , Ql=0.21F, and Qpl =R+Ql−F.
Even if the macroscopic model currently sets the same pressure to all MFUs, microvascular blood flows (F, R, and Qpl) depend on hydrostatic and osmotic pressures. The flow evolution with pressures
and permeability can be easily integrated by using equations like the one of F [5]:F=Ks*
(
Ps −Pec−π +pl πi)
, where Ps and Pec are hydrostatic pressure in sinusoids andcellular space, πpl and πi are corresponding osmotic pressures. Coefficient Ks reflects the capillary
permeability.
2.3. Biphasic CT modeling
The first step to simulate dynamic CT [15] is injection of contrast medium into HA and PV. It propagates through vessels and parenchyma. The concentration of the contrast medium is calculated in all the macroscopic vessels, as well as in each MFU. A 3D representation is generated, where each voxel is assigned an attenuation coefficient depending on its composition (blood/parenchyma/contrast medium). Then, the CT scan acquisition is carried out through the following steps: (i) X-ray cone beam projections with noise-added are computed using the Radon transform, (ii) projections are filtered in the Fourier domain, by a band-limited filter, and (iii) a back-projection is applied to reconstruct the image. Virtual CT simulation is described in more details in [2]. It should be noticed that in this model of CT acquisition, certain simplifications have been made concerning e.g. the surrounding anatomical structures are not present.
3. Results
We applied the proposed two-level model to simulation of biphasic CT of the liver affected by HCC. HCC is the most common hyper-vascular hepatic malignant tumor. The main parameters of the macroscopic model, with some details concerning among other things initialization (external organ envelope, initial vessels, ...) and growth simulations can be found in [2] and [15]. Different classes of MFUs are used to simulate normal parenchyma and a focal lesion. Abnormal MFUs are introduced among normal ones, in a bounded area of the organ. Tumoral MFUs co-exist with the healthy ones, and evolve with them, in a succession of regeneration events (mitosis/necrosis). Some parameters of pathological MFUs are modified (e.g., probability of mitosis, maximum local density and blood flow are increased in the pathological case, compared to healthy tissue). Moreover, these MFUs are only supplied by arteriole and not by portal venule [7]. Significantly increased blood flow (4 times compared to normal tissue) in arterial and absence of portal supply constitute differences between normal liver and HCC simulated at the microscopic level.
Profiles used for contrast medium injection are taken from [10]. Compartments volumes are adapted to the volume of the MFU (total hepatic volume divided by the number of MFUs, which is around 12000 at the end of the organ growth): Vs =57ml/12000, Vec
=
524ml/12000, Vhv =15 /12000ml [12].Figure 3 shows simulated vessels of HA, in two regions: normal and HCC. Tumor arterialization of nodules and HCC can be observed. Figure 4 shows three simulated vascular trees displayed at two acquisition times, typically used in clinical examinations: (i) arterial phase (20 to 30 seconds after injection), when the iodinated x-ray dye is mainly in HA, not in PV and arrives in HV only in the tumor, and (ii) portal phase, when a large amount of dye arrives in the portal tree. This 3D visualization allows us to isolate the lesion during the arterial phase and confirms its significance for hypervascular tumor characterization. In Figure 5a, simulated CT scans (slice thickness - 5mm, pixel size 0.125mm, 8-bit gray levels, ...) of the same trees as in figure 4 are presented. As expected, HCC is hyper-intense in the first phase, due to the large contrast concentration in HA (an artery pointed by white arrows). During the second phase, the lesion conspicuity decreases significantly. This can be explained by an increase of normal parenchyma enhancement, resulting from contrast supplied by portal vein (strongly injected portal vein pointed by black arrow). In Figure 5b, simulations of CT findings concerning a few times smaller tumor placed at the same location are presented. It can be noticed that the tumor conspicuity evolves over time in analogous way and the lesion is still visually detectable in arterial phase. However, when the arterial supply is decreased for HCC (50% of the previous blood flow), the lesion becomes not visible even in HA (Figure 5c).
The direct comparison of the simulated CT scans with the real data is not an easy task, because, except for CT images, we usually have only partial knowledge about the pathological changes for a given patient. In clinical conditions, structural and functional characteristics of the lesion are obviously inaccessible. In Figure 6, typical HCC patterns in two standard phases are presented. We observed that the general agreement is satisfactory, however the real tumor is more heterogeneous (maybe due to necrosis in the center).
Finally, the enhancement curves computed in normal parenchyma and tumor are represented in Figure 7. They have been obtained using a representative set of physiological and physical parameters. Then
these simulated curves have been compared with those measured by Kim et al. on 24 patients [10]. We would like to stress that we obtained a good agreement between simulated and real enhancement curves. Influence of parameters will be evaluated in future works.
4. Conclusion
In this paper, we proposed a two-level physiological model combining macroscopic and microscopic vascular properties. The model enables to relate first signs of microvascular pathological alterations to changes in clinical images. The proposed approach is exemplified by simulation of biphasic CT of Hepatocellular Carcinoma and the impact of certain tumor characteristics (i.e. tumor size and arterial supply) on the lesion conspicuity is studied. Visual patterns and enhancement curves derived from simulated scans are in good agreement with real data, however this tentative validation has to be extended. This study demonstrates that the model-based method constitutes a good way toward a better interpretation of clinical images and could be useful in finding early image indicators of a disease, like measurable vascular changes corresponding to the development of HCC.
It is natural that presented models can be extended in many directions. For example, in the compartment model, a direct communication between the sinusoids and the hepatic venules can be incorporated and additional functional parameters can be introduced, like the capillaries permeability (via pore sizes and number or the basal membrane structure). The macro-vascular model can profit from more elastic vessels representation (e.g., based on Bezier curves). Moreover, the simplified cone beam scanning can be replaced by multi-slice acquisitions.
Acknowledgements
The authors are grateful to Prof. Jean-Louis Coatrieux for his support and inspiring discussions. This work was supported by the grant W/WI/5/05 from Bialystok Technical University.
Figure 1:
Figure 2: MFU EXTRA-CELLULAR SPACE Vec, Cec(t) SINUSOIDS Vs,Cs(t) HEPATIC VENULE Vhv, Chv(t) Arterial flow Portal flow Qha(t), Cha(t) Qpv(t), Cpv(t) Hepatic venous flow Qhv(t) Chv(t) Filtration F(t) Reabsorption R(t) Reflow Qpl(t) Lymphatic flow Ql(t)
Figure 3 :
11
Fig ure 4: H A PV HV Arterial phase Portal phaseFigure 5:
Arterial phase Portal phase
a)
b) c)HA
PV
HCC
normal
HCC
normal
HCC
HCC
HCC
HCC
Figure 6:
a) b)
Figure 7:
List of figure and table captions:
Fig. 1 Framework of the model-based approach to medical images understanding. Two-level vascular model is coupled with virtual CT modality. During the contrast medium propagation at given time instants, density representations are generated and then CT scans are reconstructed based on classical algorithm of filtered back-projections. More details can be found in [2].
Fig. 2 Three-compartment microscopic model proposed for simulating of hepatic transvascular exchanges.
Fig. 3 Simulation of hepatic arterial structure in normal liver (left) and HCC (right, the hyper-vascular tumoral region is denoted by circle).
Fig. 4 Simulation of contrast medium propagation (only injected vessels are displayed; gray level corresponds to contrast concentration).
Fig. 5 Simulated biphasic CT scans (slice thickness - 5mm, pixel size 0.125mm, 8-bit gray levels, ...):
a) extensive lesion – HCC, b) smaller tumor, c) the same lesion as in b) but with decreased
arterial supply.
Fig. 6 Real CT slices with confirmed diagnosis of HCC in arterial (a) and portal (b) phase. Fig. 7 Enhancement curves derived from normal and tumoral ROIs depicted in Figure 5a.
References:
[1] J.Demongeot, J. Bezy-Wendling, J. Mattes, P. Haigron, N. Glade, J.L. Coatrieux, “ Multiscale Modeling and Imaging: The Challenges of Biocomplexity”, Proc. of the IEEE, 91(10), pp. 1723-1737, 2003.
[2] M. Kretowski, Y. Rolland, J. Bezy-Wendling, J.L. Coatrieux, “Physiologically based modeling of 3-D vascular networks and CT-scan angiography”, IEEE Trans. Med. Im., 22(2), pp. 248-257, 2003.
[3] M. Zamir, “Arterial branching within the confines of fractal L-system formalism”, Journal of General Physiology, 118, pp. 267-275, 2001.
[4] J. Bezy-Wendling, M. Kretowski, Y. Rolland, W. Le Bidon, “Toward a better understanding of texture in vascular CT scan simulated image”, IEEE Trans. Biomed. Eng., 48(1), pp. 120-124, 2001.
[5] J.L. Bert, K.L. Pinder, “Analog simulation of the human microvascular exchange system”, Simulation, 39, pp. 89-95, 1982.
[6] R. Materne et al., “Non-invasive quantification of liver perfusion with dynamic CT and a dual input one-compartmental model”, Clinical Science 99, pp. 517-525, 2000.
[7] S.C. Efremidis, P. Hytiroglou, “The multistep process of hepatocarcinogenesis in cirrhosis with imaging correlation”, Eur. Radiol, 12, pp. 753-764, 2002.
[8] M. Kretowski, Y. Rolland, J. Bézy-Wendling, J.L. Coatrieux, “Fast algorithm for 3-D vascular tree modeling”, Computer Methods and Programs in Biomedicine, 70 (2), pp. 129-136, 2003. [9] K.T. Bae, J.P. Heiken and J.A. Brink, “Aortic and hepatic contrast medium enhancement at CT,
prediction with a computer model”, Radiology 207, pp. 647-655, 1998.
[10] S. Kim, J.H. Kim, J.K. Han, K.H. Lee, B.G. Min, “Prediction of optimal injection protocol for tumor detection in contrast-enhanced dynamic hepatic CT using simulation of lesion to liver contrast difference”, Computerized Medical Imaging and Graphics 24, pp. 317-327 (2000). [11] G. Brix et al., “Regional blood flow, capillary permeability, and compartmental volumes:
measurement with dynamic CT – initial experience”, Radiology 210, pp. 269-276, 1999.
[12] E. Carson, C. Cobelli, “ Modelling Methodology for Physiology and Medicine”, Academic Press, 2001
[13] C. Chapple et al., “A model of human microvascular exchange: parameter estimation based on normals and nephrotics”, Computer Methods and Programs in Biomedicine 41, pp. 33-54, 1993. [14] B. Fagrell, “Advances in microcirculation network evaluation: an update”, J. Microcirc. 15, pp.
34-40, 1995.
[15] J. Bézy-Wendling, M. Kretowski, Y. Rolland, “Hepatic tumor enhancement in CT: combined models of liver perfusion and dynamic imaging”, Comp. in Biol. and Med., 33, pp. 77-89, 2003.