HAL Id: hal-01616446
https://hal.archives-ouvertes.fr/hal-01616446
Submitted on 16 Oct 2017
HAL is a multi-disciplinary open access
archive for the deposit and dissemination of
sci-entific research documents, whether they are
pub-lished or not. The documents may come from
teaching and research institutions in France or
abroad, or from public or private research centers.
L’archive ouverte pluridisciplinaire HAL, est
destinée au dépôt et à la diffusion de documents
scientifiques de niveau recherche, publiés ou non,
émanant des établissements d’enseignement et de
recherche français ou étrangers, des laboratoires
publics ou privés.
Multicriteria 3D PET image segmentation
Francisco Javier Alvarez Padilla, Eloïse Grossiord, Barbara Romaniuk, Benoît
Naegel, Camille Kurtz, Hugues Talbot, Laurent Najman, Romain Guillemot,
Dimitri Papathanassiou, Nicolas Passat
To cite this version:
Francisco Javier Alvarez Padilla, Eloïse Grossiord, Barbara Romaniuk, Benoît Naegel, Camille Kurtz,
et al.. Multicriteria 3D PET image segmentation. Image Processing Theory, Tools and Applications
(IPTA), 2015, Orléans, France. pp.346-351, �10.1109/IPTA.2015.7367162�. �hal-01616446�
Multicriteria 3D PET image segmentation
Francisco Javier Alvarez Padilla1,2, ´Elo¨ıse Grossiord3,6, Barbara Romaniuk1, Benoˆıt Naegel2, Camille Kurtz4,
Hugues Talbot3, Laurent Najman3, Romain Guillemot1, Dimitri Papathanassiou1,5, Nicolas Passat1 1Universit´e de Reims Champagne-Ardenne, CReSTIC, France
2Universit´e de Strasbourg, ICube, CNRS, France 3Universit´e Paris-Est, ESIEE-Paris, LIGM, CNRS, France
4Universit´e Paris-Descartes, LIPADE, France 5 Institut Jean-Godinot, Reims, France
6KeoSys, Nantes, France
Abstract— The analysis of images acquired with Positron Emis-sion Tomography (PET) is challenging. In particular, there is no consensus on the best criterion to quantify the metabolic activity for lesion detection and segmentation purposes. Based on this consideration, we propose a versatile knowledge-based segmen-tation methodology for 3D PET imaging. In contrast to previous methods, an arbitrary number of quantitative criteria can be involved and the experts behaviour learned and reproduced in order to guide the segmentation process. The classification part of the scheme relies on example-based learning strategies, allowing interactive example definition and more generally incremental refinement. The image processing part relies on hierarchical segmentation, allowing vectorial attribute handling. Preliminary results on synthetic and real images confirm the relevance of this methodology, both as a segmentation approach and as an experimental framework for criteria evaluation.
Keywords— Positron Emission Tomography, knowledge-based system, example-based learning, hierarchical segmentation.
I. INTRODUCTION
Positron Emission Tomography (PET) constitutes the gold-standard for image-based diagnosis and patient follow-up for several kinds of cancers. In particular, 3D PET images provide useful information about the metabolic activity of lesions. In contrast to other 3D imaging modalities, including Magnetic Resonance Imaging (MRI), or X-ray Computed Tomography (CT), PET images have a low spatial resolution and present several acquisition, reconstruction and anatomical artifacts, that can be often associated to hyperfixating organs. These properties result in poor images, that are still mostly handled and processed via basic approaches, such as fixed or adaptive thresholding [1], [2].
The classical pixel-based criteria involved both for de-tection, segmentation and quantification of lesions also re-main basic. A representative example of such criteria is the Standardized Uptake Value (SUV) – and its variants – that constitutes, despite its limitations [3], the current gold-standard for analysis of metabolic activity of cancer lesions in PET. However, due to the increasing need for efficient PET image analysis, segmentation strategies have recently emerged, that can be used both for detecting the lesions and determining volumes of interest for further metabolic quan-tification. Most of these methods [4] rely on intensity-based approaches, such as thresholding, region-growing, watershed and classification. These methods use few a priori information.
As a consequence, they can lead to inaccurate segmentation results where lesions are mixed-up with hyperfixating organs. Other approaches also intend to embed additional information. We can mention here for example the use of shape priors [5] or anatomical (spatial or functional) context [6], [7] in particular by considering MRI / PET or CT / PET images. In all these strategies, the priors are limited in number, defined beforehand and considered a priori as correct, thus constituting hard parameters in a process-based segmentation paradigm.
Our working hypotheses rely on another paradigm, and derive from the statement that there does not exist any con-sensus related to the most relevant criteria for segmenting cancer lesions in PET images. In this context, it makes sense to rely on the end-user’s expertise and to authorise the simultaneous use of various criteria, without requiring to know a priori their actual relevance. In other words, we propose to rely on a knowledge-based segmentation paradigm, that aims to learn the expert knowledge carried by their behaviour when analysing 3D PET images, and to use it to reproduce this behaviour in interactive and robust lesion segmentation strategies.
In order to tackle these issues, two main tasks have to be considered. On the one hand, given a set of criteria, and some positive (lesions) and negative examples (hyperfixating organs) marked in PET images, some learning strategies have to be considered to build a classification model. This model enables to discriminate relevant from non-relevant imaging criteria to characterize cancer lesions. This point is discussed in Section II, with a focus on strategies relying on limited sets of examples. It allows in particular to finely tune the expert-specific combination of criteria, potentially useful for unbiased analysis in the context of patient follow-up. On the other hand, the way to embed the information carried by multiple criteria into a segmentation method has to be dealt with. In Section III, we show that the framework of morphological hierarchies allows to explicitly model the heterogeneous values of these criteria via the notion of attribute filters. In particular, it can be used both for segmentation and for interactive example definition. These two steps are then combined to form an incremental and mutually enriching learning / segmentation methodology whose ultimate goal is to determine volumes of interest centered on cancer lesions. In Section IV, we validate this methodology, quantitatively on phantom images,
and qualitatively on real 3D PET images, where results are compared with manual ROI delineation. In this context, several criteria are considered and tested, either already proposed in the literature or new and potentially useful.
II. KNOWLEDGE EXTRACTION FROM EXAMPLES
Starting from a set of quantitative imaging criteria, the knowledge extraction task consists here of automatically learn-ing, from examples defined in PET 3D volumes, what are the most discriminative imaging criteria to guide the image segmentation process to the most relevant lesion delineation results.
To this end, the first step is to allow the expert to select positive and negative examples in PET images, corresponding respectively to lesions and hyperfixating organs. This step provides a learning database and is carried out by nuclear radiologists using an interactive 3D stereoscopic visualization approach (described in Section III-B) based on multimodal imaging. Different strategies can then be considered:
1) ask the radiologist to provide positive and negative examples from a new PET scan, extract knowledge from this set and then use it to segment the remainder lesions contained in this scan;
2) for a given type of pathology and radiotracer, ask the radiologist to provide positive and negative examples from a reference scan, extract knowledge from this set and then use it to automatically segment the lesions con-tained in a new scan acquired under the same conditions as the reference scan;
3) for a given type of pathology and radiotracer, ask the radiologist to provide positive and negative examples from a set of relevant and previously interpreted scans, extract knowledge from this set and use then it to automatically segment the lesions contained in a new scan.
In the 2nd and 3rd strategies, exhaustive positive examples extraction is recommended but is not required. In this work, we considered the third strategy. It enables to benefit from the potential visual diversity of lesions and hyperfixating organs among different scans thus making more robust the learning step.
Once the learning database is built, the next step is to learn from this dataset what are the most relevant imaging criteria to separate lesions from hyperfixating organs. To this end, some learning strategies have to be considered to build a 3-class classification model. These 3 classes are lesions, hyperfixating organs and other “non-relevant” imaging areas. The main difficulty is to consider strategies that can rely on limited sets of examples. These strategies should allow to finely tune the expert-specific combination of criteria, potentially useful for unbiased analysis of patient follow-up. In addition, they must be robust to imbalanced datasets, a problem that occurs if at least one of the classes is represented by significantly smaller number of instances.
To deal with this double issue, we focus in this preliminary study on specific supervised classification algorithms that have
been shown to be efficient when the number of training examples is small. Based on the results obtained in [8], we chose a classification strategy based on Decision Trees (C4.5). The C4.5 tree tries to recursively partition the data set into subsets by evaluating the normalized information gain resulting from choosing a criterion for splitting the data. The criterion with the highest information gain is used on every step. The training process stops when the resulting nodes contain instances of single classes or if no criterion can be found that would result to the information gain. We used the J48 implementation of the C4.5 algorithm [9]. We set as 2 the minimum number of instances per leaf. Once the decision tree has been built, we use the unpruned version of the tree to classify the data.
The output classification model can then be considered in the knowledge-based segmentation step to select the regions of interest from the PET image segmentation results that could correspond to active lesions providing decision support for cancer detection and metabolic quantification. It can also be used in the case of interactive example definition.
III. KNOWLEDGE-BASED SEGMENTATION
A. Hierarchical segmentation guided by criteria
The learning step of the proposed methodology can present a high computational cost. This is due to the size of the parameter space, the number of examples, and the algorithmic processes considered for classification. This is not actually a problem, as computation can be performed off-line, and does not require any interaction once the examples have been pro-vided. By contrast, the segmentation step should be carried out in real-time or at least interactive-time due to the constraints of clinical routine. As a consequence, the underlying processes should present efficient algorithmic complexities. In addition, the involved data-structures should be sufficiently versatile to model information carried by several criteria.
A solution to this double issue consists of using connected operators [10] defined in mathematical morphology. More precisely, we propose to use the notion of component-tree introduced by Salembier [11] (Figure 1). This data structure can be used to develop efficient, i.e., quasi linear time seg-mentation procedure. It works by decomposing the image into basic element, each being associated to a given attribute. In particular, vectorial attributes can be considered [12]. Multiple criteria can be used in modeling. The component-tree is well-adapted to deal with images where the structures of interest correspond to locally maximal values, as for angiographic [13] or PET images [14].
Indeed each node of the tree corresponds to a connected component of a level-set of the image; the extremal nodes of the tree then correspond to the areas of highest intensities. In addition, the component-tree does not modify the contours of the segmented structures of interest and potentially allows to embed fuzzy modeling [15]. This is a desirable property for images with fuzzy borders, that is the case for PET images (see Figure 2).
(a) I A B C D,E K L M N F,G H,I,J O,P (b) CT A (c) λ0(I) D H B D (d) λ1(I) D I C F E (e) λ2(I) J C G K O (f) λ3(I) N C L M P (g) λ4(I)
Fig. 1. The component-tree as a hierarchical image model. (a) A grey-level image I. (c–g) The five grey-level-sets λ⋆(I) of I obtained by successive
thresholding. Each connected component is labeled by a letter (A, B, . . . ). (b) The component-tree CT of I, which models the hierarchical inclusion of these connected components, thus providing a mixed spatial / spectral lossless model of I.
Practically, the multicriteria-guided segmentation step pro-ceeds as follows. The component-tree of the 3D PET image is first computed in quasi-linear time. This construction basically consists of thresholding the image for each grey-level value; computing the connected component of each binary (thresh-olded) image; and organizing these components as the nodes of a tree that is structured with respect to the standard inclusion relation on sets [16]. Each node of the tree then corresponds to a region of the image, with specific space and intensity properties. The criteria of each region can then be computed and stored as a vectorial attribute at the corresponding node. A ternary classification of these attributes, with respect to the classification model trained from the previous step, then allows us to discard the nodes that do not correspond to lesions. The adopted approach only preserves the regions of interest, with an explicit discrimination between active lesions and hyperfixating organs.
Since the component-tree is a lossless model of the image, the segmentation result can then be reconstructed from the
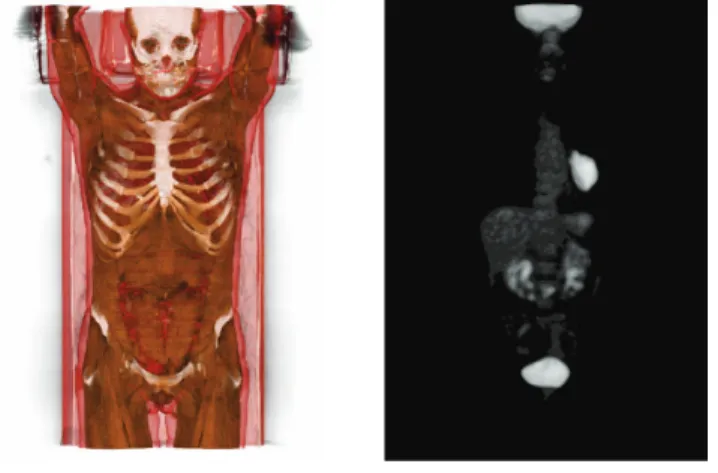
Fig. 2. Multimodal visualization of CT / PET images. The two images – viewed here separately for the sake of readability – are fused (volumic rendering) and visualized in 3D (autostereoscopic device) under the MINT Software (https://mint.univ-reims.fr). Left: CT image, with a tissue-based color rendering. Right: PET image (FDG), with a pulmonary tumor.
remaining set of nodes, then preserving the initial intensities of the PET image in the segmented areas.
B. Interactive example definition
In order to feed the learning process (presented in Section II) that needs to be trained with multicriteria values of lesions, hyperfixating organs, and other “non-relevant” areas, it is mandatory to be able to easily build regions of interest from 3D PET images. To reach that goal, we propose to use an interactive segmentation approach to generate examples that correspond to nodes of a component-tree. This is done in two successive steps.
The first step consists of determining regions of interest in images. Basically, in clinical routine, this is generally done by manually defining bounding boxes consisting of squares, spheres or ellipses on the 3D PET image volume, or more generally on 2D slices. We propose here to improve this process by using the multimodal imaging, namely by coupling the visualization of PET and CT images. We also propose to rely on a 3D stereoscopic visualization. This allows both to better see 3D lesions in their anatomical context, and to define actual 3D regions of interest (see Figure 2).
Once regions of interest were defined, it remains mandatory to translate them into the closest nodes of the component-tree, i.e., connected components within the level-sets of the considered PET image. Efficient algorithms were recently proposed for determining such closest nodes, with respect to a false positive / negative ratio metric, with a linear-time complexity [17].
Based on these two steps, the expert can then determine, for any PET image used during the learning step, the regions associated to lesions and hyperfixating organs. In practice, it consists of determining the nodes of the component-tree asso-ciated to the PET image, that correspond to true positives and false positives, versus all other “non-relevant” nodes. Then,
the vectorial attributes associated to these nodes (Section IV-B) can be automatically computed.
It is important to notice that this step can be performed beforehand, but also carried out as the post-processing of a knowledge-guided segmentation (Section III-A), where the expert modifies, improves and / or corrects the obtained results, thus allowing to develop an iterative process, both with respect to segmentation and learning.
IV. EXPERIMENTS AND RESULTS
A. Dataset
We used in these experiments a set of PET / CT 3D images obtained from N = 12 patients. These images were acquired with a Gemini-Dual (Philips) PET / CT camera, according to a standard protocol for cancer imaging: PET acquisition, 3 minutes each bed position, from the pelvis to the base of the skull, one hour after the peripheral intravenous injection of 5 MBq / kg (0.135 mCi / kg) of18F-FDG in patients fasted
for at least 6 hours before; and low dose CT without contrast agent (standard acquisition parameters: 100 mAs; 120 kV tube voltage; 1.5 pitch; 6.5 mm slice thickness). PET images were obtained with the RAMLA 3D algorithm (2 iterations), with CT-based attenuation correction, and their spatial resolution (FWHM) was approximately 4 × 4 × 4 mm3.
B. Potential criteria for PET segmentation
The proposed methodology allows us to involve a set of criteria of arbitrary size. In the following experiments, various kinds of attributes were considered, thus enabling to assess the relevance of the associated criteria. They can be grouped as follows:
1) spectral attributes: contrast (difference between the ex-tremal values of voxels);
2) spatial attributes: area (number of voxels), volume (num-ber of voxels weighted by their values);
3) mixed attributes: volumic contrast (volume × contrast); 4) geometrical attributes: ratios between the eigenvalues of the matrix of inertia [18] (including compactness / elongation characterization);
5) spatial attributes: coordinates of the barycenter. All of these considered attributes can be interpreted numeri-cally.
C. Learning of the classification model
The first step of the knowledge extraction step is to populate the learning database with multicriteria values of lesions, hyperfixating organs, and other non-relevant areas extracted from the N PET images presented above. To this end, for each image, a nuclear radiologist employed the interactive segmen-tation approach described in Section III-B to generate positive and negative examples, that actually correspond to nodes of a component-tree. This task led to the interactive selection of 1385 nodes composed of 913 nodes corresponding to lesions, 112 nodes corresponding to hyperfixating organs, and 360 nodes corresponding to “non-relevant” image areas. Then, the multi-dimensional attribute vectors associated to these nodes
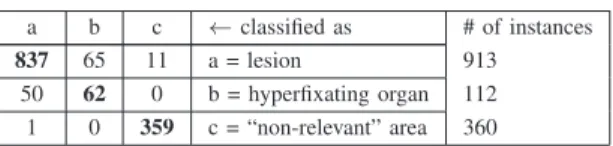
Table 1.Confusion matrix obtained with the C4.5 classification model and the leave-one-patient-out cross-validation strategy.
a b c ← classified as # of instances 837 65 11 a = lesion 913
50 62 0 b = hyperfixating organ 112 1 0 359 c = “non-relevant” area 360
were automatically computed, resulting in a training database of 1385 instances.
Given the small size of our database, our goal was to maximize learning from the data. Consequently, we use the same database for training and evaluating the decision tree model, but we take steps to avoid biasing the results. To avoid any overfitting problem, we used a leave-one-patient-out (LOPO) cross-validation strategy. We withheld all the exam-ples obtained from one of the N patient images considered in the dataset and we used the learning strategy described previously to learn from the samples linked to the remaining N − 1 patient images to train the classification model and to extract the most relevant attributes. This experiment was repeated for all the patient images composing the dataset.
Based on this LOPO cross-validation, we quantitatively evaluated the quality of the knowledge extraction step. We observed that 1258 instances (90.83%) were correctly classi-fied while 127 instances (9.17%) were incorrectly classiclassi-fied. The Kappa statistic is 0.817 and the mean absolute error of the classification model is 0.063. The confusion matrix is presented on Table 1. From this matrix, one can note that the classification model is adapted to separate lesions and hyperfixating organs from “non-relevant” image areas but leads to different confusions between lesions and hyperfixating organs.
From the decision tree structure, we also learn that the mean grey-level, the contrast and the compactness / elongation criteria are the most discriminative criteria to separate lesions and hyperfixating organs from non-relevant image information. The classification model built is then used in the next step to guide the segmentation process, based on component-tree, to segment cancer lesions. Experiments are evaluated according to the three aforementioned most discriminative criteria. D. Experimental results
The first stage of experiments was made with a physical phantom, namely the NEMA 2007 IEC image quality phan-tom, filled with 70 MBq of 18F. This phantom contains six
spherical “lesions” with respective diameters of 10, 13, 17, 22, 28 and 37 mm (see Figure 3, left). In this context, the physical ground truth gives a direct access to the relevant sets of criteria that correspond to the target, namely spheres with high intensities. The segmentation of the image is based on the most discriminative criteria computed during the learning step. The component-tree of the image is pruned, based on a thresholding of the vectorial attributes of the nodes. After this process, only the nodes corresponding to the spheres of interest are kept. Then finally, the segmented image is reconstructed
Fig. 3. Left: initial phantom (2D slice). Right: segmentation result.
from the filtered tree. The segmentation results are depicted in Figure 3 (right). One can notice that even the smallest sphere was retained as a lesion by our segmentation process.
The second stage of experiments was made on the real PET images as described in Section IV-A. Following a leave-one-patient-out approach, each image is processed by using the training set computed on all the other images. More precisely, the image segmentation is based on the following steps:
1) component-tree computation (including vectorial at-tributes computation for each node);
2) selection of a set of nodes of interest, based on a thresholding of the retained criteria;
3) three-class classification (model trained in Section IV-C) of the remaining nodes in order to discard more finely the false positives.
Two examples of PET images and segmentation results are illustrated in Figures 4 and 5. In these examples, it appears that the involved intensity and shape criteria are indeed sufficient to correctly detect a majority of lesions from other structures. Such results tend to prove the relevance of considering a space of multiple criteria. One can however observe that few false positives and false negatives are also present, in relation with hyperfixating organs. This emphasises the necessity to further enrich the space of criteria with more spatial and relational information.
V. CONCLUSION AND PERSPECTIVES
The proposed methodology provides new insights for han-dling several criteria, and using this rich basis of knowledge to better capture the expertise of end-users.
In this preliminary study, the learning step has been consid-ered for reduced sets of examples, via supervised classification approaches. This modus operandi is well adapted for expert-specific cases. In further works, we will investigate new strate-gies based on “one-shot learning” that rely on the principle of knowledge transfer, which encapsulates prior knowledge of learned categories and allows for learning on minimal training examples [19]. Another research direction relies on “active learning” strategies in which a learning algorithm is able to interactively query the user to obtain the categories at new data points and that are well adapted to deal with imbalanced datasets [20].
Concerning the considered elements of knowledge, the intensity and geometrical / morphological criteria will also
Fig. 4. Left: PET image (2D slice) with manual delineation of lesions. Right: segmentation result (in red).
Fig. 5. Left: PET image (2D slice) with manual delineation of lesions. Right: segmentation result (in red).
be completed by structural and relational criteria [21], derived from anatomical information available in CT or MRI images. Such approach may facilitate the discrimination of false pos-itives in PET images, corresponding to hyperfixating organs based for example on their spatial relations. This will imply in particular to consider multimodal images, namely PET / CT or MRI / PET. In contrast to previous works, we will process these morphological and functional images in a unified way, based on recent extensions of the hierarchical framework considered in this study [22].
REFERENCES
[1] Q. C. Black, I. S. Grills, and L. K. Larry et al., “Defining a radiotherapy target with positron emission tomography,” Int J Radiat Oncol, vol. 60,
pp. 1272–1282, 2004.
[2] U. Nestle, S. Kremp, and A. Schaefer-Schuler et al., “Comparison of different methods for delineation of18F-FDG PET-positive tissue for
target volume definition in radiotherapy of patients with non-small cell lung cancer,” J Nucl Med, vol. 46, pp. 1342–1348, 2005.
[3] I. Buvat, “Understanding the limitations of SUV,” Med Nucl, vol. 46, pp. 165–172, 2007.
[4] T. Shepherd, M. Ter¨as, and R. Beichel et al., “Comparative study with new accuracy metrics for target volume contouring in PET image guided radiation therapy,” IEEE T Med Imaging, vol. 31, pp. 2006–2024, 2012. [5] T. Shepherd, S. J. D. Prince, and D. C. Alexander, “Interactive lesion segmentation with shape priors from offline and online learning,” IEEE T Med Imaging, vol. 31, pp. 1698–1712, 2012.
[6] J. Wojak, E. D. Angelini, and I. Bloch, “Joint variational segmentation of CT-PET data for tumoral lesions,” in ISBI, Proc., 2009, pp. 217–220. [7] U. Bagci, J. K. Udupa, and N. Mendhiratta et al., “Joint segmentation of anatomical and functional images: Applications in quantification of lesions from PET, PET-CT, MRI-PET, and MRI-PET-CT images,” Med Image Anal, vol. 17, pp. 929–945, 2013.
[8] C. Salperwyck and V. Lemaire, “Learning with few examples: An empirical study on leading classifiers,” in IJCNN, Proc., 2011, pp. 1010– 1019.
[9] R. Quinlan, C4.5: Programs for Machine Learning, Morgan Kaufmann Publishers, 1993.
[10] P. Salembier and M. H. F. Wilkinson, “Connected operators. A review of region-based morphological image processing techniques,” IEEE Signal Process Mag, vol. 26, pp. 136–157, 2009.
[11] P. Salembier, A. Oliveras, and L. Garrido, “Anti-extensive connected operators for image and sequence processing,” IEEE T Image Process, vol. 7, pp. 555–570, 1998.
[12] E. R. Urbach, N. J. Boersma, and M. H. F. Wilkinson, “Vector attribute filters,” in ISMM, Proc., 2005, pp. 95–104.
[13] A. Dufour, O. Tankyevych, and B. Naegel et al., “Filtering and segmentation of 3D angiographic data: Advances based on mathematical morphology,” Med Image Anal, vol. 17, pp. 147–164, 2013. [14] ´E. Grossiord, H. Talbot, and N. Passat et al., “Hierarchies and
shape-space for PET image segmentation,” in ISBI, Proc., 2015, pp. 1118– 1121.
[15] G. Palma, I. Bloch, and S. Muller, “Fast fuzzy connected filter implementation using max-tree updates,” Fuzzy Set Syst, vol. 161, pp. 118–146, 2010.
[16] E. Carlinet and T. G´eraud, “A comparative review of component tree computation algorithms,” IEEE T Image Process, vol. 23, pp. 3885– 3895, 2014.
[17] N. Passat, B. Naegel, and F. Rousseau et al., “Interactive segmentation based on component-trees,” Pattern Recogn, vol. 44, pp. 2539–2554, 2011.
[18] M. A. Westenberg, J. B. T. M. Roerdink, and M. H. F. Wilkinson, “Volumetric attribute filtering and interactive visualization using the max-tree representation,” IEEE T Image Process, vol. 16, pp. 2943– 2952, 2007.
[19] L. Fei-Fei, R. Fergus, and P. Perona, “One-shot learning of object categories,” IEEE T Pattern Anal, vol. 28, pp. 594–611, 2006. [20] S. E. Ertekin, J. Huang, L. Bottou, and C. L. Giles, “Learning on the
border: Active learning in imbalanced data classification,” in CIKM, Proc., 2007, pp. 127–136.
[21] I. Bloch, “Fuzzy spatial relationships for image processing and inter-pretation: A review,” Image Vision Comput, vol. 23, pp. 89–110, 2005. [22] C. Kurtz, B. Naegel, and N. Passat, “Connected filtering based on multivalued component-trees,” IEEE T Image Process, vol. 23, pp. 5152– 5164, 2014.