Publisher’s version / Version de l'éditeur:
Transportation Research Record, 1247, pp. 12-16, 1989
READ THESE TERMS AND CONDITIONS CAREFULLY BEFORE USING THIS WEBSITE. https://nrc-publications.canada.ca/eng/copyright
Vous avez des questions? Nous pouvons vous aider. Pour communiquer directement avec un auteur, consultez la première page de la revue dans laquelle son article a été publié afin de trouver ses coordonnées. Si vous n’arrivez pas à les repérer, communiquez avec nous à [email protected].
Questions? Contact the NRC Publications Archive team at
[email protected]. If you wish to email the authors directly, please see the first page of the publication for their contact information.
NRC Publications Archive
Archives des publications du CNRC
This publication could be one of several versions: author’s original, accepted manuscript or the publisher’s version. / La version de cette publication peut être l’une des suivantes : la version prépublication de l’auteur, la version acceptée du manuscrit ou la version de l’éditeur.
Access and use of this website and the material on it are subject to the Terms and Conditions set forth at
Visibility criteria and application techniques for roadway lighting
Rea, M. S.
https://publications-cnrc.canada.ca/fra/droits
L’accès à ce site Web et l’utilisation de son contenu sont assujettis aux conditions présentées dans le site LISEZ CES CONDITIONS ATTENTIVEMENT AVANT D’UTILISER CE SITE WEB.
NRC Publications Record / Notice d'Archives des publications de CNRC:
https://nrc-publications.canada.ca/eng/view/object/?id=bd485810-9390-46f6-9a3f-2247e0bed651 https://publications-cnrc.canada.ca/fra/voir/objet/?id=bd485810-9390-46f6-9a3f-2247e0bed651National Research
Cotmil national
'
21
I
+
Council Canada
de
recherches Canada
no.
1681
Institute for
lnstitut de
Research in
recherche en
Construction
construction
Visibility Criteria and Application
Techniques for Roadway Lighting
by M.S. Rea
Reprinted from
.
Iv.-
;?
Transportation Research Board 1247
,bra 4,Washington, D.C.
1989
p. 12-16
(IRC Paper No. 1681)
NRCC 32351
NlPC-
ClSTlL I B R A R Y
I
B ~ B L I O T H ~ Q U E
1
I R C
CNRC-
ICISTi
-
Deux questions connexes doivent &re prises en considkration lors de
114valuation de la visibilit4 sur les routes. 11 faut 4tablir des crithres
convenables definissant la visibilitd sur les routes, et mettre au point des
techniques permettant de mesurer la conformit4
2tces
crithres.
Ces
deux
questions sont trait& ici. L'auteur formule des recommandations mncemant
1'4tablissement de crit&res de visibilite'sur les routes d'aprhs
un
mod&le de
vitesse et de precision visuelles, et touchant l'utilisation de systhmes
photom&riques d'analyse d'images pour Mvaluation d'applications dans le
domaine rou tier.
Visibility Criteria
and
Application Techniques for
Roadway
Lighting
Reprinted
from
TRANSPORTATION RESEARCH RECORD
I247
(1989)Transportation Research Board
National Research Council
Washington. D.C.
TRANSPORTATION RESEARCH RECORD 1247
Visibility Criteria and Application
~echniques
for ~ o a d w a y
~ i g h t i n g
Two related issues must be considered in assessing roadway visi- bility. Suitable criteria defining roadway visibility must be estab- lished, and practical measurement techniques must be developed to measure compliance against the criteria. This paper addresses both issues. It makes recommendations for setting roadway visi- bility criteria based upon a model of visual speed and accuracy, and for utilizing photometric image analysis systems to evaluate roadway applications.
Good visibility is essential for safe driving. At highway speeds exceeding 100 kph (28 m/s) a driver must make decisions quickly and correctly about the condition of the roadway and objects in the path of the vehicle. Therefore, it is necessary to design roadways, and their illumination, so that a driver can see potential hazards and have enough time to avoid them. Proper roadway design must address two fundamental issues. First, criteria must be established for evaluating roadways in terms of visibility, and second, equipment must be available for making these assessments. This paper discusses these issues and makes recommendations for
(1) Design evaluation criteria based upon a model of visual speed and accuracy, and
(2) Utilization of computer-based imaging photometry for assessing the performance of actual roadways according to the model.
SPECIFICATION OF THE STIMULUS
Visibility, however defined, is affected by a relatively small set of stimulus parameters. The spatial and luminous char- acteristics of static objects are the primary aspects of the visual scene that must be specified if one is to predict a driver's visual response. Color and motion are also important to vis- ibility, but these will typically play a minor role in driving safely. Of course, the spatial-luminance characteristics can be quite complex and produce a wide range of levels for visual response ( 1 , 2 ) . Nevertheless, measurements of object lumi- nances and sizes are the first major steps towards predicting roadway visibility.
Direct and Subjective Techniques
Techniques for specifying luminance and size fall into two distinct classes. The first technique employs instruments for
National Research Council Canada, Institute for Research in Construction, Ottawa, Ontario, Canada KIA OR6.
assessing object size (e.g., a tape measure) and luminance * (e.g., a luminance spot photometer). Importantly, the values recorded should come from reliable, calibrated instruments whose readings can be verified independently.
The second technique utilizes a human being as the instru- ment. Typically these "human instruments" provide magni- tude estimations of object parameters. For example, a person might evaluate the contrast or size of an object on a roadway. This technique is quite effective if the human instrument has been calibrated. Most industries avoid "human instruments" if at all possible. Although they can be used reliably, the calibration exercise requires a great deal of effort and not all individuals are well suited to such tasks. In the brewing indus- try, though, calibrated tasters ensure quality control because the human instrument can more reliably diagnose differences in certain key flavors than can mechanical, optical, or chem- ical techniques. It is important to stress that these tasters have been carefully selected and educated, and their responses have been validated in so-called "blind" comparisons to avoid costly repercussions.
Although subjective techniques have been employed in the lighting industry (3,4), the roadway community is fortunate in being able to specify the relevant visual stimulus aspects directly. In practice, tape measures and luminance spot pho- tometers have been used to measure the size and luminance of objects placed on the roadway. Unfortunately, such pro- cedures are extremely tedious, expensive, and prone to recording errors. As an example, in August 1987 the Roadway Lighting Committee of the IESNA completed field measure- ments at an outdoor roadway facility. The exercise took many months to complete, and upon reflection the committee resolved that erroneous data had been included.
Computer-based Imaging Photometry
A luminance-measuring and image analysis system known as CapCalc (for capture and calculate) that quickly and accu- rately records spatial and luminance information from a visual scene has been recently developed at the National Research Council Canada (NRCC). The system replaces the tape mea- sure and luminance spot photometer. CapCalc consists of a V-lambda corrected solid-state video camera, an image pro- cessing board, and a personal computer (see Figure 1). It captures, stores, retrieves, and analyzes video pictures com- prising a quarter million luminance values (pixels). Image capture is complete in approximately 30 ms. Figure 2 shows a digitized image generated by CapCalc. The system over- comes many of the problems currently facing application spe-
Rea
throughout the entire visual scene in a matter of seconds. Additionally, data can be stored for subsequent retrieval and assessment, making CapCalc a practical system for specifying visual stimuli on roadways.
VISIBILITY CRITERIA
Distinct from the concept of visual stimuli, but of equal impor- tance, is the ability to evaluate those stimuli in terms of vis- ibility. In other words, it is necessary to have a model of visibility that will predict a driver's response to the visual characteristics of a roadway.
Seeing is a complex process, and there is no single definition of visibility that is appropriate for every task. Rather, a suit- able definition will depend upon the situation. If, for example, the presence or absence of a target has to be detected, without regard for the time required to perform the task, a detection threshold model of visibility will suffice. If, on the other hand, a suprathreshold target must be identified (a muffler or paper bag lying on the roadway) within a limited length of time, a detection threshold model is inherently inappropriate. FIGURE 1 Components of the National Research Council
Canada luminance and image analysis system known as CapCalc.
Detection Threshold Models
FIGURE 2 Digitized image of a roadway scene generated by CapCalc.
cialists concerned with specifying roadway size and luminance information.
Several months have been spent in developing and cali- brating the system (5). Its photopic spectral response is equal to or better than that of conventional spot luminance pho- tometers and can provide luminance data under all conven- tional light sources. It responds linearly to light from mesopic levels (about 1 cd/m2) to high photopic (daylight) levels; the dynamic range can be adjusted by manipulating the lens aper- ture and neutral density filters. The system's response remains constant over the entire field-of-view so that a given luminous point anywhere in the visual scene will produce the same luminance value from any of its pixels. Further, the calibrated zoom lens yields accurate information about the apparent size of objects. Thus, CapCalc is a true imaging photometer that can provide accurate object luminance and size information
Visibility has often been defined in terms of detection thresh- old (6,7). Such a definition is appropriate if the concern is only with the break-point between seeing and not seeing. For most roadway applications, however, objects are above the detection threshold, so that this definition is of limited utility for establishing visibility recommendations, standards, or guidelines for roadways. This limitation has been recognized by those trying to establish visibility performance criteria (8). To evaluate the visibility of suprathreshold objects, it has been assumed that all objects with contrasts at three times their respective detection threshold values will be equ-lly visible. In principle then, a visibility performance criterion of three times detection threshold might be recommended, but the assumption underlying such a recommendation would not be valid.
Detection threshold is only one of many constant criteria that can be adopted by a human observer over the full range of visual response. In fact, an observer could adopt both detection and readability criteria for the same object (9,lO). For example, the amount of contrast (size or overall lumi- nance) required to read a sign is greater than that required to detect the sign. Readability is a higher threshold criterion than detection because a higher level of visual response is required.
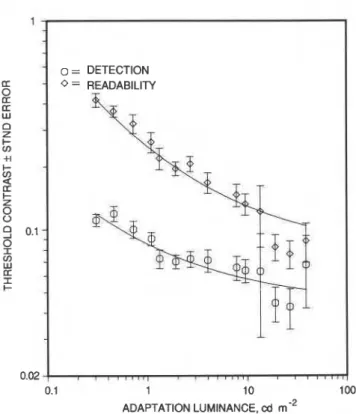
Contrast threshold data can be obtained for a wide range
-
of adaptation (overall luminance) levels. Importantly, the threshold functions for detection and for readability relating contrast and adaptation luminance differ not only in height but in shape as well (see Figure 3). Because the two threshold functions are not separated by a single multiple over their entire range, it is incorrect to assume that two objects at three times their respective detection threshold will be equally visible (9).14 1 - 0 = DETECTION 0 = READABILITY - 0.02 0.1 1 10 100 ADAPTATION LUMINANCE, cd rnS2
FIGURE 3 Detection and readability threshold data for steady viewing of five-digit numbers (16).
Constant Criteria from a Suprathreshold Model
Relative Visual Performance
It is possible to establish constant criteria and determine lines of "equal visibility" if a complete set of suprathreshold func- tions is available. Figure 4 is from the suprathreshold visual performance model developed by Rea (11) and shows Rel- ative Visual Performance (RVP) changing as a function of contrast for three adaptation levels. Zero on the ordinate corresponds to the "readability" threshold criterion. Other higher constant criteria can be adopted by selecting a given ordinate value. For example, three contrast values, A , B and C, have been derived for 169, 50 and 12 cd/m2, respectively, from the constant criterion of RVP = 0.8.
Figure 5 shows several constant criterion (or threshold)
lines from the RVP model in a log contrast versus log lumi- nance coordinate system along with the three derived contrast values at 169, 50 and 12 cd/m2 from Figure 4. It is important
to recognize that in Figure 5 these constant criterion functions are not parallel in the log contrast versus log luminance coor- dinate system (i.e., they are not separated by fixed multiples). Again, equal visibility lines cannot be obtained by simple fixed multiples of detection threshold. It is possible to set equal visibility levels, however, but only after a complete set of suprathreshold functions has been obtained. I11 any event, a visibility performance criterion can be established by adopting a constant criterion in a suprathreshold visibility space (see Figure 6).
Appearance
A visual performance model based upon speed and accuracy, similar to that illustrated in Figure 6, is not the only possible
TRANSPORTATION RESEARCH RECORD 1247
1
FIGURE 4 Constant luminance lines from the Relative Visual Performance (RVP) model developed by Rea (11). The curves are labelled in units of background luminance, cd/m2. Points labelled A, B, and C are derived from a constant criterion of 0.80 from the RVP model for 169, 50, and 12 cd/m2, respectively.
FIGURE 5 Constant performance lines through the Relative Visual Performance (RVP) model developed by Rea (11). The curves, labelled in units of RVP, are comparable to threshold functions. Points labelled A, B, and C correspond to those derived in Figure 4.
Rea
FIGURE 6 A three-dimensional representation of the Relative Visual Performance (RVP) model developed by Rea (11).
suprathreshold visibility model. A suprathreshold model of "apparent visibility" could also be determined by magnitude estimations of the type described in the previous section using "human instruments." Several investigators have shown that magnitude estimations are related to stimulus contrast by a power function with an exponent near unity (12). In other words, the contrast response function is nearly linear when using magnitude estimations. An "apparent visibility" model, which has yet to be developed, could, in principle, be used to establish a visibility performance criterion. It would be less appropriate for roadway applications, however, because it would not model the speed and accuracy of visual response that are critical for safe driving. Rea and Ouellette (13) have recently extended Rea's (11) model using reaction times. They show that reaction times to low-contrast (e.g., 0.2) small (e.g.,
2 x steradians) targets will require more time to process
at 1 cd/m2 than at 10 cd/m2. At 100 kph, or 28 mls, their model
predicts an incremental distance for avoidance of 11 m for a
typical 20 year old and 22 m for a typical 65 year old (assuming there have only been changes in retinal illuminance with age). These calculations assume that at 1 cd/m2 the 20 year old has
a retinal illuminance of about 18 trolands and at 10 cd/m2
retinal illuminance will be about 130 trolands. The 65 year old, on the other hand, will have retinal illuminances of about 10 and 76 trolands, respectively. Nevertheless, it is interesting to compare responses based upon "apparent visibility" (from magnitude estimations) and RVP (based on speed and accu- racy) to the same stimuli.
RVP Versus Appearance
Subjects in two independent experiments were presented with lists of printed numbers having different contrast created by variations in the ink pigment density and the lighting geom- etry. In one experiment (11) subjects were obliged to read the numbers as quickly and accurately as possible. In the other experiment subjects were asked to rate, from 0 (threshold) to 10 (very black on white), the apparent contrast of the num- bers; background luminance was held constant at 20 cd/m2 in
this experiment. Figure 7 compares the functions derived from
the two experiments at 20 cd/m2 and shows that for the same stimulus the suprathreshold visual responses are markedly different and depend upon the task required of the subjects. Under these stimulus conditions the RVP function, based upon speed and accuracy, follows a well documented, step- like function (11,13). On the other hand, the "apparent vis- ibility" of the same numbers is an almost linear function of contrast. These different responses may have neurologically different bases in the visual system (14J.5).
To establish a correct visibility performance criterion then, one must consider the driver's task. This will determine the appropriate visual model. Since speed and accuracy are crit- ical to driver performance and appearance is not, the RVP model is more appropriate for roadway visibility criteria.
CONCLUSION
Two problems must be resolved before suitable recommen- dations and standards for roadway visibility can be estab- lished. First, an appropriate visibility performance criterion must be set, and second, practical techniques must be found for evaluating compliance with that criterion. Performance criteria based upon detection threshold are not appropriate because suprathreshold visibility must be considered. Although an "appearance" criterion would be based upon suprathres- hold visual response, it does not consider the speed and accu- racy of visual processing. Thus, a model of suprathreshold visual performance like RVP that is based upon speed and accuracy should be used in setting criteria for roadway performance.
In principle, then, it is possible to establish appropriate performance criteria for roadways using the RVP model. For example, on rural highways having little traffic, an RVP model of 0.50 might be recommended. Congested urban freeways
/ 8 . Visual c / Performance ,I 8 / / / / / / / / / Contrast
,
Rating / C I / C fl / / I C 1 . 1 . 1 . 1 . 1 . 0.0 0.0 0.2 0.4 0.6 0.8 1.0 CONTRASTFIGURE 7 Two types of suprathreshold response to the same stimulus: printed five-digit numbers of different contrast. The solid line is based upon responses of speed and accuracy from the RVP model developed by Rea (11); the dashed line is from unpublished data using magnitude estimations of apparent contrast. Adaptation luminance was 20 cd/m2 for both sets of data.
16 TRANSPORTATION RESEARCH RECORD 1247
might require a higher recommended performance criterion REFERENCES
of 0.80. Such standards would naturallv translate into better roadway markings and illumination on urban freeways than on rural roadways. In essence, a priori performance criteria from the RVP model can be established by sanctioning bodies in accordance with "good practice." The roadway engineer would be left to achieve those performance levels with the most cost effective or innovative solutions.
To determine compliance with the recommended perfor- mance criterion, it is necessary to take measurements of the important stimulus aspects on the roadway. Subjective tech- niques using human beings as "instruments" are of dubious value for roadway applications. More conventional techniques employing tape measures and luminance spot photometers could be used, but they are impractical and prone to error.
A computer-based imaging photometer like the NRCC CapCalc system can, however, acquire and store all of the relevant stimulus parameters (size, contrast and adaptation luminance) in a matter of seconds.
Such a device can also analyze the impact of these param- eters on driver performance according to the recommended performance criteria. Software, implementing a recom- mended model of visual performance (based upon speed and accuracy), can be written to analyze the stimulus conditions on the highway. It can also incorporate transformations of the visual stimulus according to age-dependent changes in the optical characteristics of the eye. This one device can, there- fore, acquire the relevant aspects of the stimulus and analyze their impact on visual performance in a matter of seconds.
SUMMARY
Current studies of the responses of the human visual system have produced a computational model of visual performance that is based upon speed and accuracy. Such a model is most appropriate for roadway visibility because speed and accuracy are important for safe driving. Specifications of minimum acceptable performance levels for different roadway appli- cations can effectively guide roadway engineers in their designs. Recent developments in imaging photometry enable engi- neers and enforcing bodies to determine whether specific roadway designs comply with requirements. Such systems make sophisticated evaluation of roadway visibility practical for the first time.
1. R. J . Lythgoe. The Measurement of Visual Acuity, HSMO. Med-
ical Research Council, Report No. 173, 1932.
2. J. J. McCann and J. A. Hall. Effect of Average-Luminance Sur- rounds on the Visibility of Sine Wave Gratings. Journal of the
Optical Society of America, Vol. 70, No. 2, 1980, pp. 212-219. 3. H. R. Blackwell, R. N. Schwab and B. S. Pritchard. Visibility
and Illumination Variables in Roadway Visual Tasks, Illuminat-
ing Engineering, Vol. 59, 1964, pp. 277-308.
4. M. S. Rea and M. J. Ouellette. An Assessment of'the Blackwell
Visual Task Evaluator, Model 3X. National Research Council,
.
Division of Building Research, 1984.
5. M. S. Rea and I. G. Jeffrey. CapCalc: A New Luminance and
Image Analysis System for Lighting and Vision. National Research Council, Institute for Research in Construction, Report No. 565, 1988.
6. J. E . Kaufman and J. F. Christensen (eds.). IES Lighting Hand-
book (5th ed.). Illuminating Engineering Society, New York, 1972.
7. An Analytic Model for Describing the Influence of Lighting
Parameters Upon Visual Performance. Volume I: Technical Foundations. Publication No. CIE 1912.1, Commission Interna- tionale de 1'Eclairage (CIE), 1981.
8. M. E. Keck and R. E . Stark. Evaluation of Visibility Models in the Roadway Situation. Proc., 2Ist Session Commission Inter-
nationale de I'Eclairage, Vol. 1 , Venice, 1987, pp. 282-289. 9. M. S. Rea. The Validity of the Relative Contrast Sensitivity
Function for Modelling Threshold and Suprathreshold ~ e s ~ o n s e s . Presented at Svm~osium ,
.
on Inteeration of Visual Performance Criteria to Illumination Design, Gblic Works Canad?, Ottawa, Canada, Jan. 1982.10. M. S. Rea, F. R. S. Clark, and M. J. Ouellette. Photometric and
Psychophysical Measurements of Exit Signs Through Smoke.
National Research Council Canada, Division of Building Research, 1985.
11. M. S. Rea. Toward a Model of Visual Performance: Foundations and Data. Journal of the Illuminating Engineering Society, Vol. 15, No. 2, 1986, pp. 41-57.
12. M. W. Cannon. Contrast Sensitivity: A Linear Function of Stim- ulus Contrast. Vision Research, Vol. 19, 1979, pp. 1045-1052. 13. M. S. Rea and M. J. Ouellette. Visual Performance Using Reac-
tion-Times. Proc., CZBSE National Lighting Conference, Cam- bridge, 1988, pp. 165-187.
14. E. Kaplan and R. M. Shapley. The Primate Retina Contains Two Types of Ganglion Cells, With High and Low Contrast Sensitiv- ity. Proc., National Academy of Sciences ( U S A ) , No. 83, 1986, pp. 2755-2757.
15. M. S. Livingstone and D. H. Hubel. Psychophysical Evidence for Separate Channels for the Perception of Form, Color, Move- ment, and Depth. The Journal of Neurosciences, Vol. 7, No. 11, 1987, pp. 3416-3468.
16. M. S. Rea. Calibration of Subjective Scaling Responses. Lighting