READ THESE TERMS AND CONDITIONS CAREFULLY BEFORE USING THIS WEBSITE. https://nrc-publications.canada.ca/eng/copyright
Vous avez des questions? Nous pouvons vous aider. Pour communiquer directement avec un auteur, consultez la
première page de la revue dans laquelle son article a été publié afin de trouver ses coordonnées. Si vous n’arrivez pas à les repérer, communiquez avec nous à PublicationsArchive-ArchivesPublications@nrc-cnrc.gc.ca.
Questions? Contact the NRC Publications Archive team at
PublicationsArchive-ArchivesPublications@nrc-cnrc.gc.ca. If you wish to email the authors directly, please see the first page of the publication for their contact information.
NRC Publications Archive
Archives des publications du CNRC
This publication could be one of several versions: author’s original, accepted manuscript or the publisher’s version. / La version de cette publication peut être l’une des suivantes : la version prépublication de l’auteur, la version acceptée du manuscrit ou la version de l’éditeur.
Access and use of this website and the material on it are subject to the Terms and Conditions set forth at
Benchmarking of the advanced hygrothermal model-hygIRC with
mid-scale experiments
Maref, W.; Lacasse, M. A.; Kumaran, M. K.; Swinton, M. C.
https://publications-cnrc.canada.ca/fra/droits
L’accès à ce site Web et l’utilisation de son contenu sont assujettis aux conditions présentées dans le site LISEZ CES CONDITIONS ATTENTIVEMENT AVANT D’UTILISER CE SITE WEB.
NRC Publications Record / Notice d'Archives des publications de CNRC:
https://nrc-publications.canada.ca/eng/view/object/?id=0be6f498-39a5-42d6-8ea5-e40b4cc08bb0 https://publications-cnrc.canada.ca/fra/voir/objet/?id=0be6f498-39a5-42d6-8ea5-e40b4cc08bb0
Benchmarking of the advanced hygrothermal
model-hygIRC with mid scale experiments
Maref, W.; Lacasse, M.; Kumaran, M.K.; Swinton,
M.C.
A version of this document is published in / Une version de ce document se trouve dans : eSim 2002 Proceedings, Montréal, Sept. 11-13, 2002, pp. 171-176
www.nrc.ca/irc/ircpubs
BENCHMARKING OF THE ADVANCED HYGROTHERMAL MODEL–hygIRC
WITH MID SCALE EXPERIMENTS
Wahid Maref, Michael Lacasse, M. Kumar Kumaran, Michael C. Swinton
National Research Council of Canada, Institute for Research in Construction
Ottawa, Ontario
Wahid.maref@nrc.ca Michael.lacasse@nrc.ca kumar.kumaran@nrc.ca michael.swinton@nrc.ca
ABSTRACT
Recent research in the field of assessment of hygrothermal response has focused on either laboratory experimentation or modelling, but less work has been reported in which both aspects are combined. Indeed, it is generally acknowledged that assessing the hygrothermal performance of building envelope systems is both expensive and time consuming. Such type of studies can potentially offer useful information regarding the benchmarking of models and related methods to assess hygrothermal performance of wall assemblies. This paper focuses on the use of an advanced hygrothermal model to assess the hygrothermal response of various components in wood-frame wall assemblies when subjected to nominally steady-state environmental conditions. A comparison is made of results obtained from the computer model simulations to those derived from tests on mid scale specimens in controlled laboratory measurements. The experimental results were subsequently used to help benchmark the model. Specifically, hygIRC was implemented, in this series of simulations, to assess the drying rate of various combinations of sheathing membrane in close contact with wood-based sheathing. The overall agreement between experimental and simulated results is very good in terms of the shape of the drying curve and the time taken to reach equilibrium moisture content.
INTRODUCTION
Assessing the performance of new building materials, components or systems typically requires extensive laboratory testing or, in some instances, elaborate and time-consuming field trials. Thorough analyses of the hygrothermal behaviour of, for example, wall systems in response to different climatic loads is not usually part of the assessment process. Whereas laboratory and field experiments are often too selective and time consuming, a practical means of assessing the response of wall systems to changing environmental loads is accessible through the use of hygrothermal simulation models. Simulation models can accommodate a variety of changing boundary conditions and as well, result in much faster analysis, given the recent advances in computer technology that have permitted ready access to enhanced computing performance. This in turn has
brought about an increased emphasis on the use of numerical methods to solve the fundamental hygrothermal equations that form the basis for many of the mathematical models developed over the past decade.
Depending upon the complexity of the
problem under consideration, such models can be based on very simple, one-dimensional, steady state methods or on more complex, two and three-dimensional, transient methods. However, acceptance of results derived from simulation models is contingent upon acquiring evidence of a response comparable to that obtained from experimental work when the simulation is carried out under the same nominal environmental loads. Studies that incorporate both laboratory experimentation and simulation thus offer possibilities to compare results and hence ‘benchmark’ the response of the model to known conditions.
Researchers at the Institute for Research in Construction (IRC), jointly with those from the Technical Research Centre of Finland (VTT Finland), have been developing advanced hygrothermal models for the past fifteen years. Some of the joint activities were reported earlier [Ojanen et. al., 1994, Ojanen and Kumaran, 1995 & 1996, Karagiozis et. al. 1995, Salonvaara and Karagiozis 1998].
The current version of the hygrothermal model that is used at IRC is called hygIRC [Kumaran, 2002]. hygIRC is built around well-known heat, air and moisture transport equations (Fourier’s law of heat conduction, Fick’s law of diffusion of matter and Darcy’s law of fluid flow as well as Navier-Stokes equations) and corresponding equations that define the conservation of energy, mass and momentum. A two-dimensional cross-section of the envelope components is represented by a matrix of several hundreds of closely packed rectangular elements, the sum of which constitutes the computational domain of the ensemble. The model simulates the response of each element to the changing environmental conditions on either side of the envelope on an hourly basis. This produces information on the temperature and relative humidity distributions within the wall assembly and the changes in these with time. The data can be sampled at any desired time interval and visualised using post-processing graphic software. Reviewing the output in this manner readily permits identifying locations within the assembly that may be subjected to high moisture
conditions over prolonged periods of time. As well, it permits a rapid assessment of the extent to which the simulation may emulate experimental results.
The governing equations listed below will show that the approach adopted in hygIRC in deriving the balance equations from the phenomenological equations is evolved from the approaches used earlier by Kohonen in TRATMO I [Kohonen 1984] or by Ojanen in TCCC2D [Ojanen and Kumaran 1992, 1996]. The report of the International Energy Agency annex 24 [Hens, 1996] is also a useful source of information in which the equations used in hygIRC are explained. Several applications of the hygrothermal model during its development have been reported earlier [Salonvaara and Karagiozis, 1994, Karagiozis & al., 1995, Karagiozis and Kumaran, 1997]. hygIRC is extensively used at IRC as the primary analytical tool to conduct parametric studies to assess the hygrothermal performance of various wall assemblies exposed to different climatic conditions in North America.
This paper presents the governing equations implemented in hygIRC and a series of drying experiments on oriented strand board (OSB) alone or in combination with different sheathing membranes designed to benchmark the model. It also presents preliminary results from a series of simulations in which the shape of the drying curve and the time taken to establish the equilibrium moisture content are determined and compared with the experimental results.
ADVANCED HYGROTHERMAL MODEL
The governing equations implemented in hygIRC are given below. The moisture transport potentials used in the model are moisture content (MC) and vapour pressure (VP); for energy transfer, temperature is the driving force. Moisture balance
( )
= −∇{
• + •}
∂ ∂ v m l m t u o ρ (1)( )
3
2
1
4
43
4
42
1
airflow Vapor diffusion Vapora
V
v
ρ
v
P
T
u
p
δ
m
v-,
∇
+
−
=
•( )
43
42
1
4
4 3
4
4 2
1
flow gravity Liquid diffusion Liquidw
(u)ρ
w
k
u
T
u
w
D
o
ρ
m
l•=
−
,
∇
+
g
With(
)
u S T u D ρ w k w o ∂ ∂ = , Energy balance( )
( )
(
)
4 4 3 4 4 2 1 4 4 4 4 3 4 4 4 4 2 1 4 43 4 42 1 4 4 4 4 3 4 4 4 4 2 1 r heat / heat on condensati n / Evaporatio . . thaw Freeze conduction Heat heat convected Airflow t f u o ρ ice L v P T) (u, p o ρ v L T T) (u, T a V (T) a p C T a t T T) (u, p C T u, T ρ l ∂ ∂ − ∇ ∇ + ∇ ∇ + ∇ − = ∂ ∂ δ λ ρu
Moisture content kg (moisture)/kg (dry material) - (%)•
l
m
Liquid moisture mass flow rate (kg/s)/m2
•
v
m
Vapor moisture mass flow rate (kg/s)/m2
w
k
Liquid moisture permeability (kg/m s Pa)S
Capillary suction pressure (Pa)v
P
Vapor moisture pressure (Pa)T Temperature (K)
t
Time (s)a
V
r
Air velocity vector (m/s)o
ρ
Density of the dry porous material (kg/m3)v
ρ
Vapor moisture partial density (kg/m3)w
ρ
Liquid moisture partial density (kg/m3)w
D
Liquid moisture diffusivity (m2/s)p
δ
Vapor water permeability (kg/ m s Pa)g
r
Gravitational vector (m/s2)p
C
Effective specific heat capacity (J/kg K)a
p
C
Dry-air specific heat capacity (J/kg K)l
f
Liquid fraction having a value from 0 to 1λ
Effective thermal conductivity (W/m K)v
L
Enthalpy of evaporation/condensation (J/kg)ice
L
Enthalpy of freeze/thaw (J/kg)T
ρ
Actual total density of the material including moisture contribution (kg/m3)EXPERIMENTAL DESIGN Scope of work
The primary focus in this benchmarking exercise was to evaluate the drying process of wood-based sheathing board in timber-frame constructions. Hence, the scope of the benchmarking exercise was limited to experimentally determining the drying processes of OSB sheathing board alone or wrapped in different sheathing membranes and comparing these to the
drying response derived from simulation. Liquid and vapor transfers are included in the investigation. Hence the primary hygrothermal properties of interest are the vapor permeance and liquid diffusivity. Air movement is not explicitly considered in this benchmarking exercise with the exception of permeation of air through materials. The overall drying process was considered in terms of the shape of the drying curve and the time taken to establish equilibrium moisture content by the sheathing board. Preliminary results on the first set of experiment were presented in a previous publication [Maref &al, 2002]
Drying experiment to help benchmark hygIRC
Experiments were carried out in controlled laboratory conditions on sheathing boards having nominal dimensions of 0.8-m x 1.0-m. This size had been deemed a reasonable compromise between small and full-scale experiments. This series of tests were conducted such that technical advantages gained from completing this series could subsequently be applied to full-scale experiments that were being planned as part of broader and more comprehensive benchmarking exercise (to be published). The present series consisted of collecting data on the drying characteristics of initially saturated OSB sheathing board and OSB board in contact with sheathing membrane.
Equipment
Climatic Chamber (EEEF)
A climatic chamber, referred to as the Envelope Environmental Exposure Facility (EEEF), was used to subject the specimens to simulated climatic conditions over extended periods of time. The climatic conditions within the chamber can be varied over a range of -47 to + 48 ± 0.5°C with the capability of either, maintaining a steady state set point, or executing a temperature ramping regime. Humidity control is achieved through a pneumatically actuated fogger coupled to a set point controller and can maintain humidities ranging from 10 to 100 % RH within 3 % RH in steady state conditions.
Weighing system and Load cells
Three weighing systems were fabricated, each one capable of accommodating three specimens as shown in Figure 1. Specimens were attached to individual load cells (nominal capacity of 50 ± 0.02 kg) such that weight changes could be monitored over the course of the experiment [Maref & al., 2002]. Weight changes of a total of nine different specimens could simultaneously be monitored from load cell measurements recorded on a data acquisition system. These weighing systems were placed in the EEEF and the specimens attached to them were thus subjected to climatic regime to which the chamber was regulated.
Material Properties
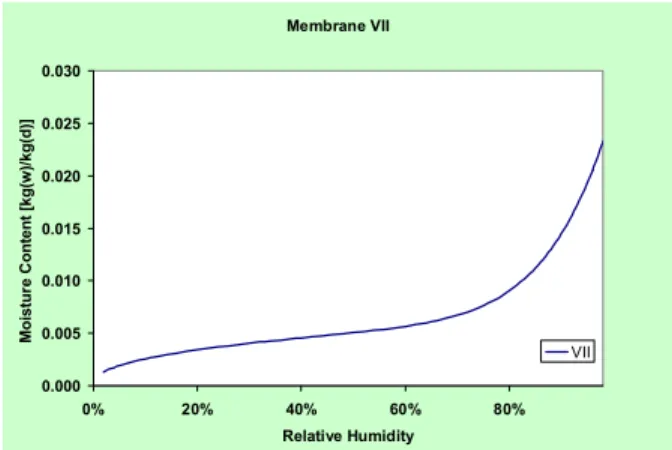
Relevant physical properties of the materials used in the experimental sets are provided in Table 1, and Figures 2 to 5. Values for the absorption isotherm for OSB board are given in Figure 2, whereas Figure 3 provides the absorption isotherm for sheathing membrane VII. Figure 4 provides values for the liquid diffusivity of OSB in the x-direction (i.e. across the thickness of the board). Values of liquid diffusivity for membrane VII remains constant and is equal to 1.0 x 10⁻¹⁶ m2•s-1. Values of vapour permeability in the x-direction are given in Figure 5 for OSB; the corresponding values for membranes VII remains constant and is equal to 6.08 x 10⁻¹³ kg/m•Pa•s.
MODEL IMPLEMENTATION AND SIMULATION ASSUMPTIONS
A model of the sheathing board flanked on either side with a “layer’ of sheathing membrane (i.e. 3 layers: membrane, OSB, membrane) was implemented using a rectangular mesh. This mesh was comprised of 20 nodal points along the height of the specimen (y-direction) and 16 nodal points across the depth (x-direction) for a total number of 320 nodal points for the entire representation. Membranes, installed on either side of the OSB were each comprised of 3 equidistant nodes across their depth. The OSB, having a thickness of 11.5-mm, had 10 equidistant nodes. In the case where the response of the OSB alone is simulated the grid representation in this instance had an expanding mesh implying that grid density near the edges of the nodes across its depth was greater than that at the center.
The surface heat transfer coefficient was 10 W/m2•°C whereas the moisture transfer coefficient along the principal planar surfaces of the specimen was 4.6 x 10⁻⁷kg/ m2•s•Pa and at the top and bottom of the specimen was 7.4 x 10⁻¹⁵ kg/ m2•s•Pa. Though the experimental data provided boundary conditions at every 2 minutes, in the present investigation the time step used in the simulation was 60 minutes.
The simulations were conducted under the following assumptions:
• Liquid transport through the building paper was not modelled; it was modelled as a vapour diffusion control element.
• The contact between the membranes and the OSB sheathing was assumed to be perfect i.e. no interstitial airspace between components). The initial moisture content (MC) of the membrane was set to 0%.
INITIAL AND BOUNDARY CONDITIONS
The OSB specimens were immersed in water bath for up to 5 days in order to saturate them. Specimens were then stacked one upon the other with aluminium angles
of 1-m length used to separate individual boards from one another. This insured the water was in contact with all surfaces of OSB specimens and that the process of saturating the samples was hastened.
After this period of time the water in the bath was drained and specimens then remain in the bath for another two days to allow moisture to re-distribute itself evenly within the OSB. Care was taken to prevent the boards from drying out by sealing the bath lid with adhesive tape. Following this two-day period, each board was removed and the moisture content was determined with a Delmhorst moisture meter. Hence, the initial MC at the start of the experiment was assumed to be uniform throughout the thickness of the material for each test specimen.
Boundary conditions for the experiment are provided in Figure 6 and shows the recorded temperature (T) and relative humidity (RH) in the climatic chamber as a function of time conducted over a period of 30 days.
RESULTS AND DISCUSSIONS
For this study, hygIRC was used to estimate the drying response of three specimens of OSB, of which results, given below, are for two of the OSB boards alone (Figures 7 and 8) and the third for an OSB board covered with a sheathing membrane (Figure 9).
As was mentioned previously, OSB boards were immersed in water for 5 days and then allowed to stabilise in a sealed tank. Thus for the simulation, it was assumed that at the start of the experiment all specimens had a uniform MC through the thickness of the material as determined from MC measurements. Figures 7 and 8 show the change in MC as a function of time in the OSB board (per 0.8 meter of specimen width) as simulated and measured for two specimens respectively.
Figures 7 and 8 also shows that for the OSB faces directly exposed to the surrounding air (i.e. “free surface”), the simulated drying rate is in good agreement with the results obtained in the experiments. In a simulation, the most critical node in the calculation is the initial one. Particularly if the surface is saturated and in contact with air. In this instance, the mass transfer at the boundary layer is very sensitive because the very thin layer of air at the surface represents a certain resistance where a high rate of moisture transfer occurs. The closer the calculation node is to the surface being simulated, the more accurate the result. Results of experiment and simulation for the first OSB board in given in Figure 7. The first 5 days of drying show the highest difference between the results obtained from experiment and the simulation; i.e. 3% less MC. It can also be observed from this figure that an Equilibrium Moisture Content (EMC) of 5% is reached after 30 days.
Figure 8 shows a comparison between simulated and measured total MC of the second OSB board. The total MC in the system initially is ca. 58 % and after 30 days it reaches a value of 5%. These results indicate a very good agreement between results of simulation and those derived from experiment.
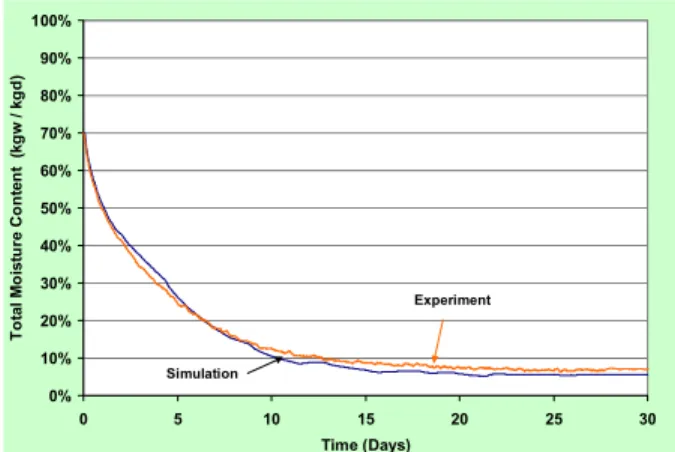
Comparative results between simulation and experimental drying of an OSB layer wrapped on both sides with sheathing membrane (VII) and exposed to the surrounding environmental conditions within the climatic chamber (provided in Figure 6) is plotted in Figure 9. In this experiment, the weights of the specimens were monitored continuously using load cells whose signals were captured through a data-logging system (Figure 1 shows weighing system). The initial MC of the OSB is 87%. As can be observed in Figure 9, the EMC is achieved after 30 days (6%); the simulation is in good agreement with the experimental data. In general, the drying process is governed by the vapour permeability of the membrane. The higher the vapour permeability the faster the rate of drying in a given condition.
CONCLUDING REMARKS
Experimental work has been done to help benchmark an advanced hygrothermal model called hygIRC. This paper reported on experiments undertaken under symmetric drying conditions - i.e. both major surfaces of the test assembly were exposed to the same environmental conditions. Additional experiments on one-sided drying conditions will be reported in the future. This will further enhance confidence towards the implementation of hygIRC to undertake broader parametric studies.
The overall agreement between experimental and simulated results is very good in terms of the shape of the drying curve and the time taken to reach equilibrium moisture content. A mean set of material properties alone is used in this preliminary investigation. Other material property data on hand at the Institute suggests that the properties can vary within a range. This will be investigated further and reported at a later date.
ACKNOWLEDGEMENTS
The contributions from Mr. Daniel Booth, and Mr. Daniel Perrier setting-up and undertaking the experiments are gratefully acknowledged.
REFERENCES
Karagiozis, A.N., M.H. Salonvaara and M.K.
Kumaran 1995. The Effect of Waterproof Coating on Hygrothermal Performance of high-rise Wall Structure. Thermal Performance of the Exterior Envelopes of Buildings VI, Clearwater, FL- USA, 1995.
Karagiozis, A. N. and M.K. Kumaran 1997.
Applications of Hygrothermal Models to Building Envelope Design Guidelines. 4th Canada/Japan Housing R&D workshop. Pp. III-25-III-36, 1998. Sapporo, Japan, Nov. 16-21, 1997.
Kohonen, R. 1984. A Method to Analyse the Transient
Hygrothermal Behaviour of Building Materials and Components. Technical Research Centre of Finland Publication 21, pp. 33-35
Kumaran, M. K., "Protecting the long-term
performance of building envelope components", Construction Canada, V. 39 (March) 2002, pp. 24-30.
Maref, W., Kumaran, M.K., Lacasse, M., Swinton, M.
and Van Reenen, D. Laboratory Measurement and Benchmarking of an Advanced Hygrothermal Model. In press, Proceeding of the 12th International Heat Transfer Conference. Grenoble, France (August 2002).
Maref, W., Lacasse, M., Booth, D., Nicholls, M. and
O'Connor, T. 2002. Automated weighing and moisture sensor system to assess the hygrothermal response of wood-sheathing and combined membrane sheathing wall components. Submitted to the 11th Symposium for Building Physics, Dresden, Germany, 2002.
Ojanen, T. and M.K. Kumaran 1992. Air exfiltration
and moisture accumulation in residential wall cavities. Thermal Performance of the Exterior Envelopes of Buildings V, Proceedings of the ASHRAE/DOE/BTECC Conference (Clearwater Beach, FL., USA, 1992) pp. 491-500, 1992. (NRCC-33974) (IRC-P-1758)
Ojanen, T. and M.K. Kumaran 1996. Effect of
exfiltration on the hygrothermal behaviour of a residential wall assembly, Journal of Thermal Insulation and Building Envelopes Vol. 19, pp. 215-227. (NRCC-39860)
Salonvaara, M. and A.N. Karagiozis 1994. Moisture
Transport in Building Envelopes using an Approximate Factorization Solution Method. CFD Society of Canada, Toronto, June 1-3, 1994.
Salonvaara, M.H. and A.N. Karagiozis 1998.
Influence of waterproof coating on the hygrothermal performance of a brick facade wall system. ASTM Symposium on Water Leakage Through Building Facades (Orlando, Florida, U.S.A., 1996) pp. 295-311, 1998 (ASTM Special Technical Publication vol. 1314) ASTM-STP-1314.
Hens, H. 1996. Final report Task 1. Modeling and
Common Exercises. Summary reports.
International Energy Agency, Energy Conservation in Buildings and Community Systems, Annex 24 Heat, Air and Moisture Transport in New and Retrofitted Building Envelope Parts (HAMTIE).
Table 1-Physical properties of materials
Material Dry Density (kg/m3)
Thickness (mm)
OSB 650 11.5 VII 464 0.14
Figure 1 Weighing system for monitoring changes in
MC of oriented-strand board (OSB) specimens
Figure 2 Sorption curve for oriented-strand-board
(OSB) – MC as a function of % RH
Figure 3 Sorption curve for sheathing membrane VII–
MC as a function of % RH. Oriented Strand Board
0.0 0.1 0.2 0.3 0.4 0.5 0% 20% 40% 60% 80% Relative Humidity Moi s tu re C ont e n t [ k g( w )/ k g( d) ] Specimen racks Specimens Load cells Membrane VII 0.000 0.005 0.010 0.015 0.020 0.025 0.030 0% 20% 40% 60% 80% Relative Humidity M o is tur e C onte n t [k g(w )/ k g(d)] VII
Figure 4 Liquid diffusivity of oriented-strand-board
(OSB) and membrane VII.
Figure 5 Vapour permeance (x-direction) of
oriented-strand-board (OSB) and membrane VII.
Figure 6 Boundary conditions for the experiment
showing the recorded temperature (T) and relative humidity (RH) in the climatic chamber as a function of time conducted over 30 days.
Figure 7 Total moisture content as function of time of
OSB layer – specimen 1 (Experiment / Simulation)
Figure 8 Total moisture content as function of time of
OSB layer – specimen 2 (Experiment / Simulation)
Figure 9 Total moisture content as function of time of
OSB layer wrapped on both sides with membrane VII (Experiment / Simulation)
Oriented Strand Board
0.0E+00 5.0E-12 1.0E-11 1.5E-11 2.0E-11 2.5E-11 3.0E-11 0.0 0.5 1.0 1.5 Moisture Content [kg(w)/kg(d)] L iq u id D iffu si vi ty (x-d ir ) [m 2/s ]
Liquid Diffusivity (x-dir) for Membranes VII = 1.0E-16 [m2/s]
0 5 10 15 20 25 30 35 40 45 50 11/21/99 0:00 11/26/99 0:00 12/1/99 0:00 12/6/99 0:00 12/11/99 0:00 12/16/99 0:00 12/21/99 0:00 12/26/99 0:00 T em p er at u re ( C ) 0 5 10 15 20 25 30 35 40 45 50 R e la ti v e H u m idi ty (% ) %RH T 0% 10% 20% 30% 40% 50% 60% 70% 80% 90% 100% 0 5 10 15 20 25 30 Time (Days) Tot a l M o is tu re C ont e n t ( k gw / k gd) Simulation Experiment 0% 10% 20% 30% 40% 50% 60% 70% 80% 90% 100% 0 5 10 15 20 25 30 Time (Days) Tot a l Moi s tu re C ont e n t ( k gw / k gd) Experiment Simulation 0% 10% 20% 30% 40% 50% 60% 70% 80% 90% 100% 0 5 10 15 20 25 30 Time (Days) Tot a l M o is tu re C ont e n t ( k gw / k gd) Simulation Experiment
Oriented Strand Board & Membranes VII
0.0E+00 1.0E-12 2.0E-12 3.0E-12 4.0E-12 5.0E-12 6.0E-12 7.0E-12 8.0E-12 9.0E-12 1.0E-11 0% 20% 40% 60% 80% Relative Humudity V a pour P e rm e a b ilit y ( x -d ir ) [ k g /m P a s ] OSB Vapour Permeability (x-dir) for Membranes VII = 6.08E-13 [kg/m Pa s]