HAL Id: hal-01698397
https://hal.laas.fr/hal-01698397
Submitted on 16 Feb 2018
HAL is a multi-disciplinary open access
archive for the deposit and dissemination of
sci-entific research documents, whether they are
pub-lished or not. The documents may come from
teaching and research institutions in France or
abroad, or from public or private research centers.
L’archive ouverte pluridisciplinaire HAL, est
destinée au dépôt et à la diffusion de documents
scientifiques de niveau recherche, publiés ou non,
émanant des établissements d’enseignement et de
recherche français ou étrangers, des laboratoires
publics ou privés.
Prediction of LIN communication robustness against
EFT events using dedicated failure models
Fabien Escudié, Fabrice Caignet, Nicolas Nolhier, Marise Bafleur
To cite this version:
Fabien Escudié, Fabrice Caignet, Nicolas Nolhier, Marise Bafleur. Prediction of LIN communication
robustness against EFT events using dedicated failure models. Microelectronics Reliability, Elsevier,
2017, 76-77, pp.685 - 691. �10.1016/j.microrel.2017.07.032�. �hal-01698397�
Prediction of LIN Communication Robustness Against EFT Events
Using Dedicated Failure Models.
F. Escudié
a,*, F. Caignet
a, N. Nolhier
a, M. Bafleur
aa LAAS-CNRS, Université de Toulouse, CNRS, UPS, Toulouse, France
Abstract
During its life, an automotive application can encounter several perturbations such as fast transient of ESD discharges. In this paper, we propose a LIN transceiver behavior model to predict both hard and soft failures within a communication link. The proposed model, extracted from measurements, is implemented into simulation as a failure block. We will show that depending on the output state of the LIN, the data reading behavior could be different. Using such model, corrections at system level can be implemented to avoid failures.
Corresponding author.
[email protected]
Tel: +33 5 61 33 64 89
* Corresponding author. [email protected] Tel: +33 5 61 33 64 89
Prediction of LIN Communication Robustness Against EFT
Events Using Dedicated Failure Models
F. Escudié
a,*, F. Caignet
b, N. Nolhier
c, M. Bafleur
* Corresponding author. [email protected] Tel: +33 5 61 33 64 89
1. Introduction
The automotive industry includes more and more electronic systems that provide better functionalities and security. For safety reasons, the electronic implementation and the embedded ICs (integrated circuits) are more concerned by robustness and reliability. In operating conditions, cars are exposed to external perturbations. As the systems are not directly connected to ground, fast discharge events due to electrostatic accumulations or disconnections of cables can generate Electrical Fast Transient (EFT) perturbations [1]. These perturbations can induce critical faults in the automotive applications, which has impact on the passengers’ safety. To predict the severity of the failures, system level simulation as defined in [2] is helpful. In this study we will focus on Local Interconnect Network (LIN) drivers used in automotive systems to connect Electronic Control Units (ECU) to sensors and/or actuators. This component is a reference in automotive communication applications. There are several LIN component manufacturers. Three of them named A, B and C, are investigated. We used a TLP (Transmission Line Pulse) generator, to reproduce an EFT event on the LIN Bus. All failures can be listed in two groups. The first one called “Hard failure” is the destruction of the IC, already mentioned in [3,4]. The second one is the “Soft Failure” [5,6,7,8] which relates to functional problems such as the lost of clock, RESET, etc… In this paper, we propose a methodology to develop a behavior model of the LIN component based on different set-up measurements. The main objective of this model is to reproduce the LIN communication behavior under EFT stress. This model can be used at system level to predict defaults on the communication. The implementation into the simulation is detailed as well as the way the different block are built from measurements. After introducing hard failure, detailed analysis of the observable soft failures is given. From the measurements, the failure criteria are chosen and implemented into the model. Finally, predicting
simulations are given and compared to measurements, demonstrating the validity of the model.
2. LIN Model developed
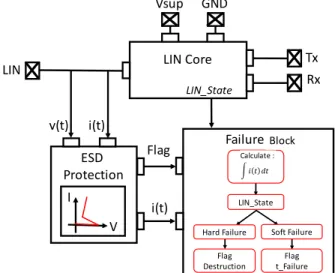
The model proposed in Fig.1, is made of three parts that can be developed independently. The “LIN Core”, is the basic function of the LIN transceiver, implemented in behavioral language (numerical part in VHDL, and analog part in VHDL-AMS). In our study only the transceiver function is coded.
The second block, which is called “ESD Protection”, describes the IC’s ESD protection strategy. The way to extract and implement this block in simulation is explained in the next section. The main block, called “Failure Block” (FB), can provide flags which depend on the severity of the failure (such as destruction or communication failure for a certain duration in our case.). This block is connected to the ESD protection block and to the functional block through dedicated signals. The way these signals are defined and extracted from Core and ESD block will be described in the next part.
LIN Core ESD Protection I V Flag i(t) i(t) v(t) Failure Bloc LIN TxRx LIN_State Calcul&: ! " # $# LIN_State Soft&Failure Hard&Failure Flag&
Destruction t_FailureFlag
Vsup GND
Block
Calculate :
3. LIN model development
3.1. ESD Protection block
Following previous works [3,5,9], behavioral models of the on-chip protection strategy are built using static measurements. We extract the quasi-static IV curves of the LIN components using a TLP generator with 100ns duration and 1ns rise time. The measurement is performed between LIN pin, ground pin and the power supply pin (LIN, GND and Vsup). The LIN pin is exposed to the outside of the system and is supposed to get EFT. By measuring those 3 pins, we are able to reconstruct (or reproduce the behavior) of the on-chip ESD protection strategy. This strategy is crucial to reproduce the on-chip current paths that can differ related to the off-chip components [3]. The Fig.2 shows the quasi-static IV curves of the LIN-GND protection under positive stress for the different LINs named A, B and C. It can be noticed that on these 3 components, the ESD strategy is different. One behavior is quite similar to diode, the two others one look like snapback devices.
0 2 4 6 8 10 12 14 16 0 10 20 30 40 50 60 70 80 LIN-A LIN-B LIN-C Cu rr en t'( A) Voltage'(V)
Fig. 2. IV quasi-static curves of the positive LIN-GND protection of the three LIN components A, B & C.
The way to implement these curves in simulation is already mentioned in [4]. As is shown in Fig.1 the ESD protection block is connected to the Failure Block via two signals. The signal “Flag” is set when the protection is activated. The i(t) signal representing the current through the device is transfered to the Failure Block to compute the failure level. As the determination of the failure is based on the current shape, a precise dynamic protection model is built following the methodology described in [9] where the dynamic behavior of the protection is externally measured.
3.2. Failure Block
Regarding the LIN failures (Fig 6-7), errors on data transfer arise only while the protections are activated. This block determining the failure type (Hard or Soft) is activated via the signal “Flag” when
the protection is triggered. In the block, the current which passes through the protection (Signal “i(t)”) is computed using the formula (1).
X(t) = ò i(t) dt (1)
A comparison between the X(t) value to the Hard Failure table and the Soft Failure table, determines which failure is induced by the stress.
3.2.1 Hard failure table
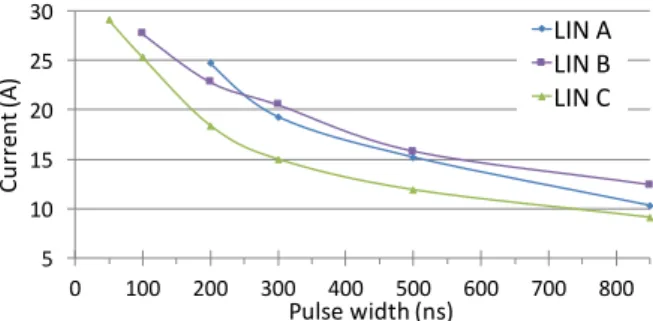
Wunsch-Bell (W&B) curve [10] is computed to get the hard failure. We used a TLP generator with six different pulse widths (50ns, 100ns, 200ns, 300ns, 500ns and 850ns). We incremented step by step the TLP voltage until the IC destruction. An increased leakage current is the failure criteria.
5 10 15 20 25 30 0 100 200 300 400 500 600 700 800 LIN-A LIN-B LIN-C Cu rr en t'( A) Pulse'width'(ns)
Fig. 3. W&B of the LIN-GND protection for three LIN
Using the formula (1) on the W&B curves we get a maximum Level (Level_max) curve (see Fig.4).
Level_Max
X(t)
Time0(ns)
I*t0(A.s)
Hard0Failure
Fig. 4. Comparison between the limit of hard failure (level_max) and the real time data computing X(t)
The failure block compares the integral of the current through the protection X(t) and Level_Max. If
X(t) reaches the Level_Max value, the failure block
sets a flag which indicates a destruction.
3.2.2 Soft Failure table
For soft failure table, we study each LIN component in operation conditions. The component is in “Slave” mode and we configure it to “Normal”
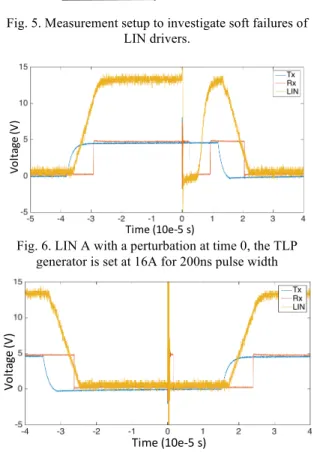
mode. The measurement setup is reported in Fig.5. A DC regulator provides 14V to the power supply pin “Vbat” and 5V to “En” pin (which enables the LIN driver and configures the “Normal” mode). The “Tx” pin is connected to the TTL output of a 8110A pulse generator, which represents the 0-5v information from microcontroller, at 10Khz with 50% duty cycle (max rate data 20Kb/s). The LIN driver writes on the “LIN” bus all information from “Tx”, a few microseconds later (levels: 0-14V). “Rx” pin is the image of the information transmitted on the bus, read by the driver and returned to the microcontroller for verification. Three voltage probes allow us to control “Tx”, “Rx” and “LIN” on an oscilloscope. The TLP injection is performed directly to the LIN pin through a diode.
5v 18v Vbat TLP(generator LIN Rx Tx En Li n Re gu lat or Pulse( generator Lin Tx Rx R2.2k Ch1 Ch3 Ch2 14v 0@5v(10Khz
Fig. 5. Measurement setup to investigate soft failures of LIN drivers. Time%(10e)5%s)% Vo lta ge %(V )%
Fig. 6. LIN A with a perturbation at time 0, the TLP generator is set at 16A for 200ns pulse width
Vo lta ge ((V )( Time((10e05(s)(
Fig. 7. LIN A with a perturbation at time 0, the TLP generator is set at 2A for 200ns pulse width
The measurement reported Fig.6, is obtained with a (16A-200ns) TLP injection appearing during high state on LIN bus. The perturbation activates the LIN-GND protection that drives the LIN to low state during around 5µs. The Rx pin follows and reports a failure to the microcontroller.
When the TLP (2A-200ns) stress arrives during low state Fig.7, no change is observed on LIN pin, but Rx reports a failure for few µs (1-2µs).
Each component A, B and C are tested following the same configuration. All perturbations (amplitudes and durations) that create an Rx state change are summarized in table.1. The failure durations are reported (depending on their severity), regarding the TLP amplitude (A) and TLP duration (50ns, 100ns, 200ns and 300ns). One column represents the observable fault for one component (A, B or C) depending on the pulse width for a given current injection level. Ten severity levels of failures on the RX pin are reported from “No error” (white), to more than 8µs data error (Black) on the top of the figure. First graph gives the errors while the output state of the LIN bus is at High level, the second one for Low level.
Table. 1. Failure duration detected on Rx, depending on
the TLP characteristics for LIN A, B and C.
Looking at this table, it seems that the response of the component to the same stresses depends on the on-chip ESD strategies and the function implemented on the LIN Core.
The only observed failure on component C is obtained during the Low state for the most critical
injection (16A, 300ns). We can wonder why this component is even more robust than the two other ones. Looking at the signals into detail, even on component C (see Fig.8), errors can be observed on the LIN bus. All these errors are not reproduced on the
Rx pin, while components A & B reproduce what is
observed on the LIN bus. It seems that the architecture of component C has an on-chip data correction system.
Vo lt ag e( (V )( Time((10e05(s)(
Fig. 8. Measurement results for the LIN C stressed by TLP (8A-300ns).
As shown in table.1, the susceptibility depends on the LIN state. At simulation level this information is given by the signal “LIN State” from the LIN core to the Failure Block (see Fig.1). The failure’s durations read on Rx, obtained for various TLP pulse widths, during a High state for LIN A, are reported in fig. 9. The X-axis is the Pulse duration (PW) multiplied by the TLP current (Itlp).
Fig. 9. Failure duration for different pulse widths, state High (Tp_High), related to the product Pw.Itlp (LIN A).
A dedicated failure level function is implemented in simulation. This function is the sum of each failure’s durations generated by each pulse width. The resulting failure function is reported in black in Fig.9. The computation is performed in a same way than for
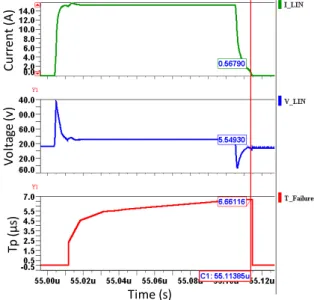
“Hard failure”. In simulation X(t) is compared to the product Pw.Itlp value and a corresponding failure duration is attributed to the flag T_failure. Fig.10 reports the simulation results for a 100ns, 16A TLP injection during state high on LIN pin. T_failure arises at the end of the simulation. This leads to 6.52µs in measurement table.1, and the simulation gives us 6.66µs related to our computing technique.
Vo lta ge ((v ) Cu rr en t(A ) Tp (µ s) Time((s)
Fig. 10. Simulation results for the LIN A stressed by 100ns TLP injection set at 800V.
For the LIN B (high state) we followed the same process and obtained the failure function reported in black in fig.11. A similar shape is observed that is not the case for low state of component B (fig.12). We plot on the left the normal representation with Pw.I as X-axis and on the right X-axis is only the TLP current I. Pw.I TLP (A.s) #10-6 0 1 2 3 4 5 Tp High (s) #10-6 0 1 2 3 4 5 6
7 erreur TI etat haut
50ns 100ns 200ns 300ns model
Fig. 11. Failure duration for different pulse widths, state High (Tp_High), related to the product Pw.Itlp (LIN B).
Pw.I TLP (A.s) #10-6 0 1 2 3 4 5 Tp Low (s) #10-5 0 0.2 0.4 0.6 0.8
1 erreur TI etat bas 50ns 100ns 200ns 300ns I (A) 0 5 10 15 20 Tp Low (s) #10-5 0 0.2 0.4 0.6 0.8 1 Tp Low (s) 50ns 100ns 200ns 300ns
Fig. 12. Failure duration for different pulse widths, state Low (Tp_Low), related to the product Pw.Itlp on left and
related to the TLP current I on the right. (LIN B)
As is shown the failure duration is much more important for one value of current injection (8A-10A). It is difficult to see the direct link with Pw.I. Whatever, for all devices, the model is based on the maximum failure duration obtained for one Pw.I. This representation allows taking into account the worst case for each TLP configuration.
4. Validation of the proposed model
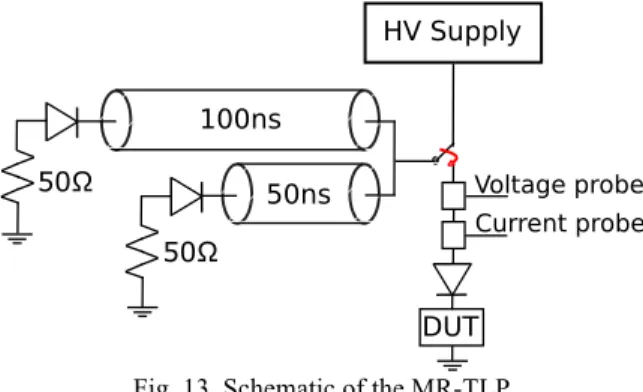
We used the Multi-Reflection TLP (MR-TLP) developed by [11] represented in fig.13 to test the predictability of our model. This generator replaced the basic TLP used in the configuration fig.5.
100ns 50ns 50Ω 50Ω HV Supply DUT Voltage probe Current probe
Fig. 13. Schematic of the MR-TLP
The MR-TLP is charged by the High Voltage source (HV) set at 400v. The voltage probe is made by a 500Ω pick-up-T and the current probe is a CT2.
In the following part, we introduced into the simulation the set-up of the MR-TLP. The simulation of 400v pre-charged on the high state of LIN for the component A is reported in the fig.14. On the left we have the current waveform, as it is shown this generator used on the LIN has only two step. For this stress the simulation give us failure duration of 6.1µs, on the right fig.14.
Time%(s) Time%(s) Cu rr en t(A ) Tp (µ s)
Fig. 14. Simulation LIN A under MR-TLP (400v)
The current and voltage waveform measured is reported fig.15. As shown, the measured current is slower to reach the first step than the simulated current mainly due to transient effects of the measurement setup and DUT that are not included in our simulation. Despite this mismatch, both, stress shape and current level are similar.
Cu rr en t(A ) Time-(ns) Vo lta ge -(v ) Time-(ns)
Fig. 15. Current and Voltage waveform for the MR-TLP (400v) on the LIN A.
The impact of this stress on the high state of LIN for the component A is measured and reported fig.16. The LIN falling down and the component reports on the Rx pin a failure duration of 6µs as obtained by simulation. Temps #10-5 -4 -3 -2 -1 0 1 2 volts -2 0 2 4 6 8 10 12 14 Failure1 100V Tx Rx LIN Time%(10e)5%s)
Vo
lta
ge
%(v
)
6µsFig. 16. Measurement results for the LIN A under MR-TLP (400v).
Our model can predict well the failure type and the failure duration for the soft failure. That works well for an ESD with rectangular shape because this is also our reference in the soft failure table. Following all methodology presented in this paper, we will improve our model, in order to take into account other stress like IEC-61000-4-2.
5. Conclusion and prospective
In this paper, we developed a LIN behavior model based on different measurement set-ups. The LIN transceiver was studed alone in slave mode without external components. We studied in normal mode operation the behavior of the component under EFT stress on LIN Bus. The methodology was applied on three LIN from different manufacturers. All defaults on the LIN communication were analyzed and implemented in simulation into a failure block. This block is able to predict which failure is induced during an ESD event.
Using the proposed model, it is possible to evaluate the duration of state failure on the Rx. In system consideration (when a processor is connected to Rx), by knowing the failure duration, it would possible to enhance an appropriate reading strategy to remove the default on LIN communication.
Acknowledgements
The authors would like to thanks the French National Agency of Research (ANR) for its financial support.
References
[1] J.Rivenc, J.Vazquez-Garcia, P. Matossian, B. et al., “An
overview of the technical policy developed by Renault to manage ESD risks in airbags”, Industry Applications Conference, 2004. 39th IAS. 2004 IEEE, 3-7 Oct. 2004
[2] White Paper 3, System Level ESD, Part 1, Industry
Concil ESD Target Levels,2011
[3] N. Monnereau, F. Caignet, D. Trémouilles,
"Building-up of system level ESD modeling: Impact of a decoupling capacitance on ESD propagation," Electrical Overstress/ Electrostatic Discharge Symposium (EOS/ESD), 2010 32nd, pp.1-10, 3-8 Oct. 2010
[4] N. Monnereau, F. Caignet, N, Nolhier, et al.,
"Behavioral-Modeling Methodology to Predict Electrostatic-Discharge Susceptibility Failures at System Level: An IBIS improvement," EMC Europe 2011 York, pp.457,463, 26-30 Sept. 2011.
[5] N. Monnereau, F. Caignet, N. Nolhier, et al.
« Investigation of Modeling System ESD Failure and Probability Using IBIS ESD Models », IEEE Trans. on Device and Materials Reliability, Volume: 12 Issue: 4 Pages: 599-606, Dec. 2012.
[6] B. Orr, P. Maheshwari, H.Gossner, “A Systematic
Method for Determining Soft-Failure Robustness of a
Subsystem”, 35th Electrical Overstress/Electrostatic
Discharge Symposium (EOS/ESD), Sept.2013.
[7] A.Vaskova, M.Portela-Garcia, M. Sonza Reorda,
“Hardening of serial communication protocols for potentially critical systems in automotive applications: LIN bus”, On-Line Testing Symposium (IOLTS), 2013 IEEE 19th International.
[8] N. Lacrampe, A. Alaeldine, F. Caignet, et al.,
"Investigation on ESD Transient Immunity of Integrated Circuits," IEEE International Symposium on Electromagnetic Compatibility, Honolulu (USA), 8-13 July 2007
[9] Fabien Escudié, Fabrice Caignet, Nicolas Nolhier,
Marise Bafleur, “From Quasi-static to Transient System Level ESD Simulation: Extraction of Non-linear Turn-on Elements”, 38rd Electrical Overstress/Electrostatic Discharge Symposium (EOS/ESD), 2016.
[10] D. Wunsch and R. Bell, “Determination of threshold failure levels of semiconductor diodes and transistors due to pulse voltages,”, IEEE Transactions on Nuclear Science, vol. 15, no. 6, pp. 244–259, 1968.
[11] Farzan Farbiz and Akram A. Salman “Multi-Reflection TLP: A New Measurement Technique for System-Level Automotive ESD/EMC Characterization” Electrical Overstress Electrostatic Discharge Symposium