HAL Id: hal-01342854
https://hal.archives-ouvertes.fr/hal-01342854
Submitted on 6 Jul 2016
HAL is a multi-disciplinary open access
archive for the deposit and dissemination of
sci-entific research documents, whether they are
pub-lished or not. The documents may come from
teaching and research institutions in France or
abroad, or from public or private research centers.
L’archive ouverte pluridisciplinaire HAL, est
destinée au dépôt et à la diffusion de documents
scientifiques de niveau recherche, publiés ou non,
émanant des établissements d’enseignement et de
recherche français ou étrangers, des laboratoires
publics ou privés.
Evaluation of the Stability of Four Document
Segmentation Algorithms
Sébastien Eskenazi, Petra Gomez-Krämer, Jean-Marc Ogier
To cite this version:
Sébastien Eskenazi, Petra Gomez-Krämer, Jean-Marc Ogier. Evaluation of the Stability of Four
Doc-ument Segmentation Algorithms. DocDoc-ument Analysis Systems, Apr 2016, Santorini, Greece.
pp.215-220, �10.1109/DAS.2016.25�. �hal-01342854�
Evaluation of the stability of four document
segmentation algorithms
S´ebastien Eskenazi, Petra Gomez-Kr¨amer, and Jean-Marc Ogier
L3i, University of La Rochelle, Avenue Michel Cr´epeau, 17042, La Rochelle, FranceEmail:{sebastien.eskenazi, petra.gomez, jean-marc.ogier}@univ-lr.fr
Abstract—The importance of having stable information
ex-traction algorithms for security related applications and more generally for industrial use cases has been recently highlighted. Stability is what makes an algorithm reliable as it gives a guarantee that the results will be reproducible on similar data. Without it, security criteria such as the probability of false positives cannot be quantified. As a consequence, no security application can be built from an unstable algorithm. In a doc-ument verification framework, the probability of false positives indicates the probability that two different results are given for two copies of the same document. This paper builds on our previous work about a stable layout descriptor to study the stability of four segmentation algorithms. We consider that a segmentation algorithm is stable if it produces the same layout for all copies of the same document. The algorithms studied are two versions of PAL, Voronoi, and JSEG. We compare the stability of the different algorithms and study the factors influencing their stability.
I. INTRODUCTION
Many documents need to be secured, ideally by the means of an electronic signature. Typically, the electronic signature is obtained by computing a hash code on the document’s pixels values. If two documents have the same signature, then they are authentic copies of each other and if their signatures are different, one of the two documents is fraudulent or at least different from the other one. This concept works well for naturally born digital documents. However, nowadays a document, the so-called hybrid document, is often used in electronic or paper form according to the need. Hence, the hybrid document undergoes a life cycle of printing and scanning and thus different degraded versions of the document exist as the printing and scanning process introduces specific degradations, such as print and scan noise, in the document [1]. Thus, the concept of electronic signature can not be applied. For this reason, our work intends to develop an advanced electronic signature for the field of securing hybrid documents, the so-called hybrid security. To our knowledge, the closest work is a signature [2] based on pixel-wise signal analysis techniques which is not satisfactory because of its large size. Other signatures such as the 2D-Doc [3] require the emitter of the document to provide the information used for signature computation, e.g. the name and the address of the beneficiary, and thus secures only partially the document (the provided information, but for instance not the layout).
Our idea is to extract the layout, the text and the images from the document to compute a stable signature that will be
the same for all the authentic copies of the document. Here, we consider that an authentic copy should have the same layout as the original. We are aware about the fact that the layout is not sufficient to embed the total information of a document, but it is a important step to characterize its content. A smaller signature than [2] will result as the amount of information to be secured is smaller since the image is not processed pixel-wise. However, this signature will still allow to secure the whole information of the document. In consequence, this requires a segmentation algorithm that is stable with respect to print and scan noise so that two copies of the same document can have the same signature. This paper studies the suitability of current document segmentation algorithms for such a task.
A lot of work has been presented for evaluating segmenta-tion accuracy [4], [5]. Anyhow, the concept of accuracy does not apply to our security context. The two concepts of accuracy and stability should not be confused. Accuracy requires a ground truth to evaluate how close a result is to this ground truth. Accuracy can be evaluated with only one result as long as there is also a ground truth. Stability does not require a ground truth. Stability requires at least two results with similar inputs to see how close these results are together compared to how close the inputs were. In our case, similar inputs are two photocopies of the same document. A consequence of this is that an algorithm can be very stable and yet not be accurate. For instance, this can be an algorithm that always makes the same mistakes or in the case of a segmentation algorithm, an algorithm producing always one region covering the whole image. Such an algorithm would have an absolute stability and zero accuracy. The contrary is not true. An algorithm with an absolute accuracy will always produce results that are identical to the ground truth and hence identical between each other. A perfect segmentation algorithm will also be perfectly stable.
Furthermore, stability should also not be confused with robustness. A robust algorithm is an algorithm capable of providing a relevant output even when a certain amount of noise is contained in its input. The variation of this output is not constrained as it is for stability.
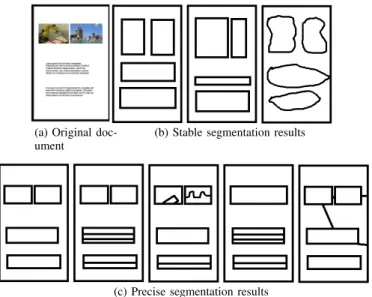
This raises the question of defining similar segmentation results. The first criteria is that they should have the same number of regions. Then, these regions should have a similar relative position. This is what we call the layout. To illustrate this definition Figure 1c shows a set a of precise segmentation results. They all match the overall shape appearance of the
(a) Original doc-ument
(b) Stable segmentation results
(c) Precise segmentation results
Fig. 1. Difference between precise and stable segmentation results
original document. On the contrary figure 1b presents some segmentation results that are less precise but stable. They all have two regions side by side at the top of the document and two regions on top of each other at the bottom. In order to have a precise criteria, we will use the Delaunay Layout Descriptor that we have created specifically for this purpose [6]. This definition is quite minimal as there is a strong tradeoff between the precision of describing the layout and its stability. Moreover, the content of a region can be, for instance, represented by its textual content instead of its size. We will now present the studied algorithms and the evalua-tion protocol in secevalua-tions II and III respectively. Then we will present the results of our study in section IV before concluding this paper in section V.
II. STATE OF THE ART
There are two kinds of works related to this paper: the work on segmentation evaluation and the work on document image segmentation algorithms.
A. Evaluation of segmentation algorithms
Evaluations of document segmentation algorithms are reg-ularly published either as a dedicated papers [7], [8] or as a competition report [4], [5], [9]–[11]. These papers have investigated how to evaluate a single segmentation result based on a given ground truth. A corollary is the question of the quality, relevance and bias of the ground truth [8]. To take a trivial example, a line-wise ground truth will favor line segmentation algorithms over paragraphs segmentation algorithms. Yet, both kinds of algorithms could actually be of nearly equal use and of equal quality.
Regarding the comparison of several results with each other, i.e. stability, to our knowledge, the only paper treating this topic is the one by Guo et al. [12]. They analyze the stability of an algorithm for curve line extraction from natural images. To this intent, they use several similar images of the same scene and analyze the performance variation. However, this
work still requires a ground truth to evaluate the performance of the algorithm on each image.
B. Segmentation algorithms
The latest document segmentation competitions provide a good state of the art of document segmentation algorithm. They can be completed with [13]–[16].
Out of these, we selected the best segmentation algorithm in the latest competition at the time of writing this paper. The PAL [17] algorithm won the two ICDAR 2013 competitions on historical document layout analysis [4], [5]. It is a top down algorithm working on binary images. Furthermore, Shafait et al. [7] did an analysis of document segmentation algorithms and found that Voronoi segmentation [18] was the best.
To complete our panel we added JSEG [19]. JSEG is originally made for segmenting natural images and is a refer-ence algorithm. It has the particularities of being quite robust and of using color textures as well as a multiscale analysis. All this makes it an interesting natural image segmentation algorithm. It will allow us to study the impact of color textures and multiscale analysis on stability and the applicability of natural image segmentation algorithms to document image segmentation.
PAL was published by Chen et al. at ICDAR 2013 [17]. The algorithm works by identifying text line chains based on connected components. Then it detects the white spaces along each chain and filters them according to some heuristics. It produces two outputs: line rectangles and block rectangles. Hence we separated it into two algorithms: PALL for the identification of the lines and PALB for the blocks.
The Voronoi algorithm was published in 1998 by Kise et al. [18]. It is a versatile segmentation algorithm that works for any document layout. It creates edges between points sampled on each connected component. Then it removes the superfluous edges that are too short or that connect connected components of sizes that are too different.
JSEG was described by Deng and Majunath in 2001 [19]. It first quantizes the image colors. Then it segments/clusters the image based on the J value of each region. The J value is an indicator of uniformity of the region. Because it works at several scales, it can segment non-uniform textures. We used the implementation available on the project website1.
III. EVALUATION PROTOCOL
In order to provide a proper analysis of the algorithms we performed a cross-validation of the algorithms on a dataset of 990 document images.
A. Dataset
Our dataset is based on the PRImA dataset used in 2009 [10]. It has the advantage of having documents with a very varied content. We printed its 55 pages with 3 printers: a Lexmark x543 PS, a Canon iR Advance C9060 Pro and a Konica Minolta C5501. We then scanned each sheet of paper
Scanner 300 dpi 600 dpi
Konica Minolta Bizhub 223 X XX
Konica Minolta Bizhub C364e X
Fujitsu fi 6800 X
Lexmark x543 PS X
TABLE I
SCANNING RESOLUTION FOR EACH SCANNER
three times at 300 dpi and three times at 600 dpi on several scanners as shown in Table I.
For each document there are 3 printers × 3 scanners × 2 resolutions = 18 copies. Thus the total dataset contains 18× 55 = 990 document images.
Because of the scanning process there are no perspective distortions and hardly any skew on the images. Hence the main degradations are print and scan noise, printing scale and image translation. The printing scale can vary slightly depending on the settings for printing an image. We used the defaults settings for all the printers.
B. Evaluation process
Considering the requirements of each algorithm, we resized the original 300 dpi and 600 dpi dataset (denoted HR) to 60 dpi (denoted LR). Then we tested all algorithms separately with high-resolution images and with low-resolutions images except for JSEG which cannot use HR images. This allows us to evaluate the influence of the resolution on the stability of the results. In order to have enough images for testing, we decided to perform a 5-fold cross-validation. The dataset is first split randomly into 5 datasets. The first dataset is used for testing in the first fold and the rest for training. The second dataset is used for testing in the second fold and so on.
C. Metrics
We use two metrics to evaluate the stability of the segmen-tation algorithms: the probability of false positives and the normalized standard deviation of the number of segmented regions.
1) Probability of false positives: The probability of false
positives (PFP) is widely used for evaluating the performance of a binary classifier such as a medical test or an authentication application. For the specific case of layout authentication/com-parison, it is the probability that the algorithm will produce two different layouts when given two inputs with the same layout. A stable algorithm should have a PFP below 5%.
As stated in the introduction, we consider that two segmen-tation results produce the same layout if the DLDs that they produce can be matched according to the method described by Eskenazi et al. [6]. We accepted an angle error of 5◦ and a maximum number of 2 simultaneous instabilities as defined in [6]. The DLD works by triangulating the centroids of the segmented regions. This triangulation is seen as a graph whose nodes are then ordered. The adjacency matrix of this ordered graph makes the DLD. As a side note, we reimplemented and accelerated the computation of the DLD approximately by a factor 30 and its matching by a factor 30× n where n is the number of simultaneous instabilities.
The probability of false positives is then computed image-wise. Let us consider one segmentation algorithm and one image I of an input dataset. Let ts be the number of the images including the first image I that have the same layout (copies of the same document). Then we count how many of these images yield a different segmentation result than that of image
I. Let t be the number of failed matches. The probability of
false positives for image I is given by:
P F PI =
t
ts (1)
The PFP for the algorithm is the average of all the PFPs for the images of the input dataset. During the cross validation, it can occur that there is only one copy of a document. In that case we will ignore it for the computation of the PFP.
D. Normalized standard deviation of the number of regions
Two layouts will never be identical if they do not have the same number of regions. Hence having a stable number of regions is a necessary condition to having stable results and the standard deviation (StD) of this number of regions should be as low as possible.
However an StD of 5 is high if there are 10 regions but low if there are 50 regions. Hence we normalize it by the number of regions produced for each document by each algorithm.
Let us consider a given algorithm and a given image I of a document from an input dataset. We list the number of regions of each segmentation result of the copies of the same document. Let ni be the number of segmented regions in the
ith copy.
The normalized standard deviation of the number of regions
SR for image I is computed as
SR(I) =
σ(ni)
ni
(2) where σ(ni) is the standard deviation of ni and ni is the average of ni.
Similarly to the PFP, the SRfor the algorithm is the average of all the SR for the images of the input dataset. Once again, we ignore the single copies of a document for the computation of the SR. To be able to analyze the values of
SR in more details, we also compute the average number of regions produced by each algorithm, here denoted as nR.
E. Algorithm specifities
The algorithms have different parameters which call for specific training strategies in order to evaluate each algorithm in the best conditions. As a rule of thumb we decided to study the parameter values around their default value.
1) PAL: Both versions of PAL take a color image as input
and do not use any parameter so we ran them on the complete dataset and evaluated them without training.
2) Voronoi: Voronoi takes binary images as input and has
five parameters. We binarized the original images with Otsu’s method [20]. We chose the parameter sampling rates in order to achieve the best trade-off between an exhaustive sampling of the parameters and a small number of combinations to provide the best possible training within a feasible time.
The first parameter is the sampling rate of the contour of the connected components which is used to select the vertices that will be the ends of the Voronoi tesselation. It can take an integer value above 1. The default value is 7 which means that 1 out of 7 pixels on the contours of the connected components will be selected. We consider the values between 5 and 10 included. A smaller value would result in a clear oversampling and bigger value could prevent a proper sampling of the contours of small connected components. The second parameter is the maximum length of the contour of a noise connected component. The default value is 20 pixels and we consider values between 10 and 50 pixels by increments of 5 pixels. Because these two parameters are pixel values, they need to be adapted to the image resolution. They are related to a length at a resolution of 300 dpi so we scale them linearly with the image resolution. The remaining parameters influence the removal of superfluous Voronoi edges based on the processing of the distribution of the distances of these edges. The interested reader can refer to [18] for a detailed explanation. The third parameter is the ratio of the value of the second highest peak which defines the maximum length of an edge. Its default value is 0.5. We make it vary between 0.2 and 0.8 by increment of 0.1. Considering the explanation of [18] a lower value would not be selective enough and a higher value would be too selective. The fourth parameter is the maximum area ratio between two regions linked by an edge. If the ratio is bigger than this value, the edge is deleted. The default value is 40 and we make it vary between 20 and 60 by increments of 5. The last parameter is the size in pixels of the smoothing window of the distance distribution. Its default value is 2. After performing exhaustive testing, the only relevant values are between 1 and 3.
This makes 6× 9 × 7 × 9 × 3 = 10206 parameter combina-tions. Considering the size of the dataset and the processing time, a brute force optimization would be inefficient. This is why we settled for the use of a genetic algorithm with a population of 20 individuals, 20 generations, a mutation probability of 0.05 and a mating probability of 0.6.
3) JSEG: JSEG requires a small resolution color image
as input (60 dpi maximum) and has three parameters. The requirement for a small resolution image is related to the convergence of the algorithm and its implementation. The color quantization threshold and the number of scales used for multiscale processing have an automatic mode which chooses the best parameter on an image per image basis. Because this is a finer grained tuning than fixing these parameters for the whole dataset, we used the automatic mode for them. The last parameter is the threshold to merge regions which can take a value between 0 (all regions are merged) and 1 (no regions are merged). Its default value is 0.4. Since the range of values is between 0 (no merging) and 1 (everything merged) we chose to study the values from 0.1 to 0.9 with a step of 0.1. Our preliminary tests have shown that a finer step does not result in a significant improvement. That makes 9 values to test so that a brute force training can easily be performed and ensures the best training.
IV. RESULTS
Before comparing the algorithms we will first analyze each of them. In all the following ”LR” indicates that we used the low-resolution dataset (60 dpi) and ”HR” the high-resolution one (300 and 600 dpi).
A. PAL
Table III summarizes the different results of both versions of PAL. As we can see it is not stable. The use of low-resolution images improves it a bit. This is mostly due to the fact that PAL is designed for text line extraction and over-segments the graphical areas. We also noticed that PALL and PALB tend to produce similar segmentation results on graphical areas. Thus, an improvement could be to remove the regions that are common to PALB and PALL results.
B. Voronoi
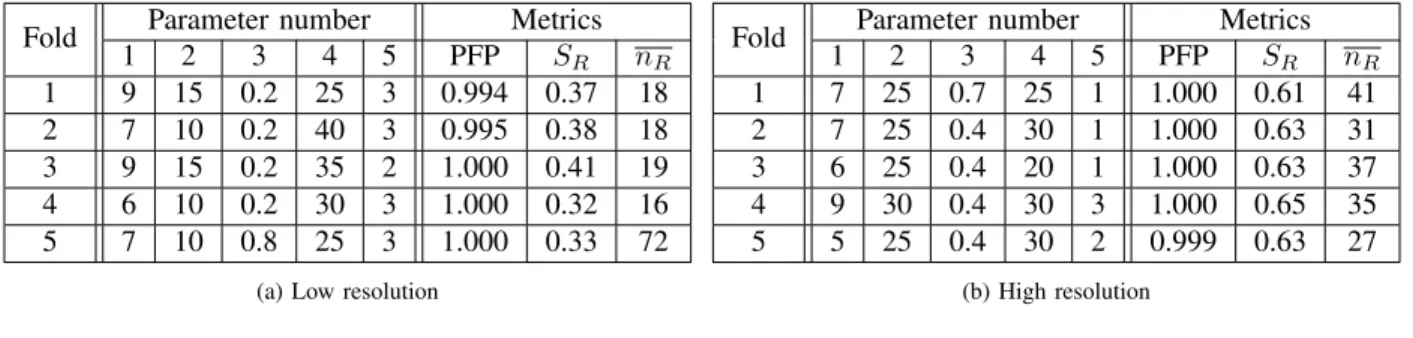
Table II summarizes the results of the Voronoi segmentation algorithm for each fold of the cross-validation. The numbering of the parameters is the same as that of section III-E2. From a global point of view, the algorithm performs better with low-resolution images although it is nearly as unstable as PAL. It has a slightly lower PFP, a lower SR and it produces a lower number of regions. The fifth fold of the low-resolution testing is a clear outlier.
Let us study the influence of each parameter. Table IV presents the maximum variation of the metrics when only one parameter is changed. We can already notice that the ranking of the influence of the parameters is the same for the PFP and for SR. This comes in support of the hypothesis that these metrics are related.
The contour sampling rate (parameter n◦1) has roughly the same value for HR and LR images. This means that our scaling of this parameter with the image size is adequate. Its best value seem to be 7 and it has an average influence on the algorithm performance.
The maximum size of a noise contour (parameter n◦2) has an optimal value in HR that is double of that in LR. It also has a strong influence on the algorithm performance. Its best value is 10 in LR and 25 in HR.
The ratio of the value of the second highest peak (parameter
n◦3) has a similar behavior between HR and LR. This can be explained by the fact that because the LR images have a smaller size, the peaks of the distribution of the distances of the Voronoi edges will be steeper. In order to keep enough edges, we need to have a lower threshold in LR than in HR. This parameter has a significant influence on the algorithm performance in LR and should be carefully tuned. This ex-plains its stability across the folds. Its best value is 0.2 in LR and 0.4 in HR.
The maximum area ratio between two regions (parameter
n◦4) is approximately the same in LR and HR, around 30, and has a low influence on the algorithm performance.
Finally, the optimal size of the smoothing window for the distribution of the distances of the Voronoi edges (parameter
Fold Parameter number Metrics 1 2 3 4 5 PFP SR nR 1 9 15 0.2 25 3 0.994 0.37 18 2 7 10 0.2 40 3 0.995 0.38 18 3 9 15 0.2 35 2 1.000 0.41 19 4 6 10 0.2 30 3 1.000 0.32 16 5 7 10 0.8 25 3 1.000 0.33 72
(a) Low resolution
Fold Parameter number Metrics
1 2 3 4 5 PFP SR nR 1 7 25 0.7 25 1 1.000 0.61 41 2 7 25 0.4 30 1 1.000 0.63 31 3 6 25 0.4 20 1 1.000 0.63 37 4 9 30 0.4 30 3 1.000 0.65 35 5 5 25 0.4 30 2 0.999 0.63 27 (b) High resolution TABLE II
VORONOI TESTING RESULTS. ALL VALUES SHOULD BE AS LOW AS POSSIBLE.
Version Resolution PFP SR nR PALB LR 0.998 0.32 26 HR 1.000 0.9 72 PALL LR 0.999 0.20 89 HR 1.000 0.34 149 TABLE III
PALTESTING RESULTS. ALL VALUES SHOULD BE AS LOW AS POSSIBLE.
that the peaks are steeper in LR than in HR and thus need more smoothing. This parameter has an average influence in LR and a very low influence in HR on the algorithm performance. It best value is 3 in LR and 1 in HR.
To summarize, parameter 2 (respectively 3) has the highest impact in HR (respectively LR). Parameters 4 and 5 have the lowest impact. Anyhow all parameters have a negligible impact in comparison to the improvement required to make the algorithm stable.
C. JSEG
Table V summarizes the testing results of JSEG for each fold. The RMT is the region merging threshold. The results do not vary much and are surprising because JSEG has a very good SR and a very bad PFP. This is due to the fact that the layout is not just related to the number of regions.
When looking deeper in the training data, we see that the PFP (respectively SR) decreases (respectively increases) when the region merging threshold increases. JSEG actually produces a stable number of regions when there are many regions and this number becomes more unstable when their number decreases. This suggest that the merging of JSEG process isunstable. When visually examining the quality of the segmentation results we notice that an RMT of 0.1 oversegments the document and an RMT of 0.9 undersegments it very clearly. In our opinion, the value of 0.3 achieves the best tradeoff with a PFP of 0.989, an SR of 0.270 and proper segmentation results.
The PFP on the training data goes from 0.73 to 1 with an average of 0.875, SR goes from 0.2 to 0.61 with an average of 0.44 and nR goes from 3 to 22 with an average of 10.
D. Comparison of the algorithms
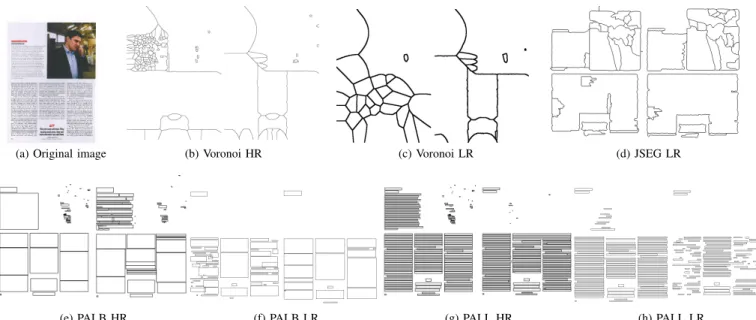
Figure 2 shows two results of each algorithm for each tested resolution on different copies of the same document with their
Parameter LR HR PFP (.10−4) SR PFP (.10−4) SR 1 3.7 0.023 1.7 0.034 2 6.4 0.030 6.6 0.097 3 12.6 0.026 1.8 0.055 4 3.1 0.019 1.8 0.025 5 5.2 0.033 0.2 0.026 TABLE IV
MAXIMAL MARGINAL VARIATION OF THE EVALUATION METRICS FOR EACH PARAMETER OF THEVORONOI SEGMENTATION
Fold RMT PFP SR nR 1 0.1 1.000 0.18 22 2 0.1 1.000 0.18 21 3 0.1 1.000 0.19 22 4 0.1 1.000 0.19 21 5 0.1 1.000 0.19 21 Best trade-off 0.3 0.989 0.27 12 TABLE V
JSEGTESTING RESULTS(ON LOW-RESOLUTION IMAGES). ALL VALUES SHOULD BE AS LOW AS POSSIBLE.
testing parameters. We can see the influence of the resolution on the algorithm results and their instability. Except for JSEG, they all tend to create artificial regions in place of the picture. Considering all the above, JSEG has a better performance in terms of the stability of the number of regions it produces. It is followed by PALL. Voronoi and PALB both perform honorably on low-resolution images but are heavily unstable on high resolution images. Regarding the probability of false positives, JSEG is also the only one that has one below 0.99. Texture features are known for being robust to noise and adding a multiscale analysis allows a global view of the layout which helps produce more stable results.
V. CONCLUSION
This paper treats a new field of evaluating algorithms : stability. To this end, we have provided a set of metrics and an evaluation methodology for studying the stability of segmentation algorithms. We have applied it on four state of the art algorithms on document images. Finally we have analyzed these algorithms in detail in order to understand what
(a) Original image (b) Voronoi HR (c) Voronoi LR (d) JSEG LR
(e) PALB HR (f) PALB LR (g) PALL HR (h) PALL LR
Fig. 2. Segmentation results of the algorithms
makes them stable or unstable and made recommendations on how to improve them.
Unfortunately, all the algorithms studied have a poor stabil-ity. The best one, JSEG, achieves only a probability of false positives of 99% which is far from the objective of being below 5%. We have also found that using texture features, multiscale analysis and low resolution images may help achieve a better stability.
We will need to evaluate more algorithms and to combine the evaluation of stability with more traditional metrics in order to ensure that the algorithms produce relevant results.
ACKNOWLEDGMENT
This work is financed by the French National Research Agency (ANR) project SHADES referenced under ANR-14-CE28-0022.
REFERENCES
[1] T. Kanungo, R. M. Haralick et al., “Global and local document degra-dation models,” in Proc. of 2nd International Conference on Document
Analysis and Recognition (ICDAR). IEEE, 1993, pp. 730–734. [2] A. Malvido Garci`a, “Secure Imprint Generated for Paper Documents
(SIGNED),” Bit Oceans, Tech. Rep. December 2010, 2013.
[3] ANTS, “Sp´ecifications techniques des Codes `a Barres 2D-Doc,” ANTS, Tech. Rep., 2013.
[4] A. Antonacopoulos, C. Clausner et al., “Competition on Historical Newspaper Layout Analysis (HNLA 2013),” in Proc. of 12th
Inter-national Conference on Document Analysis and Recognition (ICDAR).
IEEE, Aug. 2013, pp. 1454–1458.
[5] ——, “Competition on Historical Book Recognition (HBR 2013),” in
Proc. of 12th International Conference on Document Analysis and Recognition (ICDAR). IEEE, Aug. 2013, pp. 1459–1463.
[6] S. Eskenazi, P. Gomez-Kr¨amer et al., “The Delaunay document layout descriptor,” in Proceedings of the 2015 ACM Symposium on Document
Engineering - DocEng ’15. New York, New York, USA: ACM Press, 2015, pp. 167–175.
[7] F. Shafait, D. Keysers et al., “Performance evaluation and benchmarking of six-page segmentation algorithms,” Pattern Analysis and Machine
Intelligence (PAMI), vol. 30, no. 6, pp. 941–54, Jun. 2008.
[8] N. Stamatopoulos, G. Louloudis et al., “Goal-oriented performance evaluation methodology for page segmentation techniques,” in Proc. of
13th International Conference on Document Analysis and Recognition (ICDAR). IEEE, 2015, pp. 281–285.
[9] A. Antonacopoulos, C. Clausner et al., “ICDAR2015 Competition on recognition of documents with complex layouts,” in Proc. of 13th
Inter-national Conference on Document Analysis and Recognition (ICDAR).
IEEE, 2015, pp. 1151–1155.
[10] A. Antonacopoulos, S. Pletschacher et al., “ICDAR2009 Page seg-mentation competition,” in Proc. of 10th International Conference on
Document Analysis and Recognition (ICDAR), 2009, pp. 1370–1374.
[11] A. Antonacopoulos, B. Gatos et al., “ICDAR2007 Page segmentation competition,” in Proc. of 9th International Conference on Document
Analysis and Recognition (ICDAR). IEEE, 2007, pp. 1279–1283. [12] Y. Guo, N. Kumar et al., “A multi-stage approach to curve extraction,”
Computer Vision–ECCV 2014, pp. 663–678, 2014.
[13] G. Nagy, “Twenty years of document image analysis in PAMI,” IEEE
Transactions on Pattern Analysis and Machine Intelligence, vol. 22,
no. 1, pp. 38–62, 2000.
[14] S. Mao, A. Rosenfeld et al., “Document structure analysis algorithms: a literature survey,” in Proc. of Document Recognition and Retrieval
X, T. Kanungo, E. H. Barney Smith et al., Eds. Elsevier, 2003, pp. 197–207.
[15] A. Namboodiri and A. K. Jain, “Document structure and layout analy-sis,” Digital Document Processing, pp. 1–17, 2007.
[16] K. Kise, “Page segmentation techniques in document analysis,” in
Handbook of Document Image Processing and Recognition. London: Springer London, 2014, pp. 135–175.
[17] K. Chen, F. Yin et al., “Hybrid page segmentation with efficient whites-pace rectangles extraction and grouping,” in Proc. of 12th International
Conference on Document Analysis and Recognition (ICDAR). IEEE, Aug. 2013, pp. 958–962.
[18] K. Kise, A. Sato et al., “Segmentation of page images using the area voronoi diagram,” Computer Vision and Image Understanding, vol. 70, no. 3, pp. 370–382, Jun. 1998.
[19] Y. Deng and B. S. Manjunath, “Unsupervised segmentation of color-texture regions in images and video,” Pattern Analysis and Machine
Intelligence (PAMI), vol. 23, no. 8, pp. 800–810, 2001.
[20] N. Otsu, “A threshold selection method from gray-level histograms,”