Publisher’s version / Version de l'éditeur:
Vous avez des questions? Nous pouvons vous aider. Pour communiquer directement avec un auteur, consultez la première page de la revue dans laquelle son article a été publié afin de trouver ses coordonnées. Si vous n’arrivez pas à les repérer, communiquez avec nous à PublicationsArchive-ArchivesPublications@nrc-cnrc.gc.ca.
Questions? Contact the NRC Publications Archive team at
PublicationsArchive-ArchivesPublications@nrc-cnrc.gc.ca. If you wish to email the authors directly, please see the first page of the publication for their contact information.
https://publications-cnrc.canada.ca/fra/droits
L’accès à ce site Web et l’utilisation de son contenu sont assujettis aux conditions présentées dans le site LISEZ CES CONDITIONS ATTENTIVEMENT AVANT D’UTILISER CE SITE WEB.
CFD 2003, the Eleventh Annual Conference of the Computational Fluid
Dynamics, Society of Canada [Proceedings], 1, pp. 23-30, 2003-05-01
READ THESE TERMS AND CONDITIONS CAREFULLY BEFORE USING THIS WEBSITE. https://nrc-publications.canada.ca/eng/copyright
NRC Publications Archive Record / Notice des Archives des publications du CNRC :
https://nrc-publications.canada.ca/eng/view/object/?id=e5761219-d51c-4a8a-8723-eb9b21b7882b https://publications-cnrc.canada.ca/fra/voir/objet/?id=e5761219-d51c-4a8a-8723-eb9b21b7882b
NRC Publications Archive
Archives des publications du CNRC
This publication could be one of several versions: author’s original, accepted manuscript or the publisher’s version. / La version de cette publication peut être l’une des suivantes : la version prépublication de l’auteur, la version acceptée du manuscrit ou la version de l’éditeur.
Access and use of this website and the material on it are subject to the Terms and Conditions set forth at
Numerical modelling of air movement in road tunnels
Numerical modelling of air movement in road tunnels
Kashef, A.; Bénichou, N.; Lougheed, G.; Debs, A.
NRCC-43714
A version of this document is published in / Une version de ce document se trouve dans:
CFD 2003, the Eleventh Annual Conference of the Computational Fluid Dynamics Society of
Canada, Vancouver, B.C., May 28-30, v. 1, pp. 23-30
Numerical Modelling of Air Movement in Road Tunnels
Ahmed Kashef
1, Noureddine Benichou
1, Gary Lougheed
2, and Alexandre Debs
31Research Officer, 2Senior Research Officer at the National Research Council of Canada, Ottawa, Ontario,
3 Ministère des Transports du Québec, Montreal, Québec.
Email: ahmed.kashef@nrc.ca, noureddine.benichou @nrc.ca, gary.lougheed @nrc.ca,
and.adebs@mtq.gouv.qc.ca
A
BSTRACTThe objective of the Mechanical Ventilation Sys-tems (MVS) in highway tunnels [1] is to provide tunnel patrons with a reasonable degree of com-fort during normal operation and to assist in keeping tunnels safe during emergencies. Tem-perature, humidity, and air velocity are among the parameters that determine the tunnel envi-ronment and indicate the level of MVS perform-ance.
To investigate the performance of the current emergency ventilation strategies for an existing tunnel system in the event of a fire, a research project is being conducted at the National Re-search Council of Canada. The primary objec-tives of the study are: a) to assess and validate the ability of in-place emergency ventilation strategies to control smoke spread and minimize the impact of smoke on tunnel users; and b) to recommend guidelines for improving ventilation operation to maximize intervention effectiveness. This will allow future development of an intelli-gent ventilation system based on a pre-established scenario of ventilation activated us-ing automatic fire detection.
The research study includes two phases, numeri-cal and experimental phases. The numerinumeri-cal phase will use a CFD model (Solvent) [2] to study smoke ventilation in the tunnel. The ex-perimental phase will be used to calibrate and validate the CFD model and to establish the boundary conditions for the numerical model. Solvent was used to model a ventilation scenario using existing data. The current paper presents the initial efforts to validate the CFD model against onsite flow measurements conducted in the tunnel. The CFD model included aerody-namically significant physical features of the tunnel.
1.
INTRODUCTIONA road tunnel is an enclosed facility that carries motor vehicles underwater, through mountain, or in an urban region. Tunnels can be classified in different ways: according to their mode of trans-port, cross-section, length, ventilation, and pos-sible fire hazards. Tunnels can be also catego-rized in terms of the type of ventilation system: natural and mechanical (MVS). There are dif-ferent MVS layouts used in road tunnels, longi-tudinal, transverse, and semitransverse. The choice of what ventilation system to use depends on several parameters that include: tunnel length, cross section, and grade; surrounding environ-ment; traffic volume; and construction cost. Fires in tunnels pose major safety issues and challenges to the designer, especially with the increase in the number of tunnels, their length, and people using them. The main fire safety issues include: safe evacuation of people inside the tunnel, safe rescue operations, minimal ef-fects on the environment due to the release of toxic combustion gases, and minimal loss of property. The safety of tunnel users and rescuers is the main objective for the tunnel fire safety. Life can be threatened in a number of ways: as-phyxiation by the inhalation of smoke and fumes, poisoning by the inhalation of combus-tion products such as carbon monoxide and car-bon dioxide, generation of high temperatures and heat fluxes. Evacuation can be significantly af-fected due to poor visibility, power failure, blocked exits due to traffic jams or crashed vehi-cles, or obstruction resulting from collapse or explosion in the tunnel. Temperatures up to 1350oC and heat fluxes in excess of 300 kW/m2
can be generated within a few minutes of igni-tion in certain types of fires. For safe evacua-tion, acceptable visibility and air quality in the tunnel must be maintained.
From the beginning of a fire, the airflow in the tunnel is modified and becomes highly transient. The modifications are due to the fire itself, but also to the emergency ventilation operation, and the change in the traffic in the tunnel. The smoke progress and its degree of stratification depend mainly on the velocity field in the tunnel. With no air current in the fire zone, the smoke moves symmetrically on both sides of the fire [3]. The smoke remains stratified until it cools down due to the combined effects of the convec-tive heat exchange with the tunnel walls and the mixing between the smoke and the fresh air lay-er. The other parameters that affect the smoke flow [4] and stratification are: fire heat release rate, tunnel slope, and traffic flow.
In the event of a fire, the MVS system must pro-vide tunnel users with a safe egress route that is free of smoke and hot gases. In this case, tunnel operators must implement a plan of smoke clear-ing, which consists of selecting a sequence of fan operation with the objective of keeping the road upstream of the accident smoke free. This is done by limiting the upstream smoke flow and either venting it or letting it escape through the downstream portal. When the fire department arrives on the fire scene, the operator must coop-erate and modify, as needed, the fan operation in order to facilitate access to the site.
Establishing air requirements for the roadway tunnel and consequently the capacity of the ven-tilation system is challenging due to the diffi-culty of controlling many variables. Among those variables are the possibility of occurrence of various traffic patterns and situations during the lifetime of the facility. Methods of control-ling air contaminant and smoke from fire in a tunnel include longitudinal flow, extraction and dilution.
1.1 Tunnel MVS System Description
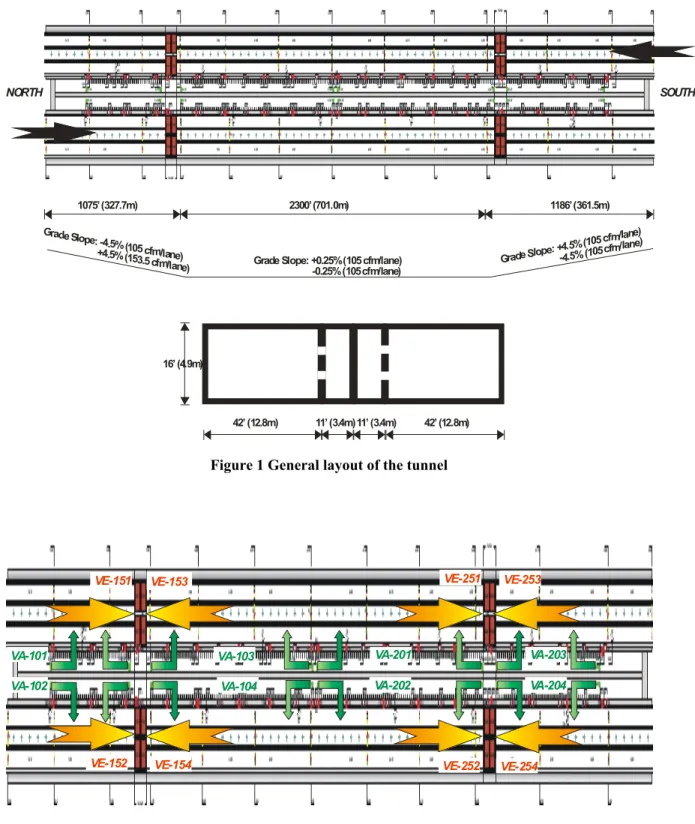
The tunnel being studied is 1.8 km in length and travels underwater in the North-South direction with three lanes, in each direction, inside two concrete tubes (Figure 1). A center section sepa-rates the two tubes. Two ventilation towers are located at the ends of the underwater section. The emergency ventilation system (Figure 2) of the tunnel is composed of 8 ceiling exhaust fans (4 fans for each roadway) and 8 fans that provide supply air through side vents uniformly distrib-uted along one wall for each roadway. The side vents are situated in two rows, upper and lower.
The lower and the upper rows are located at heights of 1.0 and 3.9 m above the tunnel floor and at intervals of approximately 6 m. All fans could operate in reverse mode. Therefore, fresh air may be supplied at either the ceiling (fans VE-151 through VE-254), or by fans VA-101 through VA-204 through the side vents. In the exhaust mode, fans VE-151 through VE-254 could operate at 30 or 60 Hz, and in the supply mode they could only operate at 60 Hz. In the supply mode, fans VA-101 through VA-204 could operate at: 30, 40, or 60 Hz. In the exhaust mode, these fans could only operate at 60 Hz.
1.2 CFD Model
SOLVENT was developed as a tunnel ventilation model that can simulate the interactive effects of a tunnel fire and the ventilation system to deter-mine the unsafe regions of the tunnel. The model is applicable to different ventilation modes, including longitudinal ventilation using jet fans, transverse ventilation, and natural venti-lation.
SOLVENT is based on the general-purpose CFD code COMPACT-3D [5]. It employs the buoy-ancy-augmented k-ε model [6] to represent the turbulent transport and includes component models for jet fans, ventilation ducts, fire, radia-tion heat transfer, and smoke. The SIMPLER algorithm is used to calculate the pressure field. The algebraic equations are solved using the line-by-line TriDiagonal-Matrix Algorithm sup-plemented by a block-correction procedure. The wall boundary is treated using the wall func-tion approach. Here, the fire is represented as a source of heat and mass. The model does not simulate the combustion process. Instead, the heat release rate due to combustion is prescribed as a volumetric heat source in a postulated fire region.
The boundary conditions at the tunnel portals can be specified as inflow/outflow boundaries or as "free" boundaries with known values of pres-sure, depending on the physical situation being modeled. At an inflow boundary, values of all variables are specified. At an outflow boundary, the diffusion flux is assumed to be zero and the normal velocity components are adjusted to en-sure the overall conservation of mass. The model also has provision for the introduction of entrance loss and differential pressures at the portals to represent wind effects.
1075’ (327.7m) 2300’ (701.0m) 1186’ (361.5m) Grade Slope: -4.5% (105 cfm/lan
e) +4.5% (153.5 cfm/la ne) Grade S lope: +4.5% (105 cfm/lane) -4.5% (105 cfm /lane)
Grade Slope: +0.25% (105 cfm/lane) -0.25% (105 cfm/lane)
SOUTH NORTH
42’ (12.8m) 11’ (3.4m)11’ (3.4m) 42’ (12.8m) 16’ (4.9m)
Tunnel L.-H.-LA Fontaine
Figure 1 General layout of the tunnel
VA-101 VA-103 VA-201 VA-203
VA-102 VA-104 VA-202 VA-204
VE-151 VE-152 VE-153 VE-154 VE-251 VE-252 VE-253 VE-254
2. A
IRFLOWM
EASUREMENTSTwo fire scenarios in the North Roadway of the tunnel were assumed for the ventilation tests: one located at mid-tunnel and the second close to ventilation fan VE-153 (Figure 2). For these fire locations, one emergency ventilation scenario (referred to in this paper as the “main scenario”) was activated which used the fans: VA-103 (sup-ply mode – 60 Hz), VA-201 (sup(sup-ply mode – 60 Hz), VE-151 (exhaust mode – 60 Hz), and VE-153 (exhaust mode – 60 Hz). After conduct-ing flow measurements of the main scenario, VE-251 fan was activated in the supply mode, in addition to the already-active fans of the main scenario (“secondary scenario”).
Airflow measurements, temperature and pressure difference (at side vents) were made for both the main and secondary scenarios at selected side vents (VA-101, VA-103, and VA-201), ceiling vents (VE-151, VE-153, VE-251, and VE-253) and at several tunnel cross-sections. Additional measurements were conducted using weather stations at the two portals, in the tunnel, and within the evacuation passage (VA-103 duct). Flow measurements were also conducted at a few locations across the tunnel for the secondary scenario. Air temperatures were used to compute air density.
Air velocities were measured at 9 points at the two portals and the middle of the tunnel. In or-der to determine the bulk flow at a given loca-tion, the cross-section was divided into 9 sub-areas associated with the 9 measurements points. The velocity of air at each point was considered to represent the entire sub-area. The bulk flow was then computed by multiplying the air veloc-ity by its corresponding sub-area and then adding the results for all sub-areas. A similar procedure was followed to determine flow quantities at the four exhaust fans and side vents. A summary of airflows in the tunnel for both the main and sec-ondary scenarios is shown in Figure 3 and Figure 4, respectively.
Air speed and temperature were measured using a vane anemometer. The meter uses a remote wheel that freely rotates in response to airflow and a built-in thermostat. The vane anemometer can measure air velocity and temperature in the range of 0.40 to 25 m/s and 0 to 60oC,
respec-tively, with resolutions of 0.1 m/s and 0.1oC.
The accuracies of measurements are ±2% for the velocity and ±0.8oC for the temperature. The
pressure difference was measured using a digital
micro manometer. The device is capable of measuring both air velocity (up to 100 m/s) and pressure difference (up to ±6000 Pa) with high resolution (0.1 m/s and 0.1 Pa).
2.1 Results
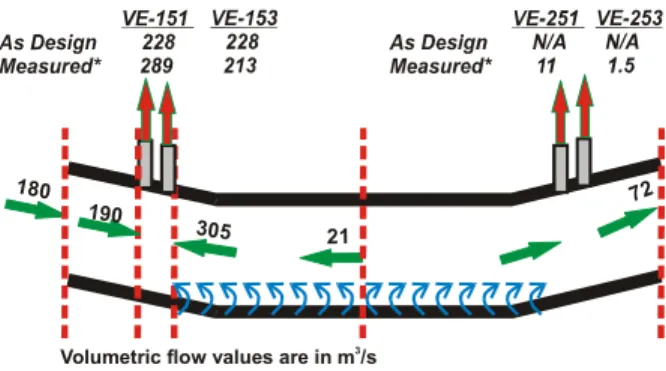
During cold smoke tests it was observed that the smoke clears efficiently when the smoke source was placed close to the exhaust fans VE-151 and VE-153. However, when the source was placed near the middle section of the tunnel, it took longer for the smoke to clear as a result of low airflow velocities in the middle section of the tunnel (Figure 3). 305 72 180 190 21
Volumetric flow values are in m /s 3
Figure 3 Flow distributions in the tunnel – main scenario
By activating the VE-251 fan in the supply mode, higher air velocities were recorded near the middle section of the tunnel (Figure 4). This in turn improved smoke clearance.
From Figure 3 and Figure 4 it can be noted that the airflow introduced at the side vents of fan VA-103, together with the air exhausted through the south portal, almost balanced the exhausted air at fans VE-151 and VE-153. This in turn increased the resistance for air to be drawn from the middle of the tunnel, causing lower airflow velocities at mid-tunnel and beyond. Even with the activation of fan VE-251 in supply mode (secondary scenario), the airflow was mainly directed to the north portal, resulting in little improvement in airflow velocities at the middle of the tunnel.
189 44
Volumetric flow values are in m /s 3
Figure 4 Flow distributions in the tunnel - secondary scenario
3. N
UMERICALS
IMULATIONS3.1 Geometry and Boundary
Condi-tions
Only the North Roadway of the tunnel was simu-lated with a mesh consisting of approximately 160,230 control volumes (Figure 5). The mesh was refined around the vents. Two simulations were conducted to represent the two ventilation scenarios, the main and secondary. Both simula-tions were conducted as a steady state simulation with constant air density (i.e., energy equation was not solved). Free boundaries with pressure equal to the static ambient pressure were as-sumed at the north and south portals. A wall roughness of 0.003 was assumed to represent the roughness of the concrete wall surface.
Figure 5 North Roadway discretization
3.2 Main Ventilation Scenario
Figure 6 shows the air supply (side walls) and exhaust (tunnel ceiling) boundary conditions of the main scenario.
The behaviour of the airflow in the tunnel plays a major role in determining the longitudinal air velocity and consequently the ability of a ventila-tion configuraventila-tion to clear the smoke and fire products.
Figure 6 Main scenario air supply and ex-haust
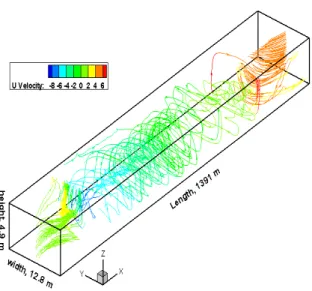
Figure 7 represents the general flow pattern in the tunnel upon activating this scenario. The airflow pattern is represented by streamlines of the velocity vector field. Different colors repre-sent different velocity magnitudes. From Figure 7, it is observed that the air supplied through the lower and upper side vents created regions of turbulent flows. Furthermore, the air from the larger size upper vents is faster than that from the lower vents, which resulted in higher air jets injected at the top of the tunnel. Those air jets forced airflow downwards and created rotational movement of the air. As a result, only small portions of the tunnel had a longitudinal flow, near the two portals. These results are in agree-ment with the field observations of low longitu-dinal air velocities in the middle section of the tunnel observed during the cold smoke tests.
Figure 7 Main scenario airflow pattern
Figure 8 shows the longitudinal velocity profile of a section at the middle of the tunnel. It shows a stagnant flow zone at the middle of the tunnel. Figure 9 presents the bulk flow for cross sections along the tunnel length. The values of mass flow compared reasonably with the field measured data.
Figure 8 Main scenario longitudinal air veloc-ity
As mentioned earlier, the main goal of the emer-gency ventilation system is to provide and main-tain a smoke-free path for safe evacuation. This tunnel uses the central section that separates the two tubes for evacuation purposes during the event of a fire. It is important, therefore, to
maintain a differential pressure between the tun-nel environment and the evacuation passage that will ensure a “smoke-free” escape route. Thus, the pressure inside the ventilation duct should be always larger than that in the tunnel to force air-flow from the duct into the tunnel.
Bulk Flow -400 -300 -200 -100 0 100 200 300 0 200 400 600 800 1000 1200 1400 Longitudinal Distance (m) M a s s Fl ow ( k g/ s ) -5.0 -4.0 -3.0 -2.0 -1.0 0.0 1.0 2.0 3.0 4.0 V e loc it y ( m /s ) Mass Flow (kg/s) Velocity (m/s)
Figure 9 Main scenario bulk flow The airflow parameters were measured inside ventilation duct VA-103. The air speed was 14.5 m/s indicating a dynamic pressure of about 131 Pa. Figure 10 shows a typical pressure field across the tunnel indicating that most of the tun-nel was at a negative pressure except for a small region near the middle of the tunnel where small positive pressure values prevail. Under these conditions, it is expected that most parts of the evacuation path would be smoke free.
3.3 Secondary Ventilation Scenario
Figure 11 shows the airflow pattern under the secondary ventilation scenario. With the activa-tion of ventilaactiva-tion fan VE-251 in supply mode, there was minimal modification to the flow field in the tunnel. However, in agreement with the field measurements, the conditions at the middle of the tunnel were improved (Figure 12). Most of the flow supplied by VE-251 was directed towards the south portal due to the relatively high positive pressure produced by fan VE-251 (Figure 13) that creates resistance to the flow at the middle of the tunnel.
Figure 14 presents the bulk flow for cross sec-tions along the tunnel length. Again, the values of mass flow compared reasonably with the field-measured data. Figure 14 shows that, with fan VE-251 operating the location of zero point velocity moved in the direction opposite to the airflow direction from the fan.
Figure 11 Secondary scenario airflow pattern
4. C
ONCLUSIONSThe numerical simulations agree with the field measurements in indicating that the current ven-tilation strategies for the event where the fire is located at or near the middle of the tunnel poses a challenge for smoke clearance. In the cases where the fire occurs at other locations, it is be-lieved that the current ventilation strategies are sufficient.
Figure 12 Secondary scenario longitudinal air velocity
Figure 13 Secondary scenario pressure field
Bulk Flow -500 -400 -300 -200 -100 0 100 200 300 400 500 0 200 400 600 800 1000 1200 1400 Longitudinal Distance (m) M a s s Flo w ( k g/s ) -8.00 -6.00 -4.00 -2.00 0.00 2.00 4.00 6.00 Ve lo c ity (m /s ) Mass Flow (kg/s) Velocity (m/s)
No smoke was observed within the two ducts of ventilation fans VA-103 and VA-201 during the field measurements. This was confirmed from the numerical simulation by examining the pres-sure field in the tunnel. However, this does not reflect the actual situation of a fire incident where the smoke and fire effluents are hot and buoyant and therefore will produce different dy-namics.
The VA ventilation fans have the flexibility to operate with different cycles; 30, 40 or 60 Hz and therefore they could discharge airflow over a wide range. The upper side vents could be use-ful in extracting smoke from the upper layer if the VA fans were operated in exhaust mode. However, in this scenario the ventilation ducts could not be used for evacuation purposes. Fur-ther investigation, using the numerical modeling, will be useful in determining the best use of the side vents to achieve both a “smoke-free” escape route and minimal air disturbance throughout the tunnel.
The air velocity in the evacuation passage was 14 m/s was (with VA-103 at maximum capac-ity). It might be difficult to walk against such a high-speed airflow during the evacuation. An airflow velocity of 8 m/s is deemed appropriate for people walking in the passage [7].
5. R
EFERENCES1. NFPA 502, “Standard for Road Tunnels, Bridges, and Other Limited Access High-ways”, 2001 Edition, NFPA, 1 Batterymarch Park, PO Box 9101, Quincy, MA 02269-9101, USA.
2. Innovative Research, Inc./Parsons Brinker-hoff, Inc., “Solvent Version 1.0”, Innovative Research, Inc./Parsons Brinkerhoff, Inc., 2000.
3. Lacroix D., “The New PIARC Report on Fire and Smoke Control in Road Tunnels”, Third International Conference on Safety in Road and Rail Tunnels, Nice, France, p. 185-97, 1998.
4. Heselden, A J M. "Studies of fire and smoke behaviour relevant to tunnels". In: Proc. Second International Symposium on the Aerodynamics and Ventilation of Vehicle Tunnels, Cambridge, BHRA, paper J1, 1976.
5. Innovative Research, “Reference Manual for COMPACT-3D”, Innovative Research, Inc., Minneapolis, 1998.
6. Wilcox, D.C., Turbulence Modeling of CFD, DCW Industries, Inc., California 91011, 1993.
7. Cheung, Emil, Chan, Wilson, and Man, Richard, “Ventilation Scheme using Sac-cardo Nozzles”, Tunnel Management Inter-national, 5th International Conference, Safety
in Road and Rail Tunnels, Volume 6, Num-ber 1, 2003.