Publisher’s version / Version de l'éditeur:
Vous avez des questions? Nous pouvons vous aider. Pour communiquer directement avec un auteur, consultez la Questions? Contact the NRC Publications Archive team at
PublicationsArchive-ArchivesPublications@nrc-cnrc.gc.ca. If you wish to email the authors directly, please see the first page of the publication for their contact information.
https://publications-cnrc.canada.ca/fra/droits
L’accès à ce site Web et l’utilisation de son contenu sont assujettis aux conditions présentées dans le site LISEZ CES CONDITIONS ATTENTIVEMENT AVANT D’UTILISER CE SITE WEB.
Laboratory Memorandum (National Research Council of Canada. Institute for Ocean Technology); no. LM-2005-13, 2005
READ THESE TERMS AND CONDITIONS CAREFULLY BEFORE USING THIS WEBSITE.
https://nrc-publications.canada.ca/eng/copyright
NRC Publications Archive Record / Notice des Archives des publications du CNRC : https://nrc-publications.canada.ca/eng/view/object/?id=3e8b85c7-7e68-40d2-ae8a-f9b96cf2995d https://publications-cnrc.canada.ca/fra/voir/objet/?id=3e8b85c7-7e68-40d2-ae8a-f9b96cf2995d
For the publisher’s version, please access the DOI link below./ Pour consulter la version de l’éditeur, utilisez le lien DOI ci-dessous.
https://doi.org/10.4224/8895769
Access and use of this website and the material on it are subject to the Terms and Conditions set forth at Comparison of Neptune and datawell directional wave buoy data acquired Fall 2004
Laboratory Memorandum
LM-2005-13
Comparison of Neptune and Datawell Directional Wave
Buoy Data Acquired Fall 2004
D. Cumming
August 2005
LM-2005-13 August 2005 REPORT SECURITY CLASSIFICATION
Unclassified
DISTRIBUTION Unlimited TITLE
COMPARISON OF NEPTUNE AND DATAWELL DIRECTIONAL WAVE BUOY DATA ACQUIRED FALL 2004
AUTHOR(S) D. Cumming
CORPORATE AUTHOR(S)/PERFORMING AGENCY(S)
Institute for Ocean Technology (IOT), Memorial University of Newfoundland (MUN) PUBLICATION
N/A
SPONSORING AGENCY(S)
IOT, MUN, Marine Institute, SafetyNet, Canadian Institutes of Health and Research (CIHR), Search and Rescue (SAR) – New Initiatives Fund (NIF)
IOT PROJECT NUMBER 42_2017_26
NRC FILE NUMBER KEY WORDS
Directional wave buoys
PAGES vi, 12 App. A, B FIGS. 13 TABLES 2 SUMMARY
This report provides a comparison of directional wave data acquired from a Neptune Sciences, Inc. Sentry Wave Buoy and a Datawell Waverider Mark II Wave Buoy moored off St. John’s, NL during three fishing vessel seakeeping trials carried out in the fall of 2004. The two directional wave buoys along with their moorings are described in detail; the wave statistics are compiled and overall performance of the buoys compared.
ADDRESS National Research Council Institute for Ocean Technology Arctic Avenue, P. O. Box 12093 St. John's, NL A1B 3T5
Technology océaniques
COMPARISON OF NEPTUNE AND DATAWELL DIRECTIONAL WAVE
BUOY DATA ACQUIRED FALL 2004
LM-2005-13
D. Cumming
TABLE OF CONTENTS List of Tables ... iv List of Figures ... iv List of Abbreviations ...v 1.0 INTRODUCTION ... 1 2.0 BACKGROUND ... 1
3.0 DIRECTIONAL WAVE BUOY/MOORING ARRANGEMENT DESCRIPTION ... 1
3.1 Neptune Sciences, Inc. Sentry Wave Buoy ... 1
3.2 Datawell Waverider Mark II Wave Buoy... 3
3.3 Additional Wave Buoy Deployment Information... 4
4.0 WAVE DATA ANALYSIS PROCEDURE... 4
4.1 Neptune Sciences, Inc. Sentry Wave Buoy ... 4
4.2 Datawell Waverider Mark II Wave Buoy... 6
4.3 Wave Buoy Data Comparison Analysis ... 6
5.0 OVERVIEW OF SEA CONDITIONS ... 7
6.0 DISCUSSION OF CORRELATION RESULTS ... 8
7.0 CONCLUSIONS AND RECOMMENDATIONS ... 10
8.0 ACKNOWLEDGEMENTS... 11
9.0 REFERENCES ... 11 APPENDIX A: Neptune Directional Wave Buoy Description
LIST OF TABLES
Table
Wave Buoy Comparative Statistical Data...1 Summary of Ship Drift Information ...2
LIST OF FIGURES
Figure
Photograph of Neptune Directional Wave Buoy ...1 Photograph of Datawell Directional Wave Buoy & Anchor ...2 Comparative Plots of Measured Significant Wave Height ...3, 4 Comparative Plots of Average Wave Period ...5, 6 Comparative Plot of Direction of Maximum Wave Energy ...7 Comparative Energy Spectra Plots ...8 – 10 Energy Spectrum from November 1, 2004 ...11 Diagram of Manufacturer Recommended Shallow Water Mooring – Neptune Buoy ...12 Photograph of TRIAXYSTM Directional Wave Buoy ...13
LIST OF ABBREVIATIONS
cm centimeter(s)
dia. diameter
deg. degree(s)
Dir Max maximum wave direction
FFT Fast Fourier Transform
Hs, Hm0 significant wave height
Hz Hertz
IOT Institute for Ocean Technology
kg kilogram(s)
lb. pound(s)
m metre(s)
MHz MegaHertz
MUN Memorial University of Newfoundland
M/V Motor Vessel
mW milliwatt(s)
NGDC National Geophysical Data Center (United States)
nm nautical mile(s)
NOAA National Oceanic & Atmospheric Administration (United States)
NRC National Research Council
NSERC Natural Sciences and Engineering Research Council
RF radio frequency
LIST OF ABBREVIATIONS (Cont’d)
SWH Significant Wave Height
Tav, Tavg average wave period
TZ mean wave period
UHF Ultra High Frequency
USDA – ARS United States Department of Agriculture – Agricultural Research Service
COMPARISON OF NEPTUNE AND DATAWELL DIRECTIONAL WAVE BUOY DATA ACQUIRED FALL 2004
1.0 INTRODUCTION
This report provides a comparison of directional wave data acquired from a Neptune Sciences, Inc. Sentry Wave Buoy and a Datawell Waverider Mark II Wave Buoy moored off St. John’s, NL during three fishing vessel seakeeping trials carried out in the fall of 2004. The two directional wave buoys along with their moorings are described in detail; the wave statistics are compiled and overall performance of the buoys compared.
2.0 BACKGROUND
During the fall of 2004, three seakeeping trials (References 1 to 3) were carried out in support of the Fishing Vessel Safety Project – an initiative to understand and mitigate the health and safety risks associated with employment in the seafood harvesting industry. Two directional wave buoys were moored in nominally 165 m water depth, 0.5 to 1.5 nm apart, and approximately 10 nm east of St. John’s. The Neptune Sciences, Inc. wave buoy is owned by Memorial University of Newfoundland (MUN) with a mooring designed by staff at the MUN Physical Oceanography Group. The Neptune buoy was deployed from the subject trial ship only for the time period of the given sea trial. The Datawell wave buoy was leased from Oceans Ltd. of St. John’s with a mooring designed by Oceans Ltd. staff. This buoy was deployed using the Marine Institute training vessel M/V Louis M. Lauzier October 8, 2004 and remained moored until completion of all the sea trials.
There was a significant difference in the directional wave data acquired by these two buoys. The Neptune buoy was procured by MUN specifically because of its light weight, low cost and ease of launch/recovery from small fishing vessels with limited deck
handling facilities. The Datawell buoy was a larger, heavier wave buoy designed for open ocean oceanography applications. The nature of the acquired data discrepancies will be investigated with recommendations made regarding improved future wave measurement capability.
3.0 DIRECTIONAL WAVE BUOY/MOORING ARRANGEMENT
DESCRIPTION
A description of the wave buoys and mooring arrangement are provided as follows:
3.1 Neptune Sciences, Inc. Sentry Wave Buoy
A small (0.75 m diameter, 15.7 kg) discus shaped directional wave buoy manufactured by Neptune Sciences, Inc. of Slidell, Louisiana and procured by MUN for previous sea trials
using NSERC funding was used to acquire information on the wave conditions during the seakeeping trials (Figure 1). On the day of the trial, the buoy was deployed manually by lifting it over the side of the subject trials ship. Retrieval was accomplished at the end of the trial using the fishing vessel’s crab pot hauler.
The wave buoy was configured to acquire data for 17.07 minutes (1,024 s) output on local Newfoundland time every half hour, process and store the data in an ASCII format file on an internal non-volatile flash disk. A radio modem was used to communicate between a base station on the subject trials ship and the buoy over line of sight range using a spread spectrum device operating in the UHF 902-928 MHz frequency band. The buoy assembly is composed of the following components:
• Instrument Housing: composed of a sealed aluminium cylinder with connections for the antenna and on/off plug on top. The housing contains the instrumentation
package, onboard computer and onboard radio modem. All components of motion required to transform the buoy-fixed accelerations into an earth-fixed co-ordinate system (vertical, east-west and north-south) are measured using sensors mounted in the instrument package. Earth-fixed accelerations enable determination of non-directional wave information (wave heights, periods, and non-non-directional spectra) as well as directional wave information (wave directions and directional spectra) with all required computations executed within the onboard computer.
• Battery Housing: comprises a smaller sealed aluminium cylinder fitted below the instrument housing and contains the battery pack composed of 27 disposable D-cell alkaline batteries providing a 1 to 2 week lifetime with the buoy configured for data collection every ½ hour.
• Floatation Assembly: a rugged urethane foam and aluminium cage designed to provide the appropriate buoyancy for the instrument and battery housing. The floatation assembly was designed such that the instrument and battery housing combination can be removed and replaced without disturbing the mooring or recovering the entire system.
• Ship Based Modem: An RF modem with dedicated power supply and antenna is used to communicate from a ship based laptop computer to the wave buoy. A dedicated, windows based, user friendly software package is supplied by the buoy manufacturer to facilitate the communication between the ship board computer and the wave buoy. The data can also be retrieved using an umbilical connection to the buoy after the buoy has been recovered.
• Mooring Assembly: a mooring system for the wave buoy was designed for a 165 m depth of water by personnel from the MUN Physical Oceanography Group after discussions with the buoy manufacturer. The mooring is described as follows: • Neptune Wave Buoy with floating tether
• ½” (1.27 cm) stainless steel shackle and swivel
• 55 meters of ¼” (0.635 cm) jacketed wire rope and shackles • 183 meters 9/16” (1.4287 cm) polypropylene rope
• 10’ (3.5 m) ½” (1.27 cm) galvanized chain • 40 lb. (18.14 kg) Danforth® anchor
Information on the Neptune directional wave buoy, including a typical output file, is provided in Appendix A. Additional information is provided in Reference 4.
3.2 Datawell Waverider Mark II Wave Buoy
The Neptune wave buoy proved to be unreliable during sea trials carried out in the fall of 2003. To ensure acquisition of the required directional wave data, a 0.9 m diameter Datawell Waverider Mark II wave buoy manufactured by Datawell b.v. of the
Netherlands was leased from Oceans Ltd. of St. John’s, NL. Oceans Ltd. was responsible for providing the buoy and mooring, supervising its launch/recovery from M/V Louis M. Lauzier, as well as acquiring the data and generating a final data product.
The buoy was deployed in 163 m of water in position 47 34.126 N, 52 26.154 W – about 10 nm east of St. John’s. Directional wave data was computed every half hour (on UTC) and transmitted to the base station at a frequency of 29.760 MHz with an output power of 150 – 200 mW. The high visibility yellow (Figure 2) buoy includes a flashing light that flashes 5 times every 20 seconds. The single point mooring provided by Oceans Ltd. was designed to ensure sufficient symmetrical horizontal buoy response with low stiffness permitting the buoy to follow waves up to a wave height of 40 m with a resolution of 1 cm, and wave periods between 1.6 and 30 s. The wave direction resolution was 1.5º while the wave frequency resolution was 0.005 Hz for frequencies less than 0.1 Hz and 0.01 Hz otherwise. The 212 kg buoy was anchored using two railway train wheels (Figure 2) weighing a total of 1400 lbs. (635 kg). The buoy was moored for the duration of the trials period (approximately 2 months).
The following sensors/equipment was included in the wave buoy: • Hippy-40 pitch angle/roll angle/heave displacement • Three axis flux gate compass
• Two fixed X and Y linear accelerometers • Sea temperature sensor
• Micro-processor
The receiving system was installed ashore at the Oceans Ltd. office in St. John’s and consisted of a passive 3 m long (Kathrein) whip antenna with base. A dedicated computer was interfaced to the wave direction receiver for storing and displaying the acquired wave data. The receiver was set up to receive at 38.760 MHz (a higher
frequency than being transmitted by the buoy). The base station was only monitored on the days when sea trials occurred. The specifications for the buoy, the mooring
information on the buoy can be obtained from the Datawell b.v. web site (Reference 5) and user’s manual that includes a description of the data file format provided by Oceans Ltd. (Reference 6).
3.3 Additional Wave Buoy Deployment Information
The distance between wave buoy moorings is provided as follows:
Ship Date Wave
Buoy
Position (Lat/Long) Distance
(nm)
‘Miss Jacqueline IV’ Oct. 17/18, 2004
Datawell 47 34.126N 52 26.154W
Neptune 47 33.713N 52 25.697W 0.515 ‘Nautical Twilight’ Nov. 1, 2004 Datawell 47 34.126N 52 26.154W
Neptune 47 32.800N 52 26.199W 1.326 ‘Roberts Sisters II’ Nov. 15, 2004 Datawell 47 34.126N 52 26.154W
Neptune 47 33.700N 52 26.183W 0.4265 The distance between the buoys was computed using the web site utility presented in Reference 7.
The magnetic declination for each trial is provided as follows:
Ship Date Position (Lat/Long) Declination
‘Miss Jacqueline IV’ Oct. 17, 2004 47 34 8 N 52 26 9 W 20º 37’ W ‘Nautical Twilight’ Nov. 1, 2004 47 34 8 N 52 26 9 W 20º 37’ W ‘Roberts Sisters II’ Nov. 15, 2004 47 34 8 N 52 26 9 W 20º 36’ W The magnetic declination for each time/location was computed using the web site utility presented in Reference 8. The magnetic declination for this location changes by 0° 12’ E/year.
4.0 WAVE DATA ANALYSIS PROCEDURE
The analysis of the wave height and direction information is described as follows:
4.1 Neptune Sciences, Inc. Sentry Wave Buoy
Directional wave data is calculated from the motion of the buoy whereby these motions, recorded by onboard sensors for angular and vertical accelerations, accurately mimic the attitude of the ocean due to its discus shaped floatation device. The recordings are then analyzed using spectral analysis to provide directional and nondirectional wave spectra. A directional wave spectrum describes the distribution of wave energy as a function of both frequency and direction, whereas the nondirectional wave spectrum is a function of frequency only.
More precisely, as a definition:
Nondirectional Wave Spectrum (C11): is a one dimensional wave energy density that has its greatest value at the frequency where the nondirectional wave energy density is greatest.
This nondirectional wave spectrum is then used for computing wave energy where: S(f,α) = C11(f) * D(f, α)
By which, D is a directional spreading function with a dependency on both frequency f and direction α. S is a two dimensional wave energy density that has its greatest value at the frequency and direction where the directional wave energy is greatest. D(f, α) may be expanded in an infinite Fourier Series as a function of wave direction α. An
approximation of the D(f, α) may be provided by computing the first two terms: D(f, α) ≈ [1/π] * [(1/2) + r1 * cos(α – α1) + r2 * cos(2 * (α – α2))]
Where: alpha1 (α1) – mean wave direction alpha2 (α2) – principal wave direction
r1 , r2 – frequency dependent parameters that theoretically lie between zero and one.
The following is a list of definitions needed to fully analyze wave data:
Significant Wave Height: Average height from wave crest to trough of the one-third
highest waves measured. It is assumed that the nondirectional spectrum is relatively narrow and thus significant wave height is computed as:
Significant Wave Height = Hm0 = 4 m01/2,
Where, m0 is the area under the nondirectional wave spectrum C11. Dominant Wave Period/Frequency (Peak Wave Period/Frequency): is the
period/frequency associated with center frequency of the frequency band that has the largest (peak) energy density in the nondirectional spectrum (C11).
Average Wave Period/Frequency: The average wave period is computed from the
spectral moments as follows:
Tav = m0/m1 and fav = 1/Tav where:
“m1” – the first moment of area under the nondirectional wave spectrum C11. Dominant Wave Direction: the value of α1 for the frequency band where the largest value of C11 occurs.
Average Wave Direction: is the weighted average over all frequency bands. This wave
direction is the energy density weighted vector average of α1 over all frequency bands and is computed from:
Average wave direction = tan-1 (Y, X) Where: Y = Σ [C11(f) * sin(α1(f))]
X = Σ [C11(f) * cos(α1(f))]
Note that within the wave buoy, sea direction is measured using a flux gate compass and thus the data is generated in degrees magnetic. The magnetic deviation for St. John’s approaches during the trials period was ~20.6 degrees West and this correction was applied to derive wave direction in degrees TRUE.
4.2 Datawell Waverider Mark II Wave Buoy
Oceans Ltd. carried out the wave analysis using standard software provided by the manufacturer of the buoy. The data was processed on the buoy and both raw and processed data then transmitted to the receiver on shore.
From the accelerations measured in the X and Y directions in the moving buoy reference frame, the accelerations along the fixed north and west axes are calculated. All three accelerations (vertical, north and west) are then digitally integrated to displacements and filtered to a high frequency cut off (0.6 Hz). Finally, an FFT is performed on the data. Raw data are compressed to motion vertical, motion north and motion west. Energy density, main sea direction, directional spreading angle and the normalized second harmonic of the directional distribution for each frequency band are computed on-board the wave buoy in addition to other standard sea state parameters such as significant wave height (SWH), Hm0 and mean wave period TZ.
Note that within the wave buoy, sea direction is measured using a flux gate compass and thus the data is generated in degrees magnetic. The magnetic deviation for St. John’s approaches during the trials period was ~20.6 degrees West and this correction was applied to derive wave direction in degrees TRUE.
4.3 Wave Buoy Data Comparison Analysis
The following data analysis was carried out to compare the directional wave data acquired by the two buoys:
A summary of the statistical data acquired during all sea trials carried out in the fall of 2004 is compiled in Table 1. Note that since the Datawell acquired data on a UTC time base, the times had to be adjusted to compare with the Neptune data acquired on local NF time. The acquired Datawell data was 2.5 hours ahead of NF time for the ‘Miss
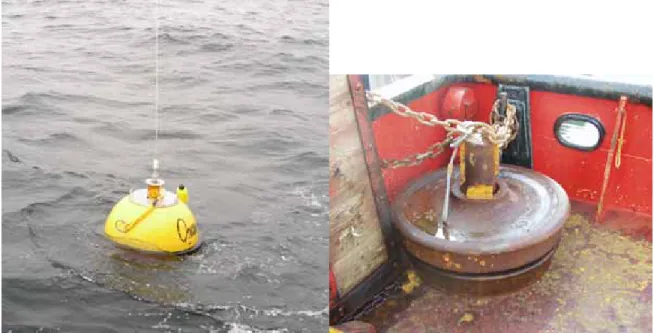
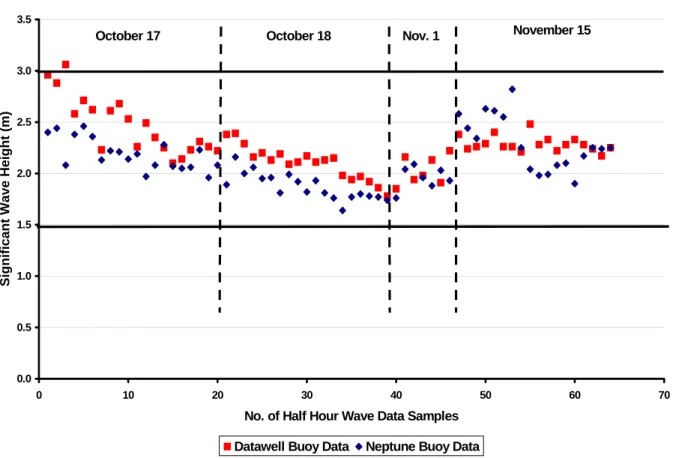
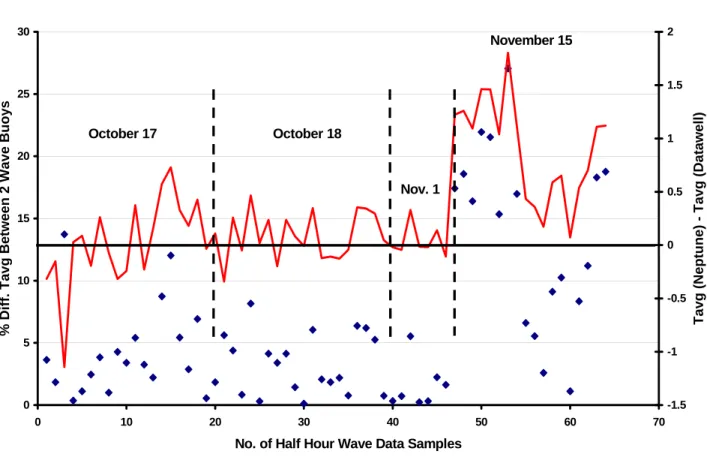
trials. Both buoys were configured to output a data file every half hour. A total of 64 half hour data segments are available for comparison over the fall 2004 trials period. Table 1 includes Significant Wave Height (Hs), Average Wave Period (Tavg) as well as the wave direction (direction the wave is coming from) for the frequency band with the maximum wave energy – corrected to degrees TRUE using the common value of magnetic declination of 20.6 degrees. To compare the output from the wave buoys, the percent and actual difference between the Significant Wave Height and Average Wave Period are provided for each half hour time period. Comparative plots of Significant Wave Height are provided in Figures 3 and 4. Comparative plots of Average Wave Period are given in Figures 5 and 6. A comparison of the direction of maximum wave energy is illustrated in Figure 7.
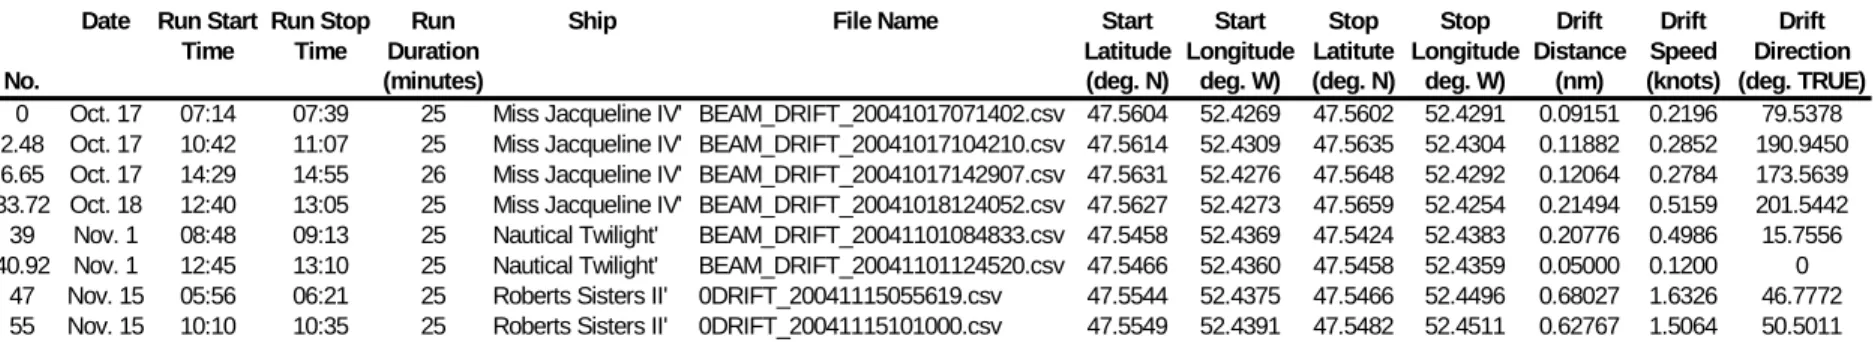
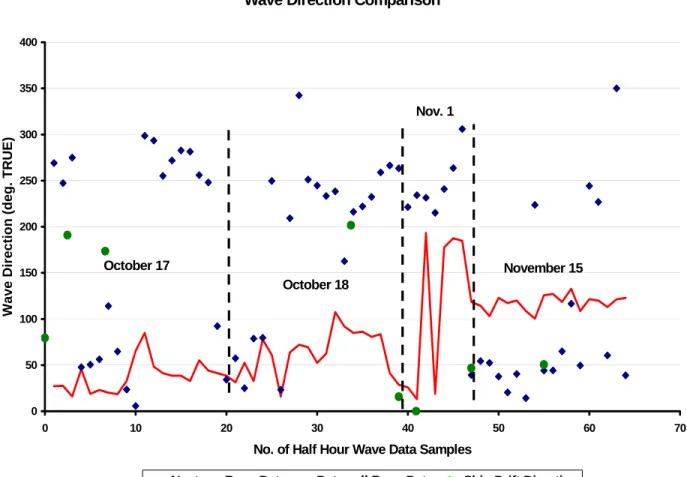
An attempt to determine any influence of ambient surface current on the output from the wave buoys was carried out by analyzing the data from several ship zero speed drift runs. This is only a rough evaluation since a ship drifts under the influence of wind, waves and current and there is no means of isolating the impact on ship drift of each component. The results of this analysis are summarized in Table 2. Since the position (latitude, longitude) of the vessels were known at the start and end of each nominally 25 minute long run, the distance the vessels drifted over the course of the run could be computed using a web site utility (Reference 7). Since the vessels were drifting very slowly, the time varying GPS data could not be used to determine drift speed and course due to excessive scatter in the data. The direction of drift was determined from the start and end position points using the web site utility provided in Reference 9. The ship drift direction (direction drift forces coming from) is superimposed on the maximum wave energy plot (Figure 7).
Example comparative energy spectra output by each buoy are provided in Figures 8 to 10 to illustrate any frequency domain differences. The period and magnitude of the spectral peak as derived by each buoy is denoted on the plots.
5.0 OVERVIEW OF SEA CONDITIONS
To meet the goals of the Fishing Vessel Safety Project, the target sea state for all sea trials was Sea State 2 to 3. The seas were generally confused for all the trials due to the influence of time varying wind, current and reflection off the nearby land mass. CCGA Miss Jacqueline IV Trial – October 17, 18, 2004: The Neptune buoy remained deployed for two days and the sea conditions were fairly stable over this period. The significant wave height slowly declined from 3 m to just below 2 m and the average wave period declined from 9 s to 5.5 s. The direction of maximum wave energy slowly
increased from ~ 25 degrees TRUE to 75 degrees TRUE. The ship drift speed during this period was low – between 0.2 to 0.3 knots.
CCGA Nautical Twilight Trial – November 1, 2004: The wave spectra for this trial included of two distinct peaks – a declining low frequency swell (a legacy of a severe
storm that lasted several days – ending a few days before the trial) from ~ 20 degrees TRUE and an increasing high frequency wind generated wave from due south (see example wave spectrum in Figure 11). The dominant wave changed from being defined as the low frequency wave in the morning, a period where the dominant wave oscillated between the two components around mid-day to the high frequency component in the afternoon. The significant wave height increased from 2 to 2.5 m and average wave period increased from 6 s to just below 7 s over the day.
CCGA Roberts Sisters II Trial – November 15, 2004: The significant wave height was a fairly constant 2 to 2.5 m and the average wave period declined steadily from 7 to 6 s. There was a very strong current, estimated by the ship’s Captain at 4 to 5 knots, prevalent at the start of the day that slowly declined as the day progressed resulting in ship drift speeds of about 1.5 knots. This exceptionally strong current was expected to have a negative impact on the wave buoys measurement capability – especially the small Neptune buoy.
6.0 DISCUSSION OF CORRELATION RESULTS
After reviewing the insight provided in the plots and tables compiled for the fall 2004 trials period, the following comments are listed:
• The significant wave height conformed to a narrow band from 1.5 to 3 m with a generally higher wave height being reported by the Datawell buoy with the exception of the early morning hours of November 15th where the Neptune buoy reported higher waves during the very high current conditions prevalent on that day. The difference between the significant wave heights reported by both buoys varied from 0 to 32% (~1 m) with an average difference of 10.06%.
• The average wave period varied from 5 to 9 seconds with good correlation noted with the exception of the November 15th trial in exceptionally high current conditions where the Neptune buoy reported a significantly higher wave period than the Datawell buoy. The difference between the average wave periods reported by both buoys varied from 0 to 27% higher (1.8 s) with an average difference of 6.36%. If the November 15th data was excluded, the average difference drops to 3.48%.
• There was very little correlation in the directions of maximum wave energy between the two buoys. The Datawell buoy wave direction was fairly stable with the exception of November 1st where the dominant direction oscillated between two distinct wave components emanating from almost opposite directions. Much scatter in the Neptune wave direction was noted throughout the fall. The Neptune wave direction appears to correlate well with ship drift direction on November 15th possibly implying a significant impact of ambient current on the buoy wave direction output.
• There was generally good correlation in the frequency domain data although it was noted that the disposition of the spectral peaks during the bi-directional wave conditions experienced during the ‘Nautical Twilight’ trial on November 1st could be significantly different.
An attempt was made to quantify the data scatter over the fall trials period by computing the standard deviation for the primary wave parameters:
Neptune Buoy Datawell Buoy
Significant Wave Height (Hs) 0.263679 0.268446
Average Wave Period (Tavg) 0.862171 0.754403
Direction of Max. Wave Energy 105.5968 46.94767
There is very little difference in the scatter between the two buoys noted for significant wave height, slightly higher scatter noted for the Neptune buoy for average wave period and more than twice the scatter noted for direction of maximum wave energy for the Neptune buoy. If the November 15th data is excluded from the data set:
Neptune Buoy Datawell Buoy
Significant Wave Height (Hs) 0.202445 0.293426
Average Wave Period (Tavg) 0.717563 0.82212
Direction of Max. Wave Energy 97.9036 45.89849
The Neptune buoy provides less scatter in the data for both significant wave height as well as average wave period however the scatter in wave direction remains over double that of the Datawell buoy.
The Datawell family of wave buoys are widely accepted as international standards and are relied on for quality wave environment data by many private and government organizations all over the world. Datawell buoys are often used as a standard when testing new wave measurement techniques (example: Reference 10). Users have reported a few problems with the Datawell moorings – complications recovering the buoy in high current conditions and biofouling of the buoy due to barnacle growth (Reference 11). Oceans Ltd. has owned and used their wave buoy for many years and have extensive experience in deploying the buoy in a harsh North Atlantic environment. The mooring included a sub-surface buoy for surge protection and Oceans Ltd. staff were confident that, based on their experience, the Datawell buoy would perform satisfactorily over the expected wave height range in ambient current conditions up to 6 knots.
There is very little information in the literature pertaining to operational experience with the Neptune buoy. No information could be found comparing the output of the Neptune buoy to a recognized standard. The buoy was originally designed for shallow, short term deployment in support of military amphibious landings. Its light weight and small size (15.7 kg, 0.75 m diameter) made it attractive for launching/recovery from small fishing vessels with limited deck equipment however it seems possible that it is not suitable for deep water deployment. The buoy supplier could not provide much input into mooring design for a water depth of 165 m implying that perhaps no one had attempted a
deployment of this buoy in these conditions. The manufacturer could only supply an example mooring for a water depth of 10 m (Figure 12) and shallow water mooring
seemed to be the norm. Also noted was that the Neptune buoy only had a wave measurement range of 0 to 9 m as opposed to ± 20 m for the Datawell buoy.
The comparison between the output from the two wave buoys in terms of wave height and period is fairly good. Some difference can be expected between any two wave buoys moored in a confused sea 0.5 to 1.5 nm apart in a water depth of 165 m. The generally lower wave height as measured by the Neptune buoy could imply that there is too much tension on the mooring attached to the bottom of the buoy. It may also reflect the difference in how the wave statistics are computed.
It was noted that the wave frequency resolution for the Datawell buoy was 0.005 Hz from 0.025 Hz to 0.095 Hz and 0.01 Hz from 0.1 Hz to 0.58 Hz as opposed to 0.011 Hz for the Neptune buoy throughout the frequency range from 0.081 to 0.5 Hz. The greater
resolution for the Datawell buoy will result in a better definition of the spectrum, identification of the band with the maximum energy. The significant scatter in the Neptune wave direction data is a concern however. Reviewing the data from November 15th when there was a high ambient current implies that the output from the buoy may also be negatively affected by ambient current conditions.
7.0 CONCLUSIONS AND RECOMMENDATIONS
Conclusions from the investigation into the performance of the two directional wave buoys are:
1) There was generally a satisfactory comparison of wave height and period
although the generally lower wave heights reported using the Neptune buoy may imply a mooring tension that was too high.
2) There was unacceptable wave direction scatter evident in the Neptune buoy data compared to the Datawell data.
3) Although generally good correlation in the frequency domain was noted, there was evidence in the data that the buoys could provide a confusingly different wave environment description in a bi-polar sea.
4) There was evidence in the data that the Neptune buoy mooring was not capable of providing accurate data in a high current environment.
A review of the Neptune mooring by Craig Kirby, an experienced IOT Technical Officer with expertise in this area, is provided as follows (from Reference 12):
“The only major deficiency in the MUN mooring design as I see, & as you mention, is the absence of the subsurface floatation. Without this floatation, the buoy has to support the complete mooring (in water) weight. I think this may have a negative effect on the surge acceleration & response rate of the buoy effectively 'clipping' the wave heights. The addition of a subsurface float (as in the Datawell design) spec'd to the weight of the mooring should improve performance.
I would also question whether the anchor weight (40 lbs + 10' of chain) is sufficient with this length of mooring to prevent it from being 'dragged' under high sea state or high current & tidal change conditions. Certainly if subsurface floatation is added to the mooring, extra anchor weight will be required.”
Thus if the Neptune buoy is to be deployed in deep water in the future, a revised mooring arrangement is recommended that includes a sub-sea buoy to improve the overall
measurement performance.
IOT has recently taken delivery of a new open ocean TRIAXYSTM directional wave buoy (Figure 13) manufactured by AXYS Environmental Systems of Sydney, B.C. with wave data analysis software designed in collaboration with the Canadian Hydraulics Center (CHC) of the National Research Council (NRC). The buoy is described in detail in Reference 13. The buoy has undergone a rigid testing program including being subjected to comparative testing with a Datawell directional wave buoy off the west coast of
Vancouver Island in June 1999 (Reference 14). It is recommended that wave
measurement experiments be carried out off St. John’s comparing the Neptune buoy with modified mooring arrangement(s) to the TRIAXYSTM buoy with its standard deep water mooring arrangement.
8.0 ACKNOWLEDGEMENTS
The author would like to acknowledge the input regarding the Neptune buoy mooring provided by Mr. Craig Kirby.
9.0 REFERENCES
1. Cumming, D., Fleming, T., “Description of Seakeeping Trial Carried Out on CCGA Miss Jacqueline IV – October 2004”, IOT Report TR-2004-15, December 2004.
2. Fleming, T., Cumming, D., “Description of Seakeeping Trial Carried Out on CCGA Nautical Twilight – November 1, 2004”, IOT Report TR-2004-13, December 2004.
3. Cumming, D., Fleming, T., “Description of Seakeeping Trial Carried Out on CCGA Roberts Sisters II – November 2004”, IOT Report TR-2005-09, July 2005. 4. Sentry Wave Buoy Operation Manual, Neptune Sciences, Inc., Slidell, Louisiana,
USA.
5. Datawell b.v. web site:
http://download.datawell.nl/documentation/directional_waverider_mkii_brochure. pdf - July 2005.
6. “Wave Data Collection Directional Waverider Buoy User Manual”, Oceans Ltd., June 2004.
7. United States Department of Agriculture, Agriculture Research Service (USDA – ARS), Phoenix, Arizona: http://www.wcrl.ars.usda.gov/cec/java/lat-long.htm, July 22, 2005.
8. United States National Geophysical Data Center (NGDC), National Oceanic & Atmospheric Administration (NOAA) Satellite and Information Service:
http://www.ngdc.noaa.gov/seg/geomag/jsp/struts/calcDeclination, July 22, 2005. 9. Geodetic Survey Division, Natural Resources Canada:
http://www.geod.nrcan.gc.ca/index_e/online_apps_e/appINDIR_e/inverse_e.html, July 22, 2005.
10. Torstein, P, Nyland, S., Dolle, A.,”Wave Height Measurements Using Acoustic Surface Tracking”, http://www.nortek-as.com/biblio/Oceans2002Waves.pdf, OCEANS 2002 Conference & Exhibition, Mississippi, MS.
11. Diwan, S.G., Suryavanshi, A.K., Nayak, B.U.,”Operational Experiences of Datawell Waverider Buoys”, La mer, Vol. 27 (4), 1989, Société franco-japonaise d’océanographie, Tokyo, pp. 193-199.
12. Kirby, C., Private e-mail communication, August 5, 2005. 13. AXYS Environmental Systems web site:
http://www.axystechnologies.com/pdf/products/triaxys.pdf, August 4, 2005. 14. Skey, S.G.P., Miles, M.D., ”Advances in Buoy Technology for Wind/Wave data
Collection and Analysis”, http://www.envirtech.org/doc/Paper%20-%20Advances%20in%20Buoy%20Technology.pdf, August 5, 2005.
Summary of Acquired Wave Buoy Data - Fall 2004
Neptune Directional Datawell Directional Wave Buoy Comparisons
Wave Buoy Data Wave Buoy Data
CCGA Miss Jacqueline IV Trial - October 17/18, 2004.
No. Date NF Time Hs Tavg DirMax NF Time Hs Tavg DirMax Hs % Diff. Hs Diff. Tavg % Diff. Tavg Diff.
(m) (s) (deg. TRUE) (m) (s) (deg. TRUE)
1 Oct. 17 08:00 2.40 8.38 269.0 07:56 2.96 8.696 27.2 18.92 -0.56 3.63 -0.316 2 Oct. 17 09:30 2.44 8.18 247.3 09:26 2.88 8.333 27.7 15.28 -0.44 1.84 -0.153 3 Oct. 17 12:00 2.08 7.19 274.9 11:56 3.06 8.333 16.0 32.03 -0.98 13.72 -1.143 4 Oct. 17 12:30 2.38 7.72 47.8 12:26 2.58 7.692 45.5 7.75 -0.20 0.36 0.028 5 Oct. 17 13:00 2.46 7.93 50.6 12:56 2.71 7.843 18.8 9.23 -0.25 1.11 0.087 6 Oct. 17 13:30 2.36 7.65 56.3 13:26 2.62 7.843 23.0 9.92 -0.26 2.46 -0.193 7 Oct. 17 15:00 2.13 7.04 114.1 14:56 2.23 6.780 20.2 4.48 -0.10 3.83 0.26 8 Oct. 17 15:30 2.22 7.20 64.8 15:26 2.61 7.273 18.5 14.94 -0.39 1.00 -0.073 9 Oct. 17 16:00 2.21 7.09 23.5 15:56 2.68 7.407 32.8 17.54 -0.47 4.28 -0.317 10 Oct. 17 16:30 2.14 6.90 5.7 16:26 2.53 7.143 65.2 15.42 -0.39 3.40 -0.243 11 Oct. 17 17:00 2.19 7.27 298.6 16:56 2.26 6.897 84.9 3.10 -0.07 5.41 0.373 12 Oct. 17 17:30 1.97 6.79 293.4 17:26 2.49 7.018 48.3 20.88 -0.52 3.25 -0.228 13 Oct. 17 19:00 2.08 7.05 255.1 18:56 2.35 6.897 41.3 11.49 -0.27 2.22 0.153 14 Oct. 17 19:30 2.28 7.13 271.9 19:26 2.25 6.557 38.5 1.33 0.03 8.74 0.573 15 Oct. 17 21:00 2.07 6.79 282.7 20:56 2.10 6.061 38.5 1.43 -0.03 12.03 0.729 16 Oct. 17 21:30 2.05 6.39 281.4 21:26 2.14 6.061 32.8 4.21 -0.09 5.43 0.329 17 Oct. 17 22:00 2.06 6.43 256.0 21:56 2.23 6.250 55.3 7.62 -0.17 2.88 0.18 18 Oct. 17 22:30 2.23 6.58 248.1 22:26 2.31 6.154 44.1 3.46 -0.08 6.92 0.426 19 Oct. 17 23:00 1.96 6.12 92.3 22:56 2.26 6.154 41.3 13.27 -0.30 0.55 -0.034 20 Oct. 17 23:30 2.08 6.08 34.2 23:26 2.22 5.970 38.5 6.31 -0.14 1.84 0.11 21 Oct. 18 00:00 1.89 5.72 57.4 23:56 2.38 6.061 31.4 20.59 -0.49 5.63 -0.341 22 Oct. 18 00:30 2.16 6.14 25.0 00:26 2.39 5.882 52.5 9.62 -0.23 4.39 0.258 23 Oct. 18 02:00 2.00 5.92 78.8 01:56 2.29 5.970 32.8 12.66 -0.29 0.84 -0.05 24 Oct. 18 02:30 2.06 6.18 79.6 02:26 2.16 5.714 77.8 4.63 -0.10 8.16 0.466 25 Oct. 18 03:00 1.95 5.90 249.6 02:56 2.20 5.882 61.0 11.36 -0.25 0.31 0.018 26 Oct. 18 05:30 1.96 5.95 23.3 05:26 2.13 5.714 16.0 7.98 -0.17 4.13 0.236 27 Oct. 18 06:00 1.81 5.60 209.3 05:56 2.19 5.797 63.8 17.35 -0.38 3.40 -0.197 28 Oct. 18 06:30 1.99 5.95 342.4 06:26 2.09 5.714 72.2 4.78 -0.10 4.13 0.236 29 Oct. 18 07:00 1.92 5.88 251.1 06:56 2.11 5.797 69.4 9.00 -0.19 1.43 0.083 30 Oct. 18 07:30 1.82 5.79 244.6 07:26 2.17 5.797 52.5 16.13 -0.35 0.12 -0.007 31 Oct. 18 08:00 1.93 6.06 233.3 07:56 2.11 5.714 62.4 8.53 -0.18 6.06 0.346 32 Oct. 18 08:30 1.81 5.76 238.4 08:26 2.13 5.882 107.4 15.02 -0.32 2.07 -0.122 33 Oct. 18 10:30 1.76 5.69 162.7 10:26 2.15 5.797 91.9 18.14 -0.39 1.85 -0.107 34 Oct. 18 13:30 1.64 5.67 216.2 13:26 1.98 5.797 84.9 17.17 -0.34 2.19 -0.127 35 Oct. 18 14:00 1.77 5.67 222.1 13:56 1.94 5.714 86.3 8.76 -0.17 0.77 -0.044 36 Oct. 18 14:30 1.8 5.91 232.4 14:26 1.97 5.556 80.7 8.63 -0.17 6.37 0.354 37 Oct. 18 15:00 1.78 5.90 259.0 14:56 1.92 5.556 83.5 7.29 -0.14 6.19 0.344 38 Oct. 18 15:30 1.77 5.93 266.4 15:26 1.86 5.634 41.3 4.84 -0.09 5.25 0.296
CCGA Nautical Twilight
No. Date NF Time Hs Tavg DirMax NF Time Hs Tavg DirMax Hs % Diff. Hs Diff. Tavg % Diff. Tavg Diff.
(m) (s) (deg. TRUE) (m) (s) (deg. TRUE)
39 Nov. 1 09:00 1.74 6.20 263.4 08:58 1.78 6.154 28.6 2.25 -0.04 0.75 0.046 40 Nov. 1 10:00 1.76 5.95 221.3 09:58 1.85 5.970 25.8 4.86 -0.09 0.34 -0.02 41 Nov. 1 13:00 2.04 6.11 234.3 12:58 2.16 6.154 13.2 5.56 -0.12 0.71 -0.044 42 Nov. 1 13:30 2.09 6.30 231.5 13:28 1.94 5.970 193.2 7.73 0.15 5.53 0.33 43 Nov. 1 14:00 1.96 6.14 215.1 13:58 1.98 6.154 18.8 1.01 -0.02 0.23 -0.014 44 Nov. 1 14:30 1.88 6.23 240.9 14:28 2.13 6.250 177.7 11.74 -0.25 0.32 -0.02 45 Nov. 1 15:30 2.03 6.39 263.6 15:28 1.91 6.250 187.5 6.28 0.12 2.24 0.14 46 Nov. 1 16:00 1.93 6.45 305.9 15:58 2.22 6.557 184.7 13.06 -0.29 1.63 -0.107
Neptune Directional Datawell Directional Wave Buoy Comparisons
Wave Buoy Data Wave Buoy Data
CCGA Roberts Sisters II
No. Date NF Time Hs Tavg DirMax NF Time Hs Tavg DirMax Hs % Diff. Hs Diff. Tavg % Diff. Tavg Diff.
(m) (s) (deg. TRUE) (m) (s) (deg. TRUE)
47 Nov. 15 06:00 2.58 8.24 39.3 05:57 2.38 7.018 118.6 8.40 0.20 17.41 1.222 48 Nov. 15 06:30 2.44 8.04 54.4 06:27 2.24 6.780 114.4 8.93 0.20 18.58 1.26 49 Nov. 15 07:00 2.34 7.76 52.4 06:57 2.26 6.667 103.2 3.54 0.08 16.39 1.093 50 Nov. 15 07:30 2.63 8.13 37.6 07:27 2.29 6.667 122.8 14.85 0.34 21.94 1.463 51 Nov. 15 08:00 2.61 8.24 20.4 07:57 2.40 6.780 117.2 8.75 0.21 21.53 1.46 52 Nov. 15 08:30 2.55 7.82 40.4 08:27 2.26 6.780 120.0 12.83 0.29 15.34 1.04 53 Nov. 15 09:00 2.82 8.47 14.2 08:57 2.26 6.667 108.8 24.78 0.56 27.04 1.803 54 Nov. 15 09:30 2.25 7.67 223.6 09:27 2.21 6.557 100.3 1.81 0.04 16.97 1.113 55 Nov. 15 10:00 2.04 6.99 44.1 09:57 2.48 6.557 125.7 17.74 -0.44 6.60 0.433 56 Nov. 15 11:00 1.98 6.81 44.3 10:57 2.28 6.452 127.1 13.16 -0.30 5.55 0.358 57 Nov. 15 11:30 1.99 6.84 64.9 11:27 2.33 6.667 118.6 14.59 -0.34 2.59 0.173 58 Nov. 15 12:00 2.08 7.04 116.6 11:57 2.22 6.452 132.7 6.31 -0.14 9.11 0.588 59 Nov. 15 12:30 2.10 7.00 49.5 12:27 2.28 6.349 108.8 7.89 -0.18 10.25 0.651 60 Nov. 15 13:30 1.90 6.63 244.3 13:27 2.33 6.557 121.4 18.45 -0.43 1.11 0.073 61 Nov. 15 14:00 2.17 6.99 226.9 13:57 2.28 6.452 120.0 4.82 -0.11 8.34 0.538 62 Nov. 15 14:30 2.25 6.95 60.5 14:27 2.24 6.250 113.0 0.45 0.01 11.20 0.7 63 Nov. 15 15:00 2.24 7.17 350.0 14:57 2.17 6.061 121.4 3.23 0.07 18.30 1.109 64 Nov. 15 15:30 2.25 7.09 39.0 1527 2.25 5.970 122.8 0.00 0.00 18.76 1.12 SUM = 644.14 406.98
NOTE: Hs - Significant Wave Height (m) Average = 10.06 6.36
Tavg - Average Wave Period (s)
DirMax - Wave Direction of Frequency Band with Highest Wave Energy (deg. TRUE).
Ship Zero Speed Drift Run Data Analysis:
Date Run Start Run Stop Run Ship File Name Start Start Stop Stop Drift Drift Drift
Time Time Duration Latitude Longitude Latitute Longitude Distance Speed Direction
No. (minutes) (deg. N) deg. W) (deg. N) deg. W) (nm) (knots) (deg. TRUE)
0 Oct. 17 07:14 07:39 25 Miss Jacqueline IV' BEAM_DRIFT_20041017071402.csv 47.5604 52.4269 47.5602 52.4291 0.09151 0.2196 79.5378 2.48 Oct. 17 10:42 11:07 25 Miss Jacqueline IV' BEAM_DRIFT_20041017104210.csv 47.5614 52.4309 47.5635 52.4304 0.11882 0.2852 190.9450 6.65 Oct. 17 14:29 14:55 26 Miss Jacqueline IV' BEAM_DRIFT_20041017142907.csv 47.5631 52.4276 47.5648 52.4292 0.12064 0.2784 173.5639 33.72 Oct. 18 12:40 13:05 25 Miss Jacqueline IV' BEAM_DRIFT_20041018124052.csv 47.5627 52.4273 47.5659 52.4254 0.21494 0.5159 201.5442 39 Nov. 1 08:48 09:13 25 Nautical Twilight' BEAM_DRIFT_20041101084833.csv 47.5458 52.4369 47.5424 52.4383 0.20776 0.4986 15.7556 40.92 Nov. 1 12:45 13:10 25 Nautical Twilight' BEAM_DRIFT_20041101124520.csv 47.5466 52.4360 47.5458 52.4359 0.05000 0.1200 0
47 Nov. 15 05:56 06:21 25 Roberts Sisters II' 0DRIFT_20041115055619.csv 47.5544 52.4375 47.5466 52.4496 0.68027 1.6326 46.7772 55 Nov. 15 10:10 10:35 25 Roberts Sisters II' 0DRIFT_20041115101000.csv 47.5549 52.4391 47.5482 52.4511 0.62767 1.5064 50.5011
Figure 1: Neptune Directional Wave Buoy
Significant Wave Height Comparison 0.0 0.5 1.0 1.5 2.0 2.5 3.0 3.5 0 10 20 30 40 50 60 7
No. of Half Hour Wave Data Samples
Significant Wave Height (m)
0
Datawell Buoy Data Neptune Buoy Data
October 17 October 18 Nov. 1 November 15
Significant Wave Height Comparison 0 5 10 15 20 25 30 35 0 10 20 30 40 50 60 70
No. of Half Hour Wave Data Samples
% Diff. SWH Between 2 Wave Buoys
-1.2 -1.0 -0.8 -0.6 -0.4 -0.2 0.0 0.2 0.4 0.6 0.8 Hs (Neptune) - Hs (Datawell)
% Diff. Hs (Neptune) - Hs (Datawell)
October 17 October 18 Nov. 1
November 15
Average Wave Period Comparison 0 1 2 3 4 5 6 7 8 9 10 0 10 20 30 40 50 60
No. of Half Hour Wave Data Samples
Averag e Wave P e rio d (s) 70
Datawell Buoy Data Neptune Buoy Data
October 17 October 18 Nov. 1 November 15
Average Wave Period Comparison 0 5 10 15 20 25 30 0 10 20 30 40 50 60 70
No. of Half Hour Wave Data Samples
% Diff. Tavg Between 2 Wave Buoys
-1.5 -1 -0.5 0 0.5 1 1.5 2
Tavg (Neptune) - Tavg (Datawell)
% Diff. Tavg (Neptune) - Tavg (Datawell)
October 17 October 18
Nov. 1
November 15
Wave Direction Comparison 0 50 100 150 200 250 300 350 400 0 10 20 30 40 50 60
No. of Half Hour Wave Data Samples
Wave Direction (deg. TRUE)
Neptune Buoy Data Datawell Buoy Data Ship Drift Direction October 17
October 18
Nov. 1
November 15
70
CCGA Miss Jacqueline IV Wave Data - Oct. 17 @ 13:00 NF Time 0 2 4 6 8 10 12 0 0.1 0.2 0.3 0.4 0.5 0.6 0 Frequency (Hz) S (m 2 /Hz)
Neptune Data Datawell Data
Neptune Buoy: Peak Period = 0.092 Hz Spectral Peak = 10.2791 m2/Hz Datawell Buoy: Peak Period = 0.085 Hz Spectral Peak = 11.0474 m2/Hz .7
CCGA Nautical Twilight Wave Data - 13:00 NF Time 0 1 2 3 4 5 6 0 0.1 0.2 0.3 0.4 0.5 0.6 0.7 Frequency (Hz) S (m 2 /Hz)
Neptune Data Datawell Data
Neptune Buoy: Peak Period = 0.146 Hz Spectral Peak = 4.9258 m2/Hz Datawell Buoy: Peak Period = 0.09 Hz Spectral Peak = 4.4468 m2/Hz
CCGA Robert Sisters II Wave Data - 12:00 NF Time 0 2 4 6 8 10 0 0.1 0.2 0.3 0.4 0.5 0.6 0.7 Frequency (Hz) S (m 2 /Hz)
Neptune Data Datawell Data
Neptune Buoy: Peak Period = 0.092 Hz Spectral Peak = 9.1876 m2/Hz Datawell Buoy: Peak Period = 0.09 Hz Spectral Peak = 8.7775 m2/Hz
Datawell Spectral Density Data (13:58 NF Time) 0.00 0.50 1.00 1.50 2.00 2.50 3.00 3.50 0 0.1 0.2 0.3 0.4 0.5 0.6 0.7 Frequency (Hz) S (m 2 /Hz)
Datawell Wave Direction (13:58 NF Time)
0 50 100 150 200 250 0 0.05 0.1 0.15 0.2 0.25 0.3 0.35 Frequency (Hz)
Wave Direction (deg. TRUE)
Figure 12: Example Neptune Buoy Mooring for a Water Depth of 10 m
Typical Neptune Wave Buoy Output File:
NSI-Neptune Sciences, Inc - Wave Sentry Data Processing Software Version 1.33 Sun Oct 17 11:00:00 2004
VBat = 13.29, Leak = DRY, Temp = 9.1
Significant wave height = 2.40 m
Dominant and average frequency = 0.09 Hz 0.12 Hz Dominant and average period = 10.89 s 8.04 s
Wave directions are compass headings from which waves approach. Dominant wave direction = 84.8 deg magnetic
Average wave direction = 48.8 deg magnetic -- -- bnd cfrq c11 r1 r2 0 alpha1 alpha2 1 0.038 0.0000 999.9000 999.9000 0 999.9 999.9 2 0.049 0.0000 999.9000 999.9000 0 999.9 999.9 3 0.060 0.0000 999.9000 999.9000 0 999.9 999.9 4 0.070 4.7444 0.3753 0.2412 0 14.5 91.7 5 0.081 6.0094 0.2542 0.5294 0 92.3 108.6 6 0.092 7.2636 0.3818 0.7142 0 84.8 99.0 7 0.103 5.8444 0.3488 0.5637 0 302.8 278.3 8 0.113 3.0552 0.4300 0.6603 0 77.8 92.4 9 0.124 1.8820 0.3787 0.6811 0 292.8 273.5 10 0.135 0.6413 0.1445 0.2893 0 348.1 292.0 11 0.146 0.5313 0.3082 0.1294 0 116.7 88.4 12 0.156 0.5597 0.5231 0.4023 0 46.4 53.1 13 0.167 0.4211 0.1975 0.3689 0 229.7 269.1 14 0.178 0.3438 0.2008 0.3688 0 301.0 277.8 15 0.188 0.2643 0.4430 0.1492 0 343.2 281.5 16 0.199 0.0693 0.5855 0.2870 0 282.2 274.0 17 0.210 0.1496 0.2919 0.1041 0 335.1 330.1 18 0.221 0.0604 0.1283 0.5735 0 309.0 269.5 19 0.231 0.0652 0.2153 0.3479 0 186.6 171.4 20 0.242 0.0772 0.2703 0.3877 0 227.1 258.7 21 0.253 0.1055 0.4117 0.3117 0 204.8 163.0 22 0.264 0.0760 0.3987 0.0691 0 215.4 146.3 23 0.274 0.1702 0.6832 0.3541 0 193.7 194.6 24 0.285 0.0937 0.7562 0.4358 0 176.4 179.3 25 0.296 0.1658 0.7765 0.5154 0 185.8 181.0 26 0.307 0.1659 0.7884 0.5085 0 177.7 174.3 27 0.317 0.0671 0.5157 0.2361 0 196.9 227.9 28 0.328 0.1472 0.8236 0.6080 0 197.1 194.6 29 0.339 0.0456 0.7009 0.5243 0 189.4 191.6 30 0.350 0.0844 0.7218 0.3789 0 196.3 183.9 31 0.360 0.0555 0.7693 0.5303 0 197.7 198.8 32 0.371 0.0463 0.7093 0.3606 0 156.8 160.2 33 0.382 0.0457 0.7396 0.3248 0 197.2 204.1 34 0.393 0.0245 0.6522 0.6597 0 171.7 165.4 35 0.403 0.0264 0.5883 0.1037 0 180.2 177.8 36 0.414 0.0412 0.8284 0.6495 0 184.6 189.0 37 0.425 0.0363 0.7614 0.5169 0 173.3 168.9 38 0.436 0.0197 0.6973 0.3496 0 172.0 168.2 39 0.446 0.0173 0.7455 0.4232 0 183.7 183.3 40 0.457 0.0217 0.7924 0.5352 0 181.4 179.9 41 0.468 0.0178 0.6057 0.3783 0 168.1 143.9 42 0.479 0.0135 0.5434 0.1797 0 195.6 231.4 43 0.489 0.0151 0.8104 0.4948 0 180.0 183.4 44 0.500 0.0095 0.6900 0.3071 0 182.7 182.2 Mean, min, max acc (g) = -0.01 -0.51 0.35
Mean, min, max pitch (deg)= -0.0 -12.0 9.9 Mean, min, max roll (deg) = -0.0 -12.3 12.8 Maximum tilt (deg) = 15.0
1. General Description of the Datawell Directional Waverider Mark II
The directional waverider buoy is a spherical, 0.9 m diameter buoy which measures wave height and wave direction. The buoy is manufactured by Datawell bv of the Netherlands. The buoy used in the NRC trials transmitted on 29.760 Mhz. Output power is 150-200 mW. The buoy is powered by 85 Leclanche zinc-carbon batteries, 80 Wh per cell. The buoy contains a flashing light that flashes 5 times every 20 seconds.
The direction measurement is based on the translational principle which means that horizontal motions instead of wave slopes are measured. As a consequence the measurement is independent of buoy roll motions and therefore a relative small buoy can be used.
A single point vertical mooring ensures sufficient symmetrical horizontal buoy response also for small motions at low frequencies.
The buoy comes standard with sea surface temperature measurement. Installed Sensors
The buoy contains:
- heave-pitch-roll sensor Hippy-40 - three axis fluxgate compass
- two fixed “x” and “y” accelerometers - temperature sensor
- micro-processor Directional Measurement
From the accelerations measured in the x and y directions of the moving “buoy reference frame” the accelerations along the fixed, horizontal, north and west axis are calculated. All three accelerations (vertical, north and west) are digitally integrated to get filtered displacements with a high frequency cut-off at 0.6 Hz.
Finally, every half hour, FFT transforms of 8 series of 256 data points (200 sec) are summed to give 16 degrees of freedom on 1600 seconds of data.
Data Compression
To save transmitting power the real time data are compressed to motion vertical, motion north and motion west.
Data Reduction
Onboard data reduction computes energy density, main direction, directional spread and the normalized second harmonic of the directional distribution.
Frequency resolution:
0.005 Hz from 0.025 to 0.1 Hz and 0.01 Hz from 0.1 to 0.59 Hz.
Standard Transmission
The Directional Waverider transmits HF in the 27-40 Mhz band continuously. The Directional Waverider transmits:
- Real time data:
motion vertical
motion north
motion west
- Quasi static data:
computed spectral density
directional parameters
Hmo (significant wave height) Tz (mean zero crossing period)
Monitoring data such as sea temperature, battery voltage, system status, GPS position (optional) and parity bits for error checking purposes.
Mooring
The Directional Waverider is fitted with a 5 kg chain ballast attached to the mooring eye. This provides stability when only a small vertical mooring force is present (free floating or shallow water).
A single point vertical mooring with 30 m rubbercord ensures sufficient symmetrical horizontal buoy response also for small motions at low frequencies.
The low stiffness of the 30 m rubbercord allows the Directional Waverider to follow waves up to 40 m.
Current velocities of up to 3 m/sec (6 knots) can be accommodated. The static buoyancy of the buoy is 1630 N.
The mooring design used for the NRC trials is shown in Figure 1 at the end of this document.
2. Directional Waverider Mark II Specifications
Hull diameter 0.9 m
Buoy weight 212 kg
Static buoyancy 1630 N
Maximum current speed 3 m/sec
Heave:
Range -20 to +20 m
Resolution 1 cm
Scale of accuracy 3 % of measured value
Zero offset < 0.1 m
Period time 1.6 sec – 30 sec
Cross sensitivity < 3 %
Direction:
Range 0 – 360 degrees
Resolution 1.5 degrees
Buoy heading error typical .5 degrees
Period time in free floating condition 1.6 sec – 30 sec Period time in moored condition 1.6 sec – 20 sec
3. General Description of the Directional Waverider Receiver System
The receiving system installed on the roof of OCEANS Ltd. offices at 85
LeMarchant Rd. St. John's consisted of an omnidirectional antenna (a 3 metre Kathrein radiator whip antenna and 3 radial antennae) and antenna mount connected via a coax cable (RG 213 U) routed from the antenna mount to the wave direction receiver installed in an office below. A laptop interfaced to the wave direction receiver for storing and displaying wave data. The receiver was receiving on 38.760 Mhz. Standard 120 volt AC was used to power the wave direction receiver.
During the trials data was recorded every half hour. The recorded data included spectral, raw and statistics data. These data were passed to NRC within 48 hours after the end of a sea trial. In addition to other wave parameters the following basic wave parameters were included in the wave data provided to NRC:
start time of the data collection in UTC time significant wave height in centimetres mean zero crossing period in seconds
direction of the spectral peak in degrees magnetic directional spread of the spectral peak in degrees
The directional waverider buoy was deployed October 8, 2004 at 17:00 UTC time by the 40 m long Marine Institute training vessel M/V Louis M. Lauzier in
1m Stainless ballast chain with swivel 4 1 2 6 5 Subsurface SS28 Steel Float
S
oo oS
o o oNRC September 2004 - Directional
Waverider Mooring
Water Depth - 165 Metres
Position 47 34.29N; 52 26.21W
oo
0
30 m rubber shock cord
4 m - 1/2" CHAIN 95m Amsteel Blue
* Diagram Not Drawn to Scale
55.5m Amsteel Blue 25m Amsteel Blue 0 0 0 0 0 0 0 0 1500lb Anchor
S
ooS
ooMooring built with 1.7 scope from subsurface float = 110.5m of bungee and rope.
Distance between Sinker and Subsurface float = 10m. 3/8" Amsteel Blue rope. Average Strength: 20,445 lbs Minimum Strength: 18,401 lbs Sinker President: _____________________ Field Manager: _____________________ Mooring Design Tech: _____________________
Typical Raw Datawell Wave Buoy Output Files: 10171100.dat 10-17-2004 1100 to 1120 ,100% , 442 ,10.0 , 340 ,11.1 , 272 ,11.1 , 169 , 8.8 ,0.82 86 , +155 , -173 ,10.91 126 , +147 , -202 ,11.86 45 , +105 , -101 ,15.56 85 , +97 , -146 ,14.55 1 , +128 , -120 ,13.83 0 , +181 , -141 ,11.92 118 , +27 , -5 , 2.30 5 , +71 , -61 , 9.96 44 , +62 , -90 , 6.57 87 , +111 , -81 ,11.44 124 , +52 , -6 , 7.21 130 , +6 , -38 , 4.31 119 , +19 , -75 , 5.46 82 , +82 , -116 ,13.05 46 , +68 , -64 ,15.58 79 , +110 , -39 , 8.55 29 , +66 , -74 , 8.07 90 , +38 , +0 , 1.08 131 , +77 , -113 ,10.59 81 , +77 , -48 , 8.10 30 , +45 , -47 , 7.01 76 , +17 , -64 , 6.06 33 , +93 , -122 ,10.20 127 , +44 , -5 , 1.86 125 , +79 , -12 , 7.19 4 , +25 , -78 , 5.73 66 , +56 , -14 , 4.63 28 , +22 , -56 , 5.03 3 , +100 , -147 ,10.42 122 , +144 , -131 ,13.73 89 , +123 , -141 ,11.58 94 , +66 , -7 , 6.64 107 , +57 , -81 , 7.76 134 , +148 , -110 , 8.34 84 , +115 , -82 , 8.84 129 , +65 , -39 , 6.76 77 , +1 , -32 , 3.26 80 , +55 , -34 , 2.43 83 , +71 , -32 , 7.32 65 , +19 , -32 , 2.36 22 , +35 , -39 , 3.82 75 , +58 , -52 ,10.33 2 , +1 , -36 , 2.66 62 , +67 , -138 ,11.01 43 , +137 , -182 ,11.82 116 , +184 , -204 ,11.34 108 , +190 , -93 ,10.61 13 , +84 , -61 , 9.87 34 , +82 , -62 ,10.04 78 , +22 , -36 , 3.00 128 , +84 , -66 ,10.40 9 , +23 , -17 , 1.17 18 , +10 , -17 , 3.28 117 , +61 , -90 , 9.50 123 , +69 , -81 ,12.25 67 , +81 , -74 ,10.20 61 , +34 , -8 , 3.19 70 , +39 , -80 , 7.45 74 , +46 , -49 , 5.95 121 , +73 , -92 , 8.90 109 , +53 , -31 , 9.55 69 , +64 , -114 , 6.83 59 , +90 , -116 ,11.23 88 , +81 , -27 , 7.90 102 , +42 , -99 , 6.87 92 , +127 , -92 ,11.02
104 , +123 , -125 ,10.30 132 , +89 , -93 ,11.25 55 , +78 , -61 ,10.59 115 , +69 , -98 ,11.45 8 , +95 , -80 , 9.08 53 , +24 , -29 , 2.83 50 , +32 , -34 , 8.37 54 , +76 , -73 , 9.41 95 , +76 , -95 ,10.05 15 , +76 , -133 ,10.56 73 , +138 , -124 ,11.54 47 , +119 , -102 , 8.12 105 , +99 , -96 ,11.21 120 , +117 , -165 ,11.72 133 , +118 , -102 , 9.90 48 , +139 , -130 , 9.95 64 , +155 , -132 ,12.15 16 , +116 , -104 ,13.92 68 , +97 , -129 ,13.99 32 , +206 , -182 ,10.51 101 , +213 , -229 ,10.01 7 , +205 , -108 ,12.39 14 , +112 , -53 , 7.45 100 , +100 , -139 , 8.73 19 , +158 , -115 ,10.75 57 , +38 , -13 , 2.34 93 , +60 , -102 ,13.11 97 , +56 , -63 ,10.70 41 , +93 , -136 , 9.43 63 , +89 , -61 ,14.51 35 , +59 , -2 , 6.03 25 , +28 , -83 , 6.34 38 , +40 , +0 , 2.77 58 , +42 , -1 , 2.34 114 , +56 , -70 , 8.42 12 , +59 , -75 , 9.03 20 , +86 , -77 , 6.75 24 , +34 , -48 , 6.38 37 , +48 , -113 , 8.98 60 , +92 , -53 ,10.06 103 , +20 , -27 , 4.70 21 , +98 , -130 , 9.50 27 , +90 , -109 ,11.89 110 , +89 , -81 ,11.98 40 , +65 , -10 , 6.49 31 , +26 , -22 , 2.26 26 , +20 , -45 , 3.19 72 , +10 , -4 , 2.14 112 , +40 , -55 , 5.43 96 , +74 , -81 ,10.31 10 , +92 , -113 , 9.77 49 , +96 , -92 ,13.06 71 , +165 , -162 ,10.78 39 , +151 , -146 ,10.39 91 , +68 , -77 , 9.01 23 , +90 , -81 ,12.30 111 , +137 , -106 ,10.08 106 , +82 , -102 ,15.85 11 , +131 , -171 ,11.27 99 , +84 , -169 ,14.63 56 , +214 , -203 ,10.18 51 , +148 , -107 , 9.95 98 , +89 , -106 , 9.03 17 , +100 , -122 , 7.90 42 , +146 , -156 , 9.72 36 , +163 , -107 ,11.22 6 , +97 , -64 ,12.78 52 , +63 , -82 ,10.88 113 , +122 , -106 , 9.23
10171026.SPT 8 296 8.695652 14.18512 24.95 10.15 7.125 .6275 -.48 -.125 184.2188 68.29102 .025,8.696544E-05,95.625,79.34118,-1.762304,1.590928 .03,3.207015E-04,355.7813,51.81236,2.346043,3.477841 .035,3.89752E-04,23.90625,70.94825,2.05442,2.156776 .04,9.303034E-04,53.4375,64.01009,.926271,2.028795 .045,2.357862E-03,61.875,73.29827,.7066005,1.523845 .05,6.158021E-03,115.3125,63.22675,-1.289652,2.09674 .055,1.083472E-02,64.6875,52.93142,1.613002,3.09405 .06,2.351775E-02,63.28125,47.55994,-1.045397,4.093884 .065,.2334004,42.1875,37.93605,-3.554573E-02,6.11615 .07,.6570469,46.40625,28.08834,-1.370019,7.987051 .075,.6376281,33.75,42.85991,-1.64351,3.156254 .08,1,47.8125,26.29785,-1.146525,9.833539 .085,.7710516,47.8125,32.67648,-.9353378,5.688601 .09,.9003245,50.625,35.69794,-.8472674,4.886494 .095,.5627049,45,45.99326,.9481481,4.090817 .1,.4231621,46.40625,50.24568,2.46527,3.431181 .11,.4448581,77.34375,56.4005,.6603481,1.852344 .12,.2187119,78.75,59.64577,.7208301,1.731958 .13,.1119168,46.40625,64.79343,1.906213,2.208256 .14,6.653681E-02,53.4375,70.38872,1.307765,1.756863 .15,6.203851E-02,39.375,71.9554,1.225077,1.881334 .16,3.111703E-02,7.03125,69.71729,-2.330161,2.281087 .17,3.337327E-02,77.34375,74.41733,.7921488,1.550305 .18,1.707739E-02,25.3125,65.46487,.2496473,1.982169 .19,1.221611E-02,2.8125,71.39587,-.718248,1.834045 .2,1.350089E-02,26.71875,74.41733,-.104,1.822087 .21,5.628007E-03,12.65625,73.8578,.4527259,1.736633 .22,8.270999E-03,247.5,72.51493,.215327,1.842533 .23,7.335719E-03,246.0938,70.38872,.2682666,1.743144 .24,5.247519E-03,286.875,70.16491,.8956103,2.022876 .25,3.829581E-03,302.3438,71.17206,.3562781,1.827769 .26,4.190229E-03,272.8125,69.15775,-.1747531,1.876894 .27,3.810481E-03,257.3438,60.3172,-2.553057E-02,2.130399 .28,3.64281E-03,237.6563,62.3315,4.145059E-02,1.767856 .29,4.361236E-03,230.625,57.07193,-.3189018,2.210175 .3,6.771722E-03,199.6875,48.11947,1.657703,3.700258 .31,6.06634E-03,180,40.06226,2.13799,5.305311 .32,7.867618E-03,188.4375,37.71224,.2346808,4.903982 .33,4.748152E-03,185.625,51.36474,.5334446,2.431004 .34,3.465148E-03,175.7813,46.44089,1.898311,3.445816 .35,3.96599E-03,171.5625,50.91712,.9248894,2.929232 .36,4.471641E-03,167.3438,47.00042,.7582065,3.485711 .37,2.865536E-03,165.9375,48.90281,.7232853,2.914603 .38,3.312673E-03,180,45.54564,-.3845249,2.984397 .39,2.794786E-03,185.625,44.87421,.6010292,3.61412 .4,3.848777E-03,171.5625,37.82415,.6746418,4.777031 .41,2.405494E-03,160.3125,36.03365,-.248804,4.819575 .42,2.46639E-03,158.9063,38.04795,.4527808,4.410443 .43,1.979324E-03,174.375,44.65039,8.639818E-02,2.561805 .44,1.57264E-03,164.5313,39.50273,2.950445E-02,3.81636 .45,2.265409E-03,149.0625,33.34792,1.103734,6.667895 .46,1.064766E-03,163.125,46.6647,.2619462,2.985128 .47,1.294022E-03,164.5313,41.40513,-.8572904,3.305247 .48,1.012837E-03,156.0938,47.11232,-7.029918E-02,2.190486 .49,1.549226E-03,167.3438,35.1384,-.3052134,5.526583 .5,1.353583E-03,153.2813,38.15986,1.603512,5.503655 .51,9.210467E-04,147.6563,44.42658,-.1148203,2.816776 .52,1.124969E-03,154.6875,36.48128,.193304,3.25938
.53,7.654859E-04,158.9063,38.15986,-.5278319,4.749246 .54,5.991493E-04,151.875,46.7766,-.1102494,3.161205 .55,1.230912E-03,156.0938,35.1384,.1373923,3.455565 .56,5.872853E-04,150.4688,44.09087,.1820585,2.666625 .57,8.333975E-04,153.2813,40.8456,.8533849,4.724912 .58,4.350716E-04,170.1563,48.11947,-1.056131,3.009303


![Douleur périopératoire et conséquences à court et moyen terme [Perioperative pain and its consequences]](data:image/gif;base64,R0lGODlhAQABAIAAAP///wAAACH5BAEAAAAALAAAAAABAAEAAAICRAEAOw==)