Bubble thy neighbour: Portfolio effects
and externalities from capital controls
The MIT Faculty has made this article openly available.
Please share
how this access benefits you. Your story matters.
Citation
Forbes, Kristin et al. “Bubble Thy Neighbour: Portfolio Effects
and Externalities from Capital Controls.” Journal of International
Economics 99 (March 2016): 85–104 © 2016 Elsevier B.V.
As Published
http://dx.doi.org/10.1016/J.JINTECO.2015.12.010
Publisher
Elsevier BV
Version
Original manuscript
Citable link
http://hdl.handle.net/1721.1/120805
Terms of Use
Creative Commons Attribution-NonCommercial-NoDerivs License
NBER WORKING PAPER SERIES
BUBBLE THY NEIGHBOR:
PORTFOLIO EFFECTS AND EXTERNALITIES FROM CAPITAL CONTROLS
Kristin Forbes
Marcel Fratzscher
Thomas Kostka
Roland Straub
Working Paper 18052
http://www.nber.org/papers/w18052
NATIONAL BUREAU OF ECONOMIC RESEARCH
1050 Massachusetts Avenue
Cambridge, MA 02138
May 2012
The authors would like to thank Giovanni Dell’Ariccia, Marcos Chamon, Rex Ghosh, Anton Korinek,
Iikka Korhonen, Helen Popper, Eswar Prasad, and seminar participants at the 2012 AEA Annual meetings,
the Hong Kong Monetary Authority, the International Monetary Fund, Mainz University, Tilburg University
and Tufts for helpful comments and suggestions. The authors would also like to thank all of the investors
that spent considerable amounts of time being interviewed to provide background information for
this paper. Further thanks to Apolline Menut at MIT for research assistance. The views expressed in
this paper are those of the authors and do not necessarily reflect those of the ECB, the Eurosystem,
or the National Bureau of Economic Research.
NBER working papers are circulated for discussion and comment purposes. They have not been
peer-reviewed or been subject to the review by the NBER Board of Directors that accompanies official
NBER publications.
© 2012 by Kristin Forbes, Marcel Fratzscher, Thomas Kostka, and Roland Straub. All rights reserved.
Short sections of text, not to exceed two paragraphs, may be quoted without explicit permission provided
that full credit, including © notice, is given to the source.
Bubble Thy Neighbor: Portfolio Effects and Externalities from Capital Controls
Kristin Forbes, Marcel Fratzscher, Thomas Kostka, and Roland Straub
NBER Working Paper No. 18052
May 2012
JEL No. F3,F4,F5,G01,G11
ABSTRACT
We use changes in Brazil’s tax on capital inflows from 2006 to 2011 to test for direct portfolio effects
and externalities from capital controls on investor portfolios. The analysis is structured based on information
from investor interviews. We find that an increase in Brazil’s tax on foreign investment in bonds causes
investors to significantly decrease their portfolio allocations to Brazil in both bonds and equities. Investors
simultaneously increase allocations to other countries that have substantial exposure to China and
decrease allocations to countries viewed as more likely to use capital controls. Much of the effect of
capital controls on portfolio flows appears to occur through signalling —i.e. changes in investor expectations
about future policies— rather than the direct cost of the controls. This evidence of significant externalities
from capital controls suggests that any assessment of controls should consider their effects on portfolio
flows to other countries.
Kristin Forbes
MIT Sloan School of Management
100 Main Street, E62-416
Cambridge, MA 02142
and NBER
[email protected]
Marcel Fratzscher
European Central Bank
Kaiserstrasse 29
D-60311 Frankfurt/Main, Germany
[email protected]
Thomas Kostka
European Central Bank
Frankfurt, Germany
[email protected]
Roland Straub
European Central Bank
Frankfurt, Germany
[email protected]
1
1. IntroductionSome economists and policymakers have recently become more supportive of controls on capital inflows, particularly if they are aimed at limiting the appreciation of overvalued currencies and reducing financial fragilities resulting from large and volatile capital flows. This support has been bolstered by theoretical work showing that taxes on capital inflows can improve a country’s welfare by reducing negative feedback effects due to capital flow volatility (Korinek, 2010 and Jeanne and Korinek, 2010) or by adjusting the terms-of-trade to shift consumption across periods (Costinot, Lorenzoni, and Werning, 2011). This theoretical work has been supported by empirical work showing that even if capital controls cannot significantly affect the total volume of capital inflows, they can improve the country’s liability structure and increase its resilience to crises (i.e., Ostry et al., 2010).1
The evidence used in support of capital controls, however, has largely focused on the direct benefits to the country implementing the controls and ignored any externalities on other countries. If controls reduce certain capital inflows for the host country, do they simply shift these flows and the corresponding challenges to another country in a “bubble-thy-neighbor” effect? These externalities could be particularly important in the current environment in which macroeconomic policies in some countries are already distorting capital flows in ways that foster fragilities and create future challenges (e.g., Rajan, 2010).
Even the IMF, formerly an avid promoter of capital market liberalization, has recently started to support the use of controls on capital inflows in certain circumstances (see Ostry et al., 2011 and International Monetary Fund, 2011).
2
This lack of empirical assessment of any externalities resulting from capital controls is surprising given the related evidence in other areas, such as on trade diversion and financial market contagion. An important focus of the trade literature has been how trade restrictions can create “trade diversion” as well as trade creation.
Only two recent theoretical papers (Korinek, 2011 and Costinot et al., 2011) consider these multilateral effects of capital controls and model how controls in one country can affect welfare in other countries. They show that these externalities could be positive or negative—depending on the model’s assumptions. Due to concerns about the possibility of negative externalities, Jeanne (2012) proposes a framework for multilateral oversight of capital controls. Despite this recent theoretical and policy-related work, however, there has not yet been any empirical analysis of whether the use of controls on capital inflows generates meaningful externalities on other countries.
3
1
In contrast, Forbes and Warnock (2012) find that capital controls do not significantly reduce the probability of a country experiencing surges or stops in foreign capital flows. For surveys on the effects of capital controls, see Magud, Reinhart and Rogoff (2011), Cline (2010), Ostry et al. (2010), Cardarelli, Elekdag and Kose (2009), Forbes (2007), Henry (2007) and Prasad, Rogoff, Wei and Kose (2003).
Similarly, the literature on financial contagion has documented that portfolio investors
2
See Jeanne (2012), which discusses how capital controls in China have supported an undervalued exchange rate, suppressing domestic demand and acting as an impediment to a global recovery and reduction in global imbalances. 3 For example, see the seminal work of Viner (1950).
2
respond to wealth, valuation, liquidity and information shocks in one country by adjusting portfolio allocations in the country where the shock occurs as well as in other countries.4This paper attempts to fill this void by testing for any portfolio effects of capital controls on the country instituting the controls as well as for any externalities on other countries. Previous empirical analyses of capital controls focused on effects on macroeconomic variables—such as the exchange rate, total volume of inflows, interest rates, or liability structures. This paper takes a fundamentally different approach by analyzing how capital controls affect country allocations in investor portfolios. More specifically, we use the Emerging Portfolio Fund Research (EPFR) database, which has detailed information on fund-level investments by country, to assess how equity and bond funds adjust their country allocations in response to changes in capital controls. This paper is the first portfolio-level analysis of how investors respond to capital controls. We focus on the type of control which has gained the most support in the academic literature and policy arena—of moderate, market-based controls on capital inflows in a country which previously had a relatively open capital account. We do not explicitly analyze situations in which capital controls are in place for an extended period of time, or in countries that have relatively closed capital accounts, although our results have implications for externalities in these situations.
There have not been analogous attempts so far to document if capital account restrictions can create “capital flow diversion” or related portfolio adjustments.
Before analyzing how investors respond to new controls on capital inflows, however, we interviewed investors to better understand how they evaluate and respond to capital controls. These interviews provided useful information to structure the empirical analysis and derive empirically testable hypotheses—such as helping define the framework by which investors make their decisions, the time period to expect an effect of controls, and how investors reallocate assets across countries in response to controls. These interviews suggest that simple theoretical models of how investors respond to a tax on one asset in one country could miss important dynamics in the impact of capital controls on capital flows across countries. In particular, the interviews indicate a number of dimensions by which investors might differentiate countries when responding to capital controls.
In our empirical analysis, we focus on changes in Brazil’s capital controls from 2006 through 2011. Brazil had a fairly open capital account during this period, but on several occasions added, removed, or raised a tax on certain types of foreign portfolio inflows. Focusing on one country has the
4 See Bae, Karolyi and Stulz (2003), Bekaert and Harvey (1995), Claessens and Forbes (2001), and Forbes and Rigobon (2002) for evidence of contagion at the country level, or Bekaert, Ehrmann, Fratzscher and Mehl (2011) for evidence in country-industry portfolios and Forbes (2004) for evidence at the firm level. See Broner, Gelos and Reinhart (2006), Curcuru, Thomas, Warnock and Wongswan (2011), and Jotikasthira, Lundblad, and Ramadorai (2010) for evidence at the fund level.
3
disadvantage that the analysis may not generalize to other countries’ experiences with controls—or even to different types of controls within the same country. We focus on this specific example, however, for two important reasons. First, one challenge with the cross-country analysis of controls is that different countries have adopted very different types of controls, with different levels of enforcement, different goals, and at different levels of financial development. Imposing the assumption in a cross-country study that these very different experiences have the same effect would bias estimates toward finding no effect of controls (which is a common result in this empirical literature).5 Second, the introduction of capital controls in countries with small equity and debt markets is less likely to have measurable externalities on portfolio investors. Since this is the first paper assessing empirically if these externalities can exist, we want to begin by analyzing a setting more likely to have some type of multilateral effects. Since Brazil is the largest equity and debt market in Latin America, and a large component of most emerging market indices against which portfolio investors are benchmarked, it is a logical place to start.6In order to analyze the effects of Brazil’s capital controls, we focus on an empirical framework in which investors adjust their portfolio shares allocated to each country based on the country’s weight in the relevant benchmark. We find that changes in Brazil’s capital controls have a significant effect on the share of funds’ portfolios allocated to Brazil. More specifically, our estimates imply that if Brazil had not instituted a 6% tax on foreign purchases of fixed income (i.e., if Brazil had kept the tax at 0%), Global Emerging Equity and Bond funds would have increased their portfolio allocations to Brazil by about 3% to 5% relative to their existing levels. Global Equity funds (that invest primarily in developed markets and have smaller portfolio allocations to Brazil) would have increased their allocations to Brazil by about 17% to 20%.
If there is no evidence of externalities in this setting, it is unlikely (although not impossible) that there would be economically significant externalities from smaller countries implementing capital controls.
7
Back-of-the envelope calculations suggest that this effect is not only significant, but the magnitude of the impact on portfolio flows could be large. Although these calculations involve a number of assumptions and should be interpreted cautiously, the estimates suggest that foreign portfolio investors would have held roughly $28 to $32 billion more in equity and debt investments in Brazil if Brazil had not implemented these capital controls. This is large relative to annual portfolio flows ($71 billion in 2010), but moderate relative to total foreign portfolio investment in Brazil ($554 billion at year-end 2009).8
5
For evidence, see Baba and Kokenyne (2011) or Magud and Reinhart (2007).
6 Brazil’s share of JPMorgan’s EMBIG benchmark index ranged from 7% to 11% over our sample period from 2006 to mid-2011.
7 To put this in context, average portfolio allocations to Brazil at the end of our sample in July 2011 were 11.6% for Global Emerging Market Bond funds, 15.9% for Global Emerging Market Equity funds, and 1.8% for Global Equity funds.
4
The results also suggest that capital controls affect investors through a signalling effect and not just the immediate, direct cost. An increase in the tax on foreign investment in fixed income not only caused fixed income investors to decrease their exposure to Brazil, but also caused equity investors to decrease their exposure to Brazil’s equities. In fact, the estimates suggest that over half of the increased foreign portfolio investment into Brazil that would occur from removing the tax on fixed income would occur through increased investment from equity funds. Capital controls appear to be interpreted by investors as signalling a government that is less supportive of foreign portfolio flows, possibly indicating an increased probability of future policy changes that negatively affect foreign investors. This result supports the seminal work by Bartolini and Drazen (1997) which models capital controls as signals of future government behavior.9Given these significant portfolio effects of capital controls on investor allocations to Brazil, it is not surprising that there are externalities on portfolio allocations to other countries as well. Confirming comments in some of the investor interviews, we find that these spillovers are heterogeneous and depend on country characteristics and the fund manager’s strategy. When Brazil increases its capital controls, investors increase their portfolio allocations to other countries that are closely linked to growth in China (through commodity or regional exports). There is also mixed evidence that investors may increase their portfolio allocations to other countries in Latin America. At the same time, increased capital controls in Brazil cause investors to reduce their portfolio allocations to countries that are perceived to have a higher risk of following Brazil’s example and implementing new controls (including countries that are
traditionally open but recently imposed new controls as well as countries that traditionally have extensive restrictions on capital mobility). These results confirm that much of the effect of controls is from
signalling, i.e. changes in investor expectations about government policy, even for countries that are not concurrently adjusting their capital controls.
In their model, investors have imperfect information about a government’s intention and use current investment policies to infer the course of future policies. Moreover, the results in our paper indicate that it is only changes in the specific tax on foreign portfolio investment—a clear capital control that is closely watched by investors—that significantly affects portfolio allocations. Changes in other prudential regulations that are intended to have similar effects do not significantly affect portfolio allocation. This result supports the evidence in Chetty, Kroft, and Looney (2007) that when tax policies are more “salient” (i.e., when it is simpler to calculate their effect) than they will generate a larger behavioural response.
9
Also related are several studies showing that foreign exchange intervention can affect exchange rates through signalling future changes in monetary policy (i.e., Sarno and Taylor, 2001, Kaminsky and Lewis, 1996, and Dominguez and Frankel, 1993).
5
These results have important implications for the debate on the effectiveness and desirability of capital controls. A recent paper by the International Monetary Fund concluded that: “Capital controls are an important part of the policy toolkit for managing surges in capital inflows…..”10 This conclusion rested largely on the evidence that capital controls could shift the composition of capital inflows to reduce a country’s vulnerability, without significantly affecting the total volume of inflows. Our analysis shows that capital controls can reduce portfolio inflows, a form of capital flows generally believed to be riskier, more volatile, and less desirable than foreign direct investment.11This renewed support for capital controls has also assumed that capital controls in one country do not generate significant externalities on other countries. Our analysis shows, however, that this may not be true. Increased capital controls in Brazil not only caused investors to reduce the share of their portfolios allocated to Brazil, but also caused them to increase the share of their portfolios allocated to other countries—especially to countries that have exposure to China and fewer restrictions on capital flows. Therefore, the reduction of investors’ exposure to Brazil was not equally distributed among all other countries in their portfolios. As a result, although capital controls may have had the benefit of reducing the risks of bubbles, overheating and exchange rate appreciation in Brazil, they may have aggravated these risks in other countries. If capital controls shift vulnerabilities from one country to another, this “bubble thy neighbour effect” should be incorporated in any reassessment of the desirability of capital controls. Moreover, if several countries simultaneously adopted controls as part of a standard “policy toolkit”, or if a single large country adopted more stringent controls than Brazil’s small tax analyzed in this paper, the externalities could be substantial. This does not necessarily mean that capital controls will reduce global welfare and should always be avoided. Instead, these results support a role for international coordination or oversight of the use of capital controls to avoid a “bubble thy neighbor” effect which could lead to retaliation across countries and reduce global welfare.
Since our data only contains
information on equity and debt flows, however, we are not able to test if this reduction in portfolio flows translates into a reduction in total capital inflows or is balanced by increases in other types of capital inflows (possibly as investors attempt to evade the tax).
The remainder of this paper is as follows. Section 2 summarizes a series of interviews with investors on how they think about and respond to capital controls. Section 3 discusses the dataset and capital control events used for the analysis. Section 4 develops the model and estimation framework. Section 5 presents a series of results focusing on the direct portfolio effects of capital controls on Brazil. Section 6 focuses on the externalities from Brazil’s controls on other countries. Section 7 concludes.
10
Ostry et al. (2011), pg. 29.
6
2. Investor SurveysTo better understand how investors respond to changes in capital controls and more accurately structure our empirical tests, we interviewed 15 different groups of investors (with group size ranging from one to five investors).12
The investors expressed a remarkable range of views in their general responses to a country’s announcement of new capital controls. The majority of the investors viewed capital controls as a “cost of doing business” and would adjust their assessment of returns in the country by incorporating the
additional cost. Several investors, however, were more negative, interpreting controls as indicating an “anti-investor bias of the country,” “an increase in policy uncertainty in the future,” “a government that does not know what to do,” or a “lack of stability in economic policy”. These more negative views ranged from making “investors more nervous” to being interpreted as “a draconian policy” that would severely deter foreign investment. In sharp contrast, other investors had a favourable reaction to some examples of new controls. Several investors viewed capital controls as potentially making a country more attractive if it showed the country was addressing potential vulnerabilities due to a rapid expansion of credit related to capital inflows. They implied that the controls could raise long-term returns in the country— consistent with what is modelled in Korinek (2010). One large investor even saw controls as a buying opportunity as he could “avoid the herd” by buying assets that others were selling.
In each group the investors represented the same company, but usually were from different divisions or managed different types of funds. Each investor had a mandate for some international exposure—ranging from global funds with small exposure to emerging markets to funds that focus entirely on emerging markets within a specific region. Otherwise the funds were selected to
represent a diverse group. About half of the investors focused on equity funds and half on bond funds (with about one-quarter of the investors holding both asset classes). About half the investors ran mutual funds, and the other half was an assortment of hedge funds or managers of funds for a specific client (a wealthy investor, pension fund or government agency). Most of the investors managed medium- or large funds or were part of a larger asset management company or investment bank, although two investors represented smaller, stand-alone funds. We focused on three topics: (1) their general response to a country’s announcement of new capital controls; (2) how this affected their investments in the
country/asset class on which the controls were applied; and (3) how this influenced their investments in other countries/asset classes. For concreteness, we often focused on the recent controls in Brazil
(discussed in Section 3), but then asked for more general responses and reactions to other specific cases of controls recently implemented (such as Peru and Indonesia in 2010).
12
All interviews were conducted under the condition that the identity of the fund manager, the fund, and the fund’s positions were confidential.
7
When asked to move from a general evaluation of controls to the specific issue of how they would adjust their portfolios, the variation in responses was correlated with the type of fund the investor managed. Most equity investors stated that most of the recent capital controls in emerging markets were so small that they did not materially affect their portfolio allocations. Their main consideration was that new controls could change their assessment of the government’s general support for foreign investors and whether they were viewed as “market-friendly” or more likely to experiment with “heterodox” policies that raised uncertainty about the investment climate. Bond investors often saw capital controls as having a more meaningful effect as their expected returns were smaller and the tax on fixed income was often higher than on other asset classes.13 Also important in determining the investors’ response was how the manager was compensated. Managers of mutual funds (both equity and debt) expressed frustration that the lower return from taxes was not incorporated in the index on which their compensation was based. Therefore, controls made it more difficult to beat their benchmarks—but they still had limited ability to reduce their holdings as the country’s weight in the benchmark generally did not change.14Some investors also mentioned they would try “to minimize the cost in the country that was already selected” by adjusting which assets they held or how their transactions were structured.
Other
investors which focused on absolute rather than relative returns (such as hedge funds) could more quickly reduce country exposure if capital controls reduced their expected absolute return so that it was no longer above their investment threshold.
15
One area on which there was moderate agreement was on how the timing of new capital controls would change investment allocations. Most investors—even those strongly opposed to controls—
In most cases, however, these alternative structures involved some additional cost (in some cases the additional cost almost equalled the cost of just paying the new tax) and/or involved taking on additional risks— especially counterparty risk. Therefore most investors claimed to make minimal use of these alternative structures to evade capital controls, at least for countries such as Brazil where the tax was fairly low. It is unclear, however, how candid investors would be about strategies to avoid the controls.
13 For example, the tax of 2% that Brazil levied on foreign equity investment in 2010 was just a rounding error on one equity investor’s expected return of 10%-15%; he stated it was “less than average daily volatility in the Brazilian equity market” and “equivalent to the 1%-2% cost of trading on the Brazilian exchange before the
controls”. In contrast, one bond investor expected a return of about 6% in Brazil, so that the tax that began at 2% and was increased to 6% would wipe out any profits from investing in Brazil.
14 Capital controls generally do not influence a country’s weight in the benchmark unless they “significantly impeded” foreign investment. This issue is discussed in more detail in Section 4.
15 Investors had a range of suggestions for how to accomplish this. For example, to minimize the cost of investing in fixed income in Brazil, the fund could trade Brazilian bonds issued in NY under NY law to avoid the tax. In many cases, however, since the bonds pay in dollars, the company accrues additional currency risk, which can be reflected in a lower return for the foreign investor. Other investors had more complicated structures to minimize the tax— such as through the creation of “pass-through vehicles”, using local accounts to invest as a domestic resident, interest-rate swap transactions, offshore transactions, or finding alternative structures to label investment as FDI.
8
admitted they would usually not make an immediate portfolio adjustment after new, moderate capital controls were implemented, although there was a good chance they would adjust their flows to the country over time. For example, many stated that the recent capital controls in Brazil would have “the biggest impact on new inflows into Brazil,” but “minimal effect on current allocations.” This suggests that after new controls are put into place, there would be little immediate active portfolio reallocation (although there could be some adjustment due to passive rebalancing from relative valuation changes).The reasons for this lagged adjustment varied across investors. Several investors stated that they usually knew when new controls were coming—and even if they didn’t know the exact day or exact structure of the controls—they would have already priced in some effect on their current holdings.16
A final focus of these interviews was how investors would adjust their portfolio allocations to countries other than the country implementing the new capital controls. Investor responses were highly varied and largely depended on the type and mandate of the fund. For many global fund managers with a mandate that included developed and emerging markets, there was little discussion of reallocation effects after new capital controls were introduced in Brazil. These funds generally had such a small portion of their portfolios in any one emerging market, that even if the controls induced them to sell Brazilian assets, this was such a small amount of new cash that it was within the daily volatility of changes in their cash positions and would not cause a reassessment of portfolio allocation elsewhere. For many hedge funds — which are not benchmarked against a specific index and focus on absolute returns—investors rarely spoke of any reallocation into other countries or assets. They would only invest in assets for which they
expected a return above a certain threshold, and if they had already identified those opportunities, they When the capital controls were actually announced, only the difference between the announced controls versus what was expected would affect portfolio allocations. Other investors said that new capital controls could generate a fundamental rethinking of the attractiveness of a country for investment—but it was only one piece of information that would go into their broad reassessment—and this broad reassessment would take time. For some investors, fund allocations had to be discussed and approved by a committee, and this process generally involved a lengthy process of meetings, documentation and approvals. Therefore, after allocating funds to a country, the investors would “not want to derail the allocation process because of a small tax” and would only adjust investments in the future during the next series of allocation meetings. An additional reason for a lagged response was that one investor wanted to wait and see how other investors responded to the controls, and then respond to the response.
16
One investor claimed that his firm had a short window after the announcement of new controls and before the tax was implemented during which they could shift cash to a Brazilian subsidiary. Then they could draw from these domestic cash holdings to make investments that were not subject to the tax and avoid the tax for several months.
9
would already be invested in them. If capital controls reduced returns in one country or asset so that the return was no longer above their threshold, they would simply sell that asset and keep the cash.A few fund managers, mainly for emerging-market mutual funds, did discuss reallocation strategies after new capital controls. Not surprisingly, these investors also tended to be those who stated they would be more likely to reduce their investments in a country after controls were implemented. There was a range of views, however, on which types of countries would be affected by any reallocation effects. Even for funds that appeared to have similar mandates, it was striking how each fund manager approached portfolio reallocations across countries based on their individual approach to investing. For example, some fund managers focused more on regions, while others prioritized the type of exposure they were getting from each country—such as exposure to growth in China. Other managers, especially of large funds, focused on the size and liquidity of markets. Finally, some investors emphasized the
importance of the government’s attitude toward foreign investment, including their level of concern about capital inflows and capital flow volatility and their tendency to use “heterodox” policies. These types of governments could increase uncertainty and the risks of investing in a country. Section 6, which focuses on measuring the externalities from capital controls, discusses these different approaches towards country portfolio allocation in more detail.
To summarize, these investor surveys provide useful guidance on how to structure an analysis of the effects of capital controls on portfolio allocation. First, the surveys suggest that any immediate effect of capital controls is likely to be small, with a larger impact over time as investors adjust portfolios. Second, the surveys suggest that even though Brazil’s capital controls targeted fixed income more than equities, there still could be significant effects on equity investments if controls cause a reassessment of the overall “anti-investor” or “policy uncertainty” risk in a country. Third, the surveys suggest that any reallocation effects would be greater in mutual funds than hedge funds, and in emerging market funds rather than in global funds that include developed markets. Finally, these surveys show the range of possible effects on investor portfolios—both directly on investment in Brazil as well as indirectly due to different strategies toward reallocation to other countries. This supports the many theoretical models of portfolio allocation which assume that investors have heterogeneous beliefs and therefore hold diverse portfolios (see Broner et al., 2006). This also agrees with the conclusion in Gelos (2011) that: “...any simplistic characterization of the behavior of these funds is likely to be misleading…emerging market funds do not move in tandem as a single herd.” These varied investor responses to capital controls suggest that a complete empirical analysis is necessary in order to fully understand the direction and magnitude of the effects of controls on portfolio investment.
10
3. The Capital Control Events and DataWe analyze the effects of one type of capital control used by one country—the Imposto de
Operaçoes Financeiras (IOF) used by Brazil—which was a tax on foreign portfolio flows into specific
assets. It was primarily focused on investment in fixed income, but then extended to equities and other types of investment. Focusing on this specific control in one country has the disadvantage that the analysis may not generalize to other countries’ experiences with controls or to different types of controls within the same country. We focus on this specific example, however, for several important reasons. First, we can more precisely estimate the effect of the IOF rather than aggregating a range of different controls in different countries, which could have a range of effects and therefore bias estimates toward finding no consistent effect of controls. Second, Brazil is a large emerging market that is fairly open to foreign investors and is a large share of the key benchmarks against which many investors are assessed.
Therefore, capital controls in Brazil would be more likely to generate externalities than in countries where foreign investors have less exposure. Finally, Brazil is a useful natural experiment as it changed the IOF on several occasions in a few years. These changes were well publicized, often garnering substantial attention not only in investment reports but even in the broader business and economics press. For all of these reasons, if there is no evidence of externalities from capital controls in this setting, it is unlikely (although not impossible) that there would be substantial externalities from controls in other countries, especially smaller countries. Therefore, the analysis in this paper should be interpreted as testing if capital controls can have direct effects and externalities on country portfolio allocations and not necessarily if these effects exist in all cases of capital controls.
Our analysis focuses on four episodes when Brazil’s IOF on capital inflows changed during the sample period from January 2006 through July 2011.17 The IOF was originally established in 1993 and has been used intermittently since then. The four episodes on which we focus are:
1) 03/2008 Introduced IOF of 1.5% on fixed income.
2) 10/2008 Reduced IOF on fixed income to 0%.
3) 10/2009 Introduced IOF of 2% on fixed income and equities.
4) 10/2010
Increased IOF to 4% on fixed income; then increased IOF to 6% on fixed income and over next two months adopted a number of restrictions to close loopholes that were used to avoid the tax18
17 Brazil also adopted several prudential measures and other types of controls during this time period, some of which primarily affected foreign investors and foreign exchange, while others affected domestic and foreign investors equally. In the empirical analysis in Section 5, we test for any effect of these changes in prudential measures on portfolio allocations.
; Finance Minister Mantega also announced that other measures were under consideration.
18
For example, these measures included: (1) increased tax from 0.38% to 6% on the margin payments required on derivatives transactions; (2) limited the ability of foreign investors to shift investment from equity to fixed income
11
To analyze the direct impact of the IOF on portfolio investment in Brazil and the externalities on other countries, we use a dataset on international portfolio flows and holdings at the fund level compiled by Emerging Portfolio Fund Research (EPFR). This is a novel database that is only starting to be used in academic research.19 It contains information on daily, weekly, and monthly flows for more than 16,000 equity funds and more than 8,000 bond funds, as well as data on funds’ total assets under management (AUM) in each country at the end of each period. One disadvantage of this EPFR data is that it only includes information on mutual funds and does not include flows through banks, hedge funds, foreign direct investment, or any non-mutual fund investors that could respond differently to capital controls. Partly due to this limited coverage of different types of investors, the data captures only about 5% to 20% of total market capitalization for most countries. Despite all of these shortcomings, the data is believed to be a fairly representative sample of international portfolio flows and is the most comprehensive dataset on international portfolio flows that is currently available at a high frequency with detailed geographic coverage.20For our base case, we focus on monthly EPFR data which covers the period from January 2006 through July 2011. This time period allows us to analyze the effect of several changes in capital controls in Brazil, including the short-lived controls in 2008 and the tax increases in 2009 and 2010. The data is aggregated so that we focus on the investment allocation into each country by each fund group for equity and debt. Table 1 shows the number of observations over the full sample period, with each observation representing an allocation by a fund group into a country in a month. The table also shows total AUM at the end of 2010 for each fund group. At end-2010 the EPFR data covers over four times more AUM in equities than debt; for comparison, international portfolio investment in equities tends to be two-thirds that for bonds.
21
The right side of Table 1 shows the average share of each fund group’s portfolio allocated to Brazil over the full sample period. Most fund groups have little or no exposure to Brazil—which is not surprising as many fund mandates (such as for Emerging Europe) do not include Brazil. The column on the far right shows AUM in Brazil for each fund group at the end of 2007, just before the first capital
This better coverage of equity than debt investment in the EPFR data will be an important factor to consider when interpreting the empirical results.
investment in their 2689 accounts; and (3) restricted foreign investors in the futures market from being able to meet their margin requirements via locally borrowed securities or guarantees from local banks.
19 The only other papers of which we are aware that use this data are: Fratzscher (2012b), Raddatz and Schmukler (2012), and Jotikasthira et al. (2010). Each of these papers addresses very different questions from ours.
20 For example, Jotikasthira et al. (2010) show a close match between EPFR data and portfolio flows stemming from balance-of-payments data.
21
For example, at year-end 2010, cross-border portfolio investment assets in equities and debt were $15.5 trillion and $24.9 trillion, respectively. Source: IMF, Coordinated Portfolio Investment Survey, accessed 03/29/12.
12
control event in our sample. Funds included in the data set had $98.4 billion in equity holdings and $14.1 billion in debt holdings in Brazil at end-2007, capturing 34% and 17% of total foreign portfolioinvestment in Brazil’s corresponding markets at that time.22 In the empirical analysis below, we primarily focus on fund groups that meet two criteria: fund groups that have at least 5% of their AUM in Brazil (averaged over the full sample period) and that have at least $1 billion in AUM in Brazil at year-end 2007 (before the first capital control event in our sample). This limits the sample to fund groups that have enough exposure to Brazil that they would be expected to follow events in the country and consider portfolio changes in response to changes in the IOF.23
Figure 1 graphs portfolio allocations to Brazil for four of these fund groups in our extended sample and the weight of Brazil in the relevant benchmark index.
This also limits the sample to fund groups that are large enough that their actions will not be driven by the idiosyncratic behaviour of a small number of funds in the group. These criteria restrict our initial sample to three fund groups: Global Emerging Market Equities, Global Emerging Market Bonds, and Latin America Regional Equities. These funds capture 26% of foreign portfolio investment in Brazil’s equity markets and 13% in its debt markets at end-2007. We also do sensitivity tests with the larger sample, including the Global and Global ex-US funds that focus on developed countries but have less than 2% of their portfolios in Brazil. This increases the sample coverage to reach almost 40% of foreign investment in Brazil’s equity market by the end of 2010, but less than 10% of foreign investment in Brazil’s bonds.
24
22
Based on data from the IMF’s Coordinated Portfolio Investment Survey, accessed 03/29/12, which reports that total portfolio investment in Brazil at year-end 2007 was $290 billion in equities and $83 billion in debt.
It also graphs the level of the IOF on fixed income (the primary form of the IOF adjusted over this period). Although far from definitive evidence, these graphs show some patterns that are consistent with investors reducing their exposure to Brazil after increases in the IOF. For example, the Global Emerging Market Equity funds were
overweight Brazil (relative to the MSCI benchmark) from the beginning of the sample until the first capital control event. Once the IOF was increased in early 2008, these funds reduced their overweight exposure to benchmark allocations. When the tax was reduced to zero in the fall of 2008, investors increased their exposure to become slightly overweight Brazil again and continued to be overweight relative to the benchmark for much of the period until Brazil raised the tax again in the fall of 2009. The Global Equity funds also show a reduction in foreign portfolio shares allocated to Brazil during the period the tax was in place in 2008 and during 2010 and 2011 when the IOF was increased, despite the smaller share of these funds invested in Brazil. Other periods and funds, however, show different patterns. For
23 The discussions with investors suggested that managers of global funds generally focused their attention on events in the large, developed markets and often did not closely monitor events in emerging markets.
24
The benchmarks for the Global Emerging Market Equity, Latin America Regional Equity, and Global Equity funds are the corresponding MSCI equity indices. The benchmark for the Global Emerging Market Bond fund is JPMorgan’s EMBI Global Diversified index.
13
example in the Global Emerging Market Bond funds, investors switched from benchmark weights to substantially overweight Brazil during 2008 when the IOF was positive.Finally, since our analysis focuses on fund exposure to countries relative to benchmark weights, we drop country holdings that are outside the fund’s mandate (such as allocations to South Africa for a fund with a mandate for Latin America Regional). For the regression analysis, we also only include countries which constitute at least one percent of the relevant benchmark. The resulting sample includes fund-group observations for equity or debt investment in 21 countries (including Brazil) and represents a range of emerging markets around the world. The emerging market countries in the base sample are listed in Table 7.
4. The Model and Estimation
Basic theoretical models of portfolio allocation (i.e., Stulz, 1981) show that an increase in the cost of holding foreign assets will cause investors to reduce the share of their portfolios allocated to those assets (holding everything else constant). Gelos (2011) provides an excellent survey of the series of papers building on this basic framework to analyze portfolio allocation across countries.25 Although none of these papers directly tests for the effect of capital controls on portfolio allocation, several papers show that foreign investors tend to invest less in countries with more restrictions on foreign ownership, weaker investor protection, less transparency, weaker shareholder rights, greater corruption, and a weaker legal framework. These results suggest that new capital controls—which are generally viewed as increasing policy uncertainty, reducing government transparency, weakening investor protection, and providing greater opportunities for corruption—could reduce foreign investors’ portfolio allocations to the country. Another key result from this survey is the role of benchmarks (whether due to compensation structures, fund mandates, or other factors) in determining country shares in investor portfolios.26
More specifically, our analysis builds on Gelos and Wei (2005), which uses a model in which a fund’s portfolio allocation across countries is based on the country’s weight in the benchmark, a fund fixed effect, and an error term. This framework can be derived directly from the International Capital Asset Pricing Model. We also include variables to capture the effect of Brazil’s capital controls on
Both of these results are supported in the investor surveys discussed in Section 2 and provide the framework for our model. In particular, the interviews highlighted the importance to mutual funds—the funds constituting the EPFR data—of market benchmarks in determining country allocations.
25 Also see two additional surveys: (1) Henry (2007) which concludes that lifting controls on foreign ownership of equities leads to increased equity inflows, higher equity market returns, and higher investment; and (2) Forbes (2007) which focuses on microeconomic evidence and concludes that capital controls reduce the supply of capital, raise the cost of financing, and increase financial constraints—especially for smaller firms.
26
Also see Broner et al. (2006), Hau and Rey (2008), Curcuru et al. (2011), and Raddatz and Schmukler (2012), for the importance of benchmarks in international portfolio allocations.
14
portfolio allocations to Brazil (the direct portfolio effect) and allocations to countries other than Brazil (the externality), as well as a set of control variables:𝜔𝑖,𝑗,𝑡= 𝛼𝑖,𝑗+ 𝛾𝐷𝐶𝑜𝑛𝑡𝑟𝑜𝑙𝑡𝐵𝑟𝑎𝑧𝑖𝑙+ 𝛾𝐸𝐶𝑜𝑛𝑡𝑟𝑜𝑙𝑡𝐸𝑥−𝐵𝑟𝑎𝑧𝑖𝑙+ 𝛽 ∙ 𝜔𝑖,𝑡𝑏𝑒𝑛𝑐ℎ𝑚𝑎𝑟𝑘,𝑗+ 𝛿𝜒𝑖,𝑗,𝑡+ 𝜀𝑖,𝑗,𝑡 , (1) where ωi,j,t is the share of the portfolio allocated to country i for fund group j at time t; αi,j is the country-fund-group fixed effect27
In order to focus on how changes in Brazil’s capital controls affect changes in portfolio allocations to different countries, we take the first-difference version of equation (1):
; Controlt Brazil
is the level of Brazil’s IOF if the country allocation (i) is to Brazil;
ControltEx-Brazil is the level of Brazil’s IOF if the country allocation (i) is to any country other than Brazil;
ωi,tbenchmark,j
is the weight of country i in the relevant benchmark for fund group j at time t; χi,j,t is the set of control variables; and εi,j,t is the error term.
Δ𝜔𝑖,𝑗,𝑡= 𝛾𝐷Δ𝐶𝑜𝑛𝑡𝑟𝑜𝑙𝑡𝐵𝑟𝑎𝑧𝑖𝑙+ 𝛾𝐸Δ𝐶𝑜𝑛𝑡𝑟𝑜𝑙𝑡𝐸𝑥−𝐵𝑟𝑎𝑧𝑖𝑙+ 𝛽 ∙ Δ𝜔𝑖,𝑡𝑏𝑒𝑛𝑐ℎ𝑚𝑎𝑟𝑘,𝑗+ 𝛿𝛥𝜒𝑖,𝑗,𝑡+ 𝜇𝑖,𝑗,𝑡. (2) Equation (2) is the base case for the analysis below. It estimates how changes in capital controls in Brazil are related to changes in funds’ portfolio weights allocated to each country. We also estimate the model with the portfolio shares and portfolio weights expressed in logarithmic form, so that we can estimate how changes in Brazil’s capital controls are related to percent changes in funds’ portfolio weights allocated to each country. We assume that the magnitude of any change in capital controls affects the magnitude of any portfolio reallocation (rather than using a 0-1 dummy variable to capture if there is any change in capital controls and assuming that any such change would have an equally-sized effect on reallocations). We focus on testing two hypotheses from equation (2):
• The direct portfolio effect: γD <0, an increase in the IOF decreases the share of funds’
portfolios allocated to Brazil; and
• The externality: γE >0, an increase in the IOF increases the share of funds’ portfolios allocated
to countries other than Brazil.
27 We include a country-fund fixed effect (instead of simply a fund fixed effect as used in papers such as Gelos and Wei, 2005) in order to capture the fact that some funds tend to be overweight or underweight specific countries relative to the benchmark, on average, over the sample period. This could happen for a number of reasons. For example, if a fund allocates a portion of its AUM to countries that are not in its benchmark, then its allocation to countries in the benchmark would, on average, be below benchmark weights. Some large funds also tend to systematically underweight smaller countries (such as equity funds in Colombia and Chile) and overweight larger markets (such as Indonesia and Thailand) as they place a premium on liquidity and the ability to hold large enough positions to have a significant effect on returns versus their benchmark.
15
In order for the coefficient estimates in equation (2) to be unbiased and consistent, it is necessary to make two assumptions. First, changes in the IOF must not be correlated with changes in the country weights in the benchmark indices. In other words:Corr(∆Controlt
Brazil
, ∆ωi,tbenchmark,j) = 0, and
Corr(∆Controlt
Ex-Brazil
, ∆ωi,tbenchmark,j) = 0. (3)
To test if these assumptions are valid, we consulted with senior officials at JPMorgan (which creates one of the benchmark indices) and they clarified that in some cases changes in a country’s capital controls can change its weight in a benchmark index. Stringent capital controls which affect the ability of foreigners to invest in a country or substantially raise the cost to foreign investors will over time reduce the country’s weight in the benchmark.28
The second assumption required for unbiased and consistent estimation of equation (2) is that there is no endogeneity between the share of investors’ portfolios allocated to Brazil and the
government’s decision to adjust the IOF. Although Fratzscher (2012a) examines a broad cross-section of emerging markets and finds no evidence that the introduction of capital controls is systematically related to the size or volatility of capital inflows, it is impossible to dismiss potential endogeneity between capital inflows and Brazil’s adjustments to the IOF.The government would be more likely to take steps to slow capital inflows, such as raising the IOF, when capital inflows to Brazil surge, market returns are high, and funds are increasing their portfolio allocations to Brazil. Figure 2 graphs net portfolio liabilities as a share
Brazil’s IOF during the sample period, however, did not affect Brazil’s benchmark weighting because of “the relatively small size of the tax” and the fact it “did not significantly impede foreign investment”. To confirm this assessment, Table 2 lists changes in Brazil’s weight in the benchmark indices for the three fund groups in our main sample for three months starting with the month that the IOF was raised. The table does not show any clear negative effect of increases in the tax on Brazil’s benchmark weights. There appears to be about an equal chance that the benchmark weight will increase as it will decrease after an increase in the tax. Moreover, the graphs in Figure 1, which show the size of the IOF and benchmark weights for Brazil, also show no evidence that increases in the IOF caused decreases in Brazil’s share in the benchmark indices.
28
MSCI (the most popular benchmark index for emerging market equities) uses a “liquidity inclusion factor” (LIF) to calculate what percent of a country’s stock market index is tradable. Countries with greater capital controls have a smaller LIF and therefore a smaller share in the benchmark. Calculating the LIF (or equivalent measure for other indices) is largely based on the assessment of the company calculating the benchmark, often with substantial input from investors and in some cases discussions with the government. Small changes in capital controls, especially when in the form of a market-based tax that does not directly impede investment but only raises the cost, generally has no effect on the share of a country’s index assessed to be “tradable.”
16
of GDP for Brazil and the level of the IOF on fixed income over time. Although far from a definitive analysis, it supports the hypothesis that the IOF is often increased after portfolio inflows surge and decreased when inflows drop sharply. It is important to highlight, however, that if increased portfolio flows to Brazil occur proportionately with increased portfolio flows to all other countries in the fund, then this would not generate any bias. For example, if investor flows increased to all emerging market funds and this increased investment was allocated to all emerging markets according to existing portfolio allocations, flows would increase to each country, but the portfolio shares dedicated to each country (such as Brazil) would not necessarily change and there would be no bias in estimating equation 2.With this caveat, it is still possible that when capital flows to Brazil increase proportionately more than to other countries in the fund’s portfolio, Brazil’s government is also more likely to increase the IOF. Any such endogeneity, however, would bias estimates of γD towards zero. In other words, if capital
controls have a negative effect on a country’s weight in the portfolio, this endogeneity between portfolio weights and the decision to enact controls would reduce the negative impact of capital controls on portfolio allocations below their actual values and could lead to an inaccurate conclusion that the effect is not significant. Similarly, some plausible omitted variables (such as any positive shock that caused investors to increase their portfolio allocations to Brazil and simultaneously increase the government’s concerns about capital inflows) would also bias estimates of γD towards zero. As a result, the actual
(negative) effect of capital controls on portfolio allocations may be larger than the estimates reported below.
To estimate equation (2), we measure the change (or percent change) in each fund group’s
allocation to each country in the sample as a share of the fund group’s total portfolio, using the EPFR data discussed in Section 3. To measure changes in Brazil’s capital controls, we use the change in the IOF on fixed income (which is the primary mechanism by which Brazil adjusted its controls during the sample period). The investor interviews in Section 2 suggested that many funds only respond to capital controls with a lag, so we allow for a lagged effect over three months starting with the month when the IOF was changed. To measure the benchmark weights, we use the changes (or percent changes) in the most widely used benchmarks that correspond to the fund groups’ mandate and confirm the choice in the investor interviews.29
29
The benchmarks are: MSCI’s Emerging Markets (EM) Index for the Global Emerging Market Equity funds; JP Morgan’s EMBI Global Diversified Index for the Global Emerging Market Bond funds, and MSCI’s Emerging Market America’s index for the Latin American Regional Equity funds.
There are a number of control variables that could be included, so we first estimate the model with no control variables and then with a set of controls that are believed to affect portfolio weights across countries (see Gelos, 2011). Our variable choice is also limited to data that are available at a monthly frequency and across the countries in the sample. The control variables for our base case are:
17
(1) Other Control Events: a dummy variable equal to 1 if country i (other than Brazil) enactednew controls on capital inflows in the last 3 months in the form of a new tax, withholding requirement/URR, or outright ban of purchases that specifically targets foreigners. This variable captures any effects of new capital controls in other countries on the country’s share in the fund’s portfolio. The events included in this variable are listed in Appendix A.
(2) Global Risk: the change in the U.S. VIX index.30
(3) Overweight: the change (or percent change) in the country’s weight held by the fund relative to the country’s weight in the benchmark. This captures portfolio rebalancing.
31
(4) Outperformance: the outperformance of the country’s return relative to the return of the fund group’s benchmark index, calculated as a 6-month moving average. This captures momentum trading, return chasing, or portfolio rebalancing.
32
(5) Interest Spread: the change in the interest rate differential for country i relative to the United States, using 3-month money market interest rates and lagged by one month.
(6) Off- Benchmark Share: the change (or percent change) in the share of the fund’s weight allocated to countries that are not included in the relevant benchmark index.
Table 3 provides more information on the definitions and sources of each of these variables used in the regressions.
5. Direct Portfolio Effects of Capital Controls on Brazil
Table 4 reports the base-case estimates of equation (2) predicting changes (and percent changes) in country-portfolio weights as a function of changes in Brazil’s IOF and changes (or percent changes) in country benchmark weights for the sample of emerging market equity and bond funds described in Section 3. The columns on the left report results without any additional control variables and the columns on the right report results with the full set of control variables described in Section 4 and Table 3. All estimates include robust standard errors clustered by fund group and country. Columns labelled “First Difference” report results when portfolio weights are measured as changes and columns labelled “Log Difference” report results when portfolio weights are measured as percent changes. Throughout the results, we report both specifications as each estimates a different relationship—both of which are of
30 Bacchetta and van Wincoop (2010) and Gourio, Siemer, and Verdelhan (2010) model how changes in global risk can drive portfolio flows. Fratzscher (2012a) and Forbes and Warnock (2012) provide empirical evidence.
31
See Kodres and Pritzker (2002) for a model and Hau and Rey (2008) and Curcuru et al. (2011) for empirical evidence.
32
For empirical evidence on return chasing and portfolio rebalancing, see Bohn and Tesar (1996), Froot et al. (2001), Hau and Rey (2008), and Jotikasthira et al. (2010).
18
interest to understand the portfolio effects of capital controls. The log-differenced specification is more straightforward to interpret as it focuses on percent changes in portfolio weights and gives equal weighting to each country in the sample. The first-differenced specification puts more weight on larger adjustments in portfolio allocations—and therefore greater weight on larger markets. This has the benefit of capturing the major shifts in portfolio allocations of most interest to investors, but results may not be as applicable for smaller markets.Before focusing on the central results on capital controls, it is useful to mention several of the significant coefficient estimates for the control variables, which all follow a priori expectations.33 The coefficient on ωbenchmark is positive, sizeable in magnitude, and consistently significant at the 1 percent level, supporting the claims made in the investor interviews that mutual fund investors closely track changes in their benchmark indices. The negative and significant coefficient on Overweight indicates that funds tend to increase (decrease) their country allocations after they are underweight (overweight), thereby supporting a rebalancing effect when funds deviate from their benchmarks. The negative coefficient on Outperformance has fluctuating significance and suggests that funds may engage in portfolio rebalancing rather than return chasing. The significant negative coefficient on Off-Benchmark
share indicates that when funds increase allocations to countries that are not in the benchmark, they
simultaneously decrease allocations to countries in the benchmark. We have also estimated the full set of regressions with a range of other control variables that have been used in the literature on portfolio flows.34 These additional control variables are rarely significant, even at the 10 percent level, and including different combinations of them has no significant effect on the main results on capital controls as reported below. In fact, although many of the control variables used in the main analysis are
individually significant and including them improves the explanatory power of the regression, they rarely change the key results.35
Next, moving to the central results of this section, the negative and significant coefficient on
ControlBrazil indicates that an increase in the IOF corresponds to lower portfolio allocations to Brazil.
Using the estimate for the first-differenced equation with the full set of controls in column 3, the -0.036
33 The two variables which are not significant in this base specification are also not surprising. The coefficient on Global risk is not significant, undoubtedly reflecting that although changes in global risk may affect total flows into emerging markets, this may not have differentiated affects on individual country weights within a fund. The coefficient on Interest spread is also not significant. This may reflect the various ways in which country interest rates could interact with portfolio allocations. Higher interest rate spreads would be expected to increase capital inflows and fund allocations if they simply reflect a higher return, but if the higher interest rates reflect greater country risk, this could decrease fund allocations.
34 For example, additional controls we used with no effect on the results include: the U.S. TED spread, country i’s change in the exchange rate versus the U.S. dollar, country i’s interest rate, U.S. equity returns, and the intra-month volatility in the country’s interest rates and equity returns.
35
The one exception is that in a few specifications, controlling for capital control events in other countries can occasionally affect estimates of externalities to other “control risk” countries, as discussed in Section 6.
19
coefficient indicates that removing the 6% tax corresponds to funds increasing their portfolio weights allocated to Brazil by 0.22 percentage points over each of the three months starting with the change in the tax. The corresponding -0.062 coefficient in the log-differenced specification in column 4 indicates that the same 6% reduction in the IOF corresponds to funds increasing their portfolio weights allocated to Brazil by 0.37% over each of the three months. Combing these estimates, if the tax was removed at the end of the sample in July 2011, the average portfolio share allocated to Brazil (across all funds in this sample) would increase from 18.0% to 18.2%−18.7% after three months. Although this appears to be small in magnitude, the end of this section discusses the impact on portfolio flows and shows that even these seemingly small changes in portfolio weights can have substantial effects on capital flows, especially when considering more precise estimates for different types of funds.The coefficient estimates on the other variables related to capital controls also yield noteworthy results. The negative coefficient on Other control events provides additional evidence of this direct, negative effect of capital controls; when other countries in the sample increase their capital controls, investors reduce the share of their portfolios allocated to these countries.36
To further explore the timing of the effect of capital controls on portfolio allocations, Table 5 reports several variations of the base specification in Table 4.
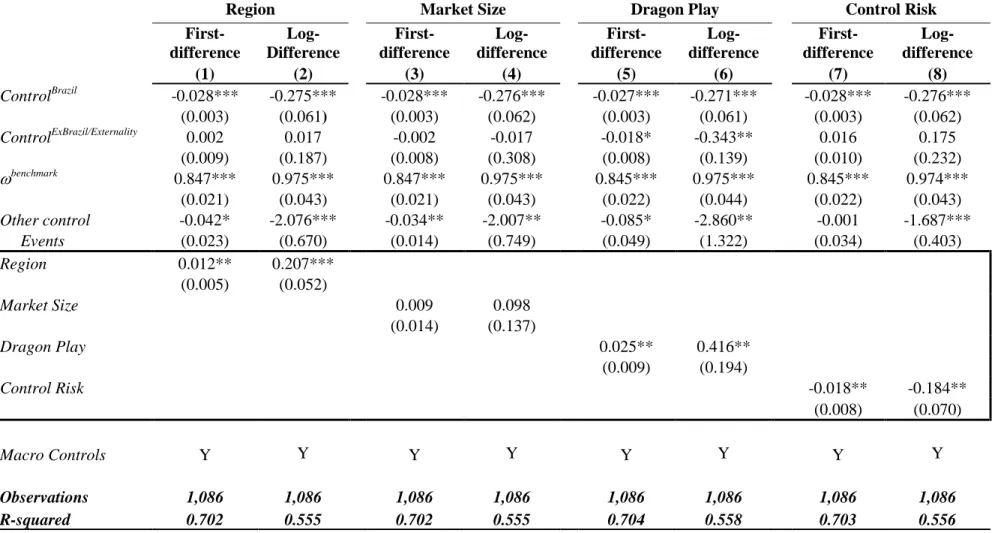
In contrast, the coefficient estimates on ControlEx-Brazil are positive but not significant. This indicates that there are no significant externalities from changes in the IOF on average portfolio allocations to all other countries in the sample.
37
Columns 1 and 2 of Table 5 test for any change in portfolio allocations in the two months prior to changes in the IOF, attempting to capture any advance knowledge or expectations of capital controls that caused investors to adjust their portfolios. The coefficient on Prior EffectBrazil is positive but insignificant—suggesting that some investors may have increased their portfolio shares before new taxes were announced—but the coefficient is imprecisely measured suggesting that any such “front-running” was not widespread.38
36
This coefficient is only significant at the 10 percent level for the first-differenced equation. This may reflect that Other control events includes a number of very different capital controls which had different effects in different countries—an argument made in this paper to instead focus on capital controls in one country.
Columns 3 and 4 test for any immediate effect in the month of the change in capital controls instead of over a three-month window. Columns 5 and 6 test for any additional lagged effect over the next three months (after the three-month window in the base case). The insignificant coefficient estimates for Immediate EffectBrazil and Additional
Lagged EffectBrazil suggest that there is no significant direct effect of changes in the IOF on portfolio
37 We also estimate the base regressions except include only the three events when the IOF was increased, or the one event when the tax was reduced, in order to see if there are asymmetric effects from tax increases versus decreases. In each case, the coefficient on the direct effect of capital controls is negative and significant, providing no evidence of asymmetric effects from increases versus decreases in the tax. Given the limited number of events (only one decrease in the IOF), this result should be interpreted cautiously.
38
In the interviews, several investors mentioned that they sometimes had advance knowledge of a new tax on capital inflows and would put additional funds into the country (such as in a domestic bank or fund) in order to be able to avoid paying the tax after it was increased.
20
allocations to Brazil either in just the one month of the change or later than the three months after the change. This set of results confirms a theme in the investor interviews—that investors do not immediately adjust their portfolios in response to changes in capital controls and instead evaluate the policy changes and investor reactions over several weeks.Next, to better understand how Brazil’s capital controls affected different types of investors, columns 1−4 in Table 6 repeat the base-case regressions for different asset classes: equity and debt. Estimates of the direct effect of changes in the IOF on portfolio allocations to Brazil continue to be negative and significant for each asset class, and estimates of externalities to other countries on average continue to be insignificant. The explanatory power of the regressions for equities, however, is
substantially greater than for bonds (with an R2 of 0.72 for equities versus 0.03 for bonds in the first-differenced equations). This weaker explanatory power for bond funds may reflect the much more limited coverage of fixed income in the EPFR sample (as discussed in Section 3). This also may reflect that equity investors tend to track their benchmarks more closely than bond investors. This is supported by the much larger coefficients on the benchmark weight in Table 6 for equities than for bonds and comments from the investor interviews.39
It is worth highlighting the consistently significant direct effects of changes in the IOF on equity funds in columns 1 and 2 of Table 6, even though three of the four events in our sample consist only of changes in taxes on fixed income and do not include any direct change in the cost to foreigners of
investing in equities. Moreover, the one event which did include a change in the tax on foreign investment in equities only involved a small tax of 2%—which investors described as being too small to significantly affect portfolio allocations given their expectation of double-digit returns in Brazil. This suggests that capital controls affected foreign investors through a signalling effect rather than simply the direct cost of the tax. To further test this hypothesis, columns 5 and 6 of Table 6 exclude any events when changes in the IOF may have affected the cost of investing in equities: when the IOF was increased on equities in October 2009 and when several loopholes were closed that may have affected equity investors in October 2010. The estimates show that investors continue to reduce the share of their equity portfolios allocated
For example, one major “crossover” investor (a fund that invests in both asset classes) stated that bond investors tend to “take longer-term bets on a country’s future interest rate and exchange rate, and therefore are more willing to be overweight or underweight a country.” In contrast, the investor stated that equity investors focus less on these macro statistics and more on company fundamentals, as they can place “bets” on a country by staying close to the country allocations in the benchmark but adjusting their selection of individual companies within that country.
39 Moreover, bond indices are rebalanced more frequently (often on a monthly basis) and are more complicated to calculate and track as they require judgement in terms of which different maturities and structures of bonds to include for each country. In contrast, equity indices are rebalanced less frequently (often annually) and the rebalancing is more automatic as it largely reflects changes in each country’s major market index.