HAL Id: hal-01253850
https://hal.sorbonne-universite.fr/hal-01253850
Submitted on 11 Jan 2016HAL is a multi-disciplinary open access archive for the deposit and dissemination of sci-entific research documents, whether they are pub-lished or not. The documents may come from teaching and research institutions in France or abroad, or from public or private research centers.
L’archive ouverte pluridisciplinaire HAL, est destinée au dépôt et à la diffusion de documents scientifiques de niveau recherche, publiés ou non, émanant des établissements d’enseignement et de recherche français ou étrangers, des laboratoires publics ou privés.
Nanoimprinted, Submicrometric, MOF-Based 2D
Photonic Structures: Toward Easy Selective Vapors
Sensing by a Smartphone Camera
Olivier Dalstein, Davide R. Ceratti, Cédric Boissière, David Grosso, Andrea
Cattoni, Marco Faustini
To cite this version:
Olivier Dalstein, Davide R. Ceratti, Cédric Boissière, David Grosso, Andrea Cattoni, et al.. Nanoim-printed, Submicrometric, MOF-Based 2D Photonic Structures: Toward Easy Selective Vapors Sens-ing by a Smartphone Camera . Advanced Functional Materials, Wiley, 2016, 26 (1), pp.80. �10.1002/adfm.201670006�. �hal-01253850�
DOI: 10.1002/ ((please add manuscript number))
Article type: Full Paper
Nano-imprinted, Sub-micrometric, MOF-based 2D Photonic Structures:
Toward Easy Selective Vapors Sensing by a Smart-Phone Camera
Olivier Dalstein, Davide R. Ceratti, Cédric Boissière, David Grosso, Andrea Cattoni,* Marco Faustini,*
O. Dalstein, D.R. Ceratti, Dr. C. Boissiere, Pr. D. Grosso, Dr. M. Faustini
Sorbonne Universités, UPMC Univ Paris 06, CNRS, Collège de France, UMR 7574, Chimie de la Matière Condensée de Paris, F-75005, Paris, France
E-mail:[email protected] Dr. A. Cattoni, Pr. D. Grosso
Laboratoire de Photonique et de Nanostructures, LPN, Route de Nozay, 91460 Marcoussis, France
E-mail:[email protected] Pr. D. Grosso
M2NP, Faculté des Sciences et Techniques, Campus de Saint Jérôme, Avenue Escadrille Normandie Niemen, 13397 Marseille, France
Abstract
In this work we describe a soft-lithographic approach to fabricate sub-micrometer MOF- based 2D photonic structures. Nanometric Zeolitic Imidazole Framework material ZIF-8 (zinc) was chosen as the sensible MOF material because of its chemical stability and its vapor selective adsorption properties. Two different systems were fabricated: nanopatterned
colloidal ZIF-8 homo- and ZIF-8/TiO2 hetero-structures. Several features (stripes, squares,
etc.) with dimension as small as 200 nm, were replicated on different substrates such as silicon, flexible plastics and even on aluminum cans, over relatively large surfaces (up to 1
cm2). In addition, we demonstrate here that these photonic MOF-heterostructures can be used
as very low-cost sensing platforms compatible with smart-phone technology. This method relies on the evaluation of the change in diffraction efficiency of the photonic MOF-patterns, induced by the MOF refractive index variation, which is simply detected by a CCD camera,
as those integrated in simple smart-phones, without need of complex optical instrumentations for transduction data processing. Performances of the sensors were first evaluated using isopropanol adsorption/desorption cycling as a model case. In addition, a “real” environmental issue was tackled. Selective detection of styrene in presence of interfering water was demonstrated at concentration below the human permissible exposure limit. In-situ ellispometric analyses were also carried out in order to confirm the sensor performances and to propose a mechanism for styrene uptake into the nanoMOFs.
1. Introduction
Metal Organic Frameworks (MOFs) have attracted immense attention because of their large,
tunable porosity and versatile chemistry[1] that makes them appealing for many applications,
including storage, separation,[2] sensing[3] and catalysis.[4] However these materials are
generally synthetized under powder form that is not always suitable for direct application. In order to fulfill their promises, MOFs need to be processed, shaped and integrated in functional
devices.[5] This is especially the case for the utilization of MOFs in the domain of photonics.
Some recent works demonstrated the integration of MOFs into photonic components such as
thin films, [6] Fabry-Pérot,[7] 1D Bragg stacks,[8] or 3D colloidal crystals.[9] In all these
examples the materials were exploited as chemical sensors,[10] for which the signal
transduction relies on the change of refractive index in response to the analyte adsorption into
the porosity.[6] On the other hand, the integration of MOFs into 2D photonic components
haven’t been explored yet. Two dimensional periodical systems are common architectures of many, sophisticated nanophotonic devices such as 2D photonic crystals, gratings, waveguides,
plasmonic antenna[11] or even metamerials.[12] A simple method for the integration of MOFs
into 2D photonic components would pave the way for advanced optical devices in which the original properties of MOFs (high porosity, sorption selectivity..) and of the periodic structures (light confinement, diffraction, guiding..) are rationally combined. The main technological challenge to further develop such devices is that they require fabrication of non-scattering, patterned films at the sub-micrometer scale. With such a perspective, the seemingly simple step aiming at patterning MOFs materials by lithographic approaches has become a very active research domain in the last years and several strategies have been
proposed.[13] MOF crystals have been 2D spatially localized by soft-lithographic
approaches,[14] digital microfluidics,[15] localized electrochemical,[16] growth,[17]
Lithography[21] combined with hot embossing.[22] However, none of these approaches was suitable for fabricating MOFs-based 2D photonic devices since crystals size and/or pattern periodicity were in the micrometer range. In addition, most of the reported patterning methods were not adapted to large-scale fabrication on different substrates, a critical aspect to enable their utilization as sensing platform for instance.
Here we propose a simple and versatile approach to fabricate sub-micrometer MOF- based 2D photonic structures, and we demonstrate their utilization as very low-cost sensing platforms compatible with smart-phone technology. Soft Nano-Imprinting Lithography was exploited as patterning technology because of its easiness, versatility and because it allows fabrication at throughputs necessary for many realistic applications. Zeolitic Imidazole Framework material
ZIF-8 (zinc) was chosen as the sensible MOF material. [23] In general, ZIFs are chemically
and thermally stable materials, a fundamental requirement for any practical device. Study of the gas adsorption and thermal and chemical stability of ZIF-8 (Zn) demonstrated its permanent, high thermal stability (up to 550°C), and remarkable chemical resistance to
boiling alkaline water and organic solvents.[24] In addition, due to its great surface area and
“large porosity”, ZIF-8 (Zn) is the most used in chemical sensing because of the excellent
selective adsorption properties.[23] In order to obtain optical quality patterns and overcome
light-scattering, the material was processed as colloidal solution in which the crystal sizes were inferior to 50 nm. Two different systems were fabricated: nanopatterned colloidal ZIF-8
homo- and ZIF-8/TiO2 hetero-structures. Both patterned systems were obtained by either
nanoimprinting directly a sessile drop of nano-MOF suspension, or by depositing this suspension onto a nanoimprinted sol-gel based titania films. Several features (stripes, squares, etc.) with dimension as small as 200 nm, were replicated on different substrates such as silicon, flexible plastics and even on aluminum cans, over relatively large surfaces (up to 1
cm2). The resulting systems exhibited angle-dependent structural colors characteristic of 2D
diffraction gratings. A new sensing approach based on the variation of optical properties of MOF patterns, induced by the selective adsorption of organic solvent vapors, was investigated. This method relies on the evaluation of the adsorption-induced-color-luminance change, induced by the MOF refractive index variation, which is simply detected by a CCD camera, as those integrated in simple smart-phones, without need of complex optical instrumentations for transduction data processing. Proof of concept and performances were first demonstrated using isopropanol adsorption/desorption cycling as model system. It was then applied to the real industrial problem of the production of polystyrene latex prepared by oil in water emulsions of styrene, for which the detection of reactor leaks and quantitative
analysis of a highly toxic styrene in presence of high concentration of interfering water is a “real” safety issue. We demonstrated that styrene could be selectively detected and quantified by evaluating its adsorption kinetic by the patterned MOF layer. Concentrations as small as 57 ppm, which is below the human permissible exposure limit, could be detected. In all cases, the styrene adsorption was evaluated by optical transduction using the associated luminance variation of the gratings probed by a simple CCD camera, and double checked by direct analysis of the optical properties of a non-patterned film through conventional spectroscopic ellipsometry.
2. Results and discussion
2.1 Fabrication of the patterns
The nanopatterning strategy of porous ZIF-8 materials is based on the utilization of pre-formed ZIF-8 nanocrystals as illustrated in Figure 1. ZIF-8 nanoparticles suspension was
prepared by following the procedure previously reported by Cravillon et al.[25] The reaction
leads to a stable and homogeneous colloidal solution of microporous ZIF-8 nanocrystals in ethanol. The crystal average size was measured equal to 41± 8 nm by scanning electron microscopy (Fig. S1). Thin films exhibiting high optical quality could be obtained by dip coating or spin coating the colloidal solution on silicon substrates. The crystal structure of the particles films was accessed by Grazing-Incident Wide-Angle X-ray Scattering (GI-WAXS) that shows the characteristic pattern of ZIF-8 materials (Fig. S2). The refractive index of the colloidal films was measured to be equal to 1.2 ± 0.05 depending on particle’s packing, in
agreement with previous findings.[6a] In order to characterize the porosity and the vapor
sorption selectivity of the colloidal ZIF-8 films, water and isopropanol adsorption experiments have been carried out at room temperature (Fig. S3). The adsorption experiments were performed by environmental ellipsometric porosimetry (EEP) on a non-patterned film
having a thickness of 155 nm obtained by dip-coating the ZIF colloidal solution at 5 mm.s-1
onto a silicon substrate. The hydrophobicity of the ZIF-8 microporosity was confirmed since no significant variation in refractive index is observed except for very high vapor pressure
(P/P0>0.9), for which water condensation occurs in the inter-particle voids. On the other hand,
isopropanol (i-PrOH) adsorption curve shows a double steps increase of refractive index at low and high relative pressures, due to i-PrOH adsorption into the micropores of the ZIF-8 framework (17% of the total film volume) and the inter-particular mesopores (39% of the
total film volume) as observed in a previous study. [6a] The quantitative analysis of the adsorbed volume fraction was obtained through the BEMA (Bruggeman Effective Medium Approximation) model assuming the refractive index of the dense ZIF-8 material being equal
to 1.54.[6a] In addition, the ellipsometric investigation indicated that capillary condensation
into the ZIF-8 micropores is associated with a weak contraction of the film (around 2%, data not shown).
Concerning nanostructuration of the ZIF-8 nano crystals films, two routes were selected. In the first one, soft nanoimprint lithography was applied directly on a drop-casted ZIF-8 colloidal suspension (see Figure 1a). In the second one, ZIF-8 colloids are deposited onto a
pre-patterned TiO2 layer (see Figure 1b).
Figure 1 Soft-lithographic approaches for the fabrication of (a) nanopatterned ZIF-8 and (8)
ZIF-8/TiO2 heterostructures.
For the first route, a 10 µL-droplet of colloidal solution was first applied on the substrate. The solution droplet was immediately covered by the patterned PDMS stamp without applying any external pressure. The liquid layer was homogeneously spread beneath the PDMS stamp while the stamp’s nanocavities were naturally filled by capillarity. In this configuration, the evaporation of the solvent takes place through the permeable PDMS stamp. Replication of the features and homogeneous packing of the colloidal network were obtained after complete evaporation and de-molding. Finally, the system was consolidated at 130°C for 10 minutes.
An example of replication is shown on the optical photograph in Figure 2(a) that displays a
1cm2 pattern on silicon substrate exhibiting bluish diffracted color due to the presence of a
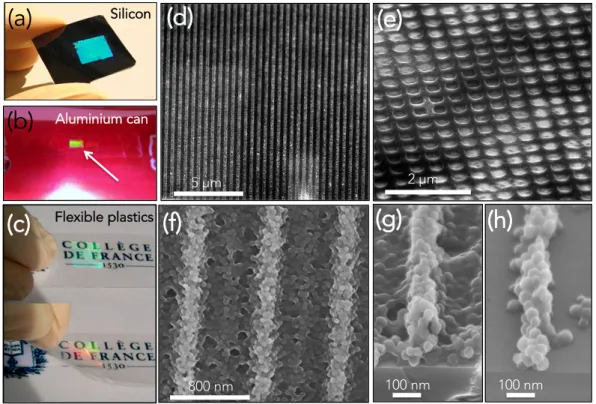
grooves array shown in the SEM micrograph of Figure 2(d). The imprinted patterns are composed of randomly packed ZIF-8 nanocrystals, as shown in the higher magnification SEM photos in Figure 2 (f) and Figure 2(g) (and schematically represented in Figure 1 (a)). The periodicity of the grooves array was equal to 780 nm while both width and height of the lines ranged between 200 and 240 nm (corresponding to 5-6 colloids packed together). A 200nm-thick residual layer composed by a continuous film of ZIF-8 colloids remained at the bottom. The thickness of the residual layer could be partially tuned by modifying the concentration of the initial ZIF-8 colloidal solution. Figure 2(h) shows the cross-section SEM micrograph of a sample obtained from the same replication process but by diluting twice the initial colloidal solution. In this configuration, grooves array that are free of residual layer are obtained. Other pattern morphologies such as square arrays, as displayed in SEM micrograph in Figure 2(c), could be obtained using appropriated PDMS stamps. Being based on the replication of flexible stamp, the method could be extended on a wide range of substrates such as a curved aluminum can (Fig. 2b) or a transparent, flexible polypropylene film (Fig 2c). In these cases the morphology and the quality was similar to those observed on silicon in Figure 2(d).
Figure 2 Photograph of the diffracting ZIF-8 nanopatterned surfaces applied on (a) a silicon wafer, (b) an aluminum can and (c) a flexible polypropylene film. FEG-SEM micrographs of
Silicon Flexible plastics Aluminium can 5 μm 2 μm 800 nm 100 nm 100 nm
(a)
(b)
(c)
(d)
(e)
(f)
(g)
(h)
patterned ZIF-8 colloids showing square (e) and nanogrooves (d) features of at different magnifications (f), (g) and without residual layer (h).
Figure 1(b) displays the second fabrication route for the preparation of nanostructured
TiO2/ZIF-8 multilayer coatings. The fist step consisted in the deposition of sol-gel based
titania layer by spin-coating on silicon. Immediately after evaporation of the volatile solvent, the uncondensed titania precursors layer was embossed by a flexible hard-PDMS/PDMS stamp without applying any pressure using a technique called Degassing Assisted Patterning
applied to the direct embossing of sol-gels derived films.[26] The system was stabilized at
110°C for 5 minutes before demolding, and before being heat-treated at 450°C for 5 minutes
to ensure complete densification and crystallization of TiO2 network. The nanopatterned TiO2
film is thus composed by a dense network of sub-20 nm anatase particles as characterized by SEM and GI-WAXS and shown in Fig. S4 The cross-section view of a typical nanoimprinted
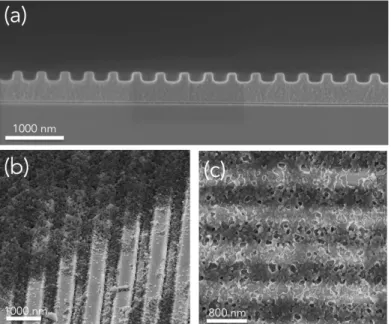
TiO2 film with periodicity of 400 nm is shown in Fig. 3(a). The nanopatterned TiO2 films
were then homogenously covered by ZIF-8 colloids by dip-coating. The morphology of the
final nanostructured TiO2/ZIF-8 system is shown on the SEM photos of Figure 3(b) and (c).
In order to better visualize the whole system a band of the ZIF-8 layer was wiped away from
the surface (see Figure 3 (a)), and clearly revealed the bottom TiO2 pattern, consisting in an
array of lines with periodicity equal to around 1000 nm in this case. In this configuration, the ZIF-8 layer covered the whole surface as testified by SEM images of Figure 3(c) and Figure S4. The thickness of ZIF-8 colloids layer over the lines was evaluated by SEM being equal to 180 nm it could be easily tuned by controlling the deposition conditions.
Figure 3 FEG-SEM micrographs of (a) typical patterned TiO2 film (cross-section view) and
ZIF-8 /TiO2 hetero-structures: (b) scratched zone exhibiting both ZIF-8 covered and
uncovered TiO2 nanogrooves and (c) higher magnification of the deposited zone.
2.2 MOF-based diffraction grating sensors
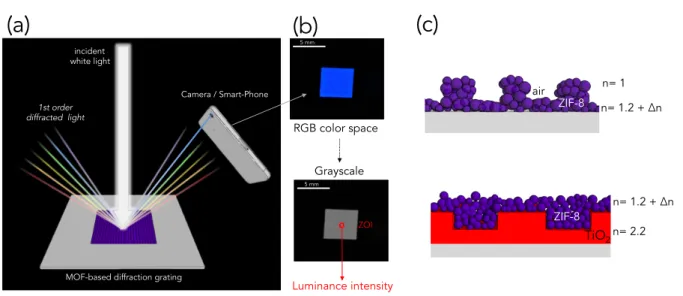
The MOF patterned surfaces have been used as reflective diffraction gratings enabling easy sensing by a simple smart-phone’s camera. The principle is illustrated in Figure 4(a). When the periodical structure is irradiated by a white light, a part of the reflected light is split by diffraction into several beams travelling in different directions. The directions of the beams depend on the spacing of the grating and the wavelength. When light is normally incident on the gratings, the relationship between the grating spacing d and the angle of the diffracted
beams of light 𝜃!is given by the following Bragg’s equation (1):
𝑑 sin 𝜃! = 𝑚𝜆 (1)
where m is the diffraction order and 𝜆 the wavelength of each component of the light. The top image in Figure 4(b) shows the photograph of the ZIF-8 gratings having d-spacing of 1000 nm taken by the photo-camera of commercially available smart-phone. The image was taken
at angle 𝜃!equal to 28° as respect to incident beam. In this configuration, the color of the
pattern looks blue since the 1st order diffracted light has a wavelength equal to 469 ± 5 nm
according to equation 1. The photo taken by the camera is then converted into gray-scale format. The process consists in the conversion of the RGB values to Luminance Intensity for each pixel. The image analysis of a small Zone Of Interest (ZOI) gives an average value of Luminance Intensity that can be directly attributed to the efficiency of the diffracting platform. If one assumes that the height of the nanostructures does not vary, the intensity of the diffracted light depends on the refractive index contrast between the patterned material and the surrounding medium. Opposite tendencies are thus expected for the two ZIF-8 based systems illustrated in Figure 4 (c) while exposed to organic vapors. In the case of directly patterned ZIF-8 colloids, the MOF layer plays the role of “active” diffraction grating. One expects an increase in diffraction luminance created by the increase of the optical index
contrast between the medium (nair =1 : constant) and the grating material (nMOF = 1.2 :
height is negligible, since we detected a contraction of only 2% in volume of the MOF layer
by ellipsometry at high vapor pressure. In the case of ZIF-8/TiO2 heterostructure, the dense
TiO2 bottom layer plays the role of “passive” diffraction grating. The uptake of organic
vapors by the ZIF-8 porous crystals provokes thus a decrease in optical index contrast between the two components and a decrease in luminance intensity.
Figure 4 (a) Illustration of the experimental set-up for the detection by a simple camera; (b) photographs of the diffracting grating in colors and gray-scale taken a smart phone
photo-camera; illustration of the patterned ZIF-8 and ZIF-8/TiO2 heterostructure with opposite
refractive index evolution as function of the vapor adsorption.
The optical responses of the diffraction grating systems have been first tested using i-PrOH
vapor as adsorbate. Both nanopatterned ZIF-8 and ZIF-8/TiO2 gratings were composed of
grooves, having periodicity of 1000 nm. A pure nanopatterned TiO2 was taken as reference.
The variation of the normalized Luminance Intensity with respect to the i-PrOH vapor pressure is shown in Figure 5(a). The two opposite tendencies expected were confirmed. At
moderate i-PrOH relative vapor pressures, below P/P0= 0.6, an increase of luminance is
observed with pure ZIF-8, against a decrease in the case of ZIF-8/TiO2 gratings. No
significant variation in luminance is observed for a reference TiO2 grating alone. In the case
of nanopatterned ZIF-8 gratings, the first luminance increase (I! II) is attributed to the vapor uptake into the microposity while a second and (III!IV) is due to the i-PrOH condensation in the interparticles voids. For high i-PrOH vapor pressures, a significant decrease in luminance is observed due to the irreversible collapse of the nanostructure as illustrated in Figure 5 (b) and shown in the SEM micrograph in Fig. S9. No desorption behavior was thus recorded due
to the loss of the diffraction efficiency of the sample. In the case of ZIF-8/TiO2
5 mm
incident white light
MOF-based diffraction grating
Camera / Smart-Phone
Luminance intensity
1st order
diffracted light ZIF-8
n= 1 n= 1.2 + Δn air TiO2 n= 2.2 n= 1.2 + Δn ZIF-8
(a)
(c)
5 mm ZOI RGB color space Grayscale(b)
heterostructure, three decreases in luminance are observed: a first one at low P/P0 that is
attributed to the vapor uptake into the ZIF-8 microporosity (transition I!II); an additional
decrease below P/P0 = 0.7 (transition II!III) probably due to the i-PrOH condensation at the
ZIF-8/TiO2 interface; and a significant decrease in luminance at P/P0 > 0.9 (transition
III!IV) due to isopropanol capillary condensation within the ZIF-8 interparticles voids. The desorption branch follows the adsorption one except at low pressures where a hysteresis is depicted. This can be attributed to a slower desorption due to the stabilization of the adsorbate
within the MOF microporosity. The great difference in luminance between low and high P/P0
exposure is highlighted in photographs taken by smart phone in Figure 5 (c) for the
ZIF-8/TiO2 sample. One must underline here the better stability of the ZIF-8/TiO2 heterostructure
resulting from the encapsulation of the MOF particles into the hard TiO2 grooves. Differently
from the nanopatterned ZIF-8 system, here the patterned material is TiO2 that is insensitive to
the i-PrOH exposure. The interparticle condensation occurs in the top ZIF-8 layer but after drying the system recovers its initial morphology (Fig. S9). For this reason, only the results of
the ZIF-8/TiO2 gratings will be presented from this point hereafter.
Figure 5 (a) Isopropanol uptake measured by luminance difference; (b) illustration of the
phenomena taking place during adsorption ; (c) photographs of the ZIF-8/TiO2 heterostructure
at 0 and 100% P/P0 of isopropanol, taken by a smart phone at an angle of 28°.
In order to probe the reversibility of the i-PrOH adsorption/desorption in the ZIF-8/TiO2
system, the variation of luminance was investigated during cycling in i-PrOH enriched
-0.6 -0.4 -0.2 0 0.2 0.4 0.6 0 50 100 Nor malised Luminance iPr P/P0 % I II III IV nanopatterned ZIF-8
ZIF-8 / TiO2 heterostructure
nanopatterned TiO2 I II III IV 0% 100% 1 mm 1 mm nanopatterned ZIF-8 ZIF-8 / TiO2
(a)
(b)
(c)
ZOI ZOI ads! des! ads!atmosphere between P/P0 = 0 and P/P0 = 0.5 in air at 25°C as shown and detailed in Fig. S5.
The variation of luminance upon the adsorption/desorption cycles is reproducible, indicating that the material is able to withstand cyclic exposure to the vapor stream. The same results
were obtained by cycling i-PrOH on nanopatterned ZIF-8 gratings (at P/P0 between 0 and 0.5,
irreversible collapsing does not take place) as shown in Fig. S6.
2.3 Selective Styrene Detection
The effectiveness of the detection mode described above for isopropanol vapors is now transposed to a more industrially relevant application such as the selective detection of toxic and volatile styrene monomer in presence of water. Styrene is a building block for synthesis of rubbers, plastics, resins, and polyesters in synthetic industry. In particular, the styrene/water biphasic mixture is the main component of the widely used synthesis of
polystyrene beads by oil in water emulsion polymerization.[27] As a potential human
carcinogen, styrene vapors may lead to irritation of the skin, eyes and the respiratory system. Similar issues have been discussed in the literature: luminescent Eu-MOFs were used to
selectively detect explosive 2,4,6-trinitrophenol (TNP) in water or in vapor phase.[3a, 28]
Several materials have been also exploited to detect styrene (and propanol) by adsorption
including conductive polymer composites,[29] hydrogen-bond acidic polymers,[30]
organoplatinum coatings,[31] monolayer-protected gold nanoparticles,[32] ZnO nanowires[33] or
Pd- gate metal-oxide-semiconductor.[34] However in all these cases the sensitive materials
were applied on different detection platform such as surface acoustic wave (SAW) or resistive sensors. In addition they were not very porous and/or not compatible with a simple optical detection. Due to its high porosity and selectivity, a ZIF-8 material emerges as a strong candidate for ambient optical detection of styrene in presence of water.
The adsorption/desorption behavior of nanoZIF-8 exposed to styrene/water vapors was first investigated on planar films by in-situ ellipsometry as illustrated and detailed in Figure S7. The generation of vapors was obtained by mixing a controlled proportion of dry air, and air enriched with styrene and water vapors in order to control the composition of the atmosphere, indicated in term of relative vapor pressures (1, 2, 5, 10 %) of styrene and water.
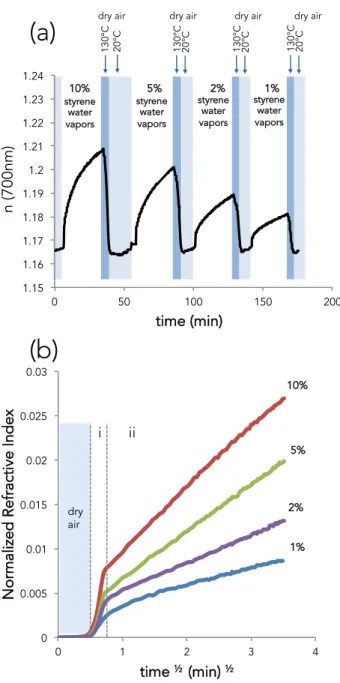
The evolution of the refractive index of a ZIF-8 film exposed to styrene/water vapors generated from liquid mixtures composed of 1, 2, 5, and 10% styrene is shown in Figure 6(a).
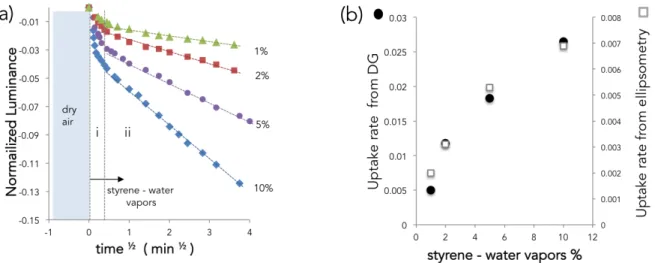
As expected, the refractive index increases due to the selective styrene uptake into the ZIF-8 particles. As a blank, the same experiment was performed only with water vapors and no variation of the refractive index was observed. Heating the coating 5 min at 130°C in dry air allows to fully desorb the molecules and recover the initial state. The increase in refractive index is relatively slow and the system doesn’t reach equilibrium even after 35 minutes of experiment. On the other hand, the styrene uptake rate varies with the vapor pressure, being faster at 10% and slower at 1%. The styrene uptake variations (expressed as normalized refractive index) were then plotted with respect to the square root of time in Figure 6(b). Each uptake is characterized by two successive linear curves, suggesting that the uptake can be described with two successive phenomena that are both limited by diffusion. An adsorption and diffusion mechanism is proposed and illustrated in Fig. S8. The first faster uptake (regime i) could be attributed to the styrene adsorption on the surface of ZIF-8 nanoparticles. This regime would be limited by the diffusion of styrene from the atmosphere to the surface of the material and it ends when equilibrium is reached. Being in equilibrium, the concentration of styrene on the surface is directly related to the styrene relative vapor pressure. The second uptake behavior (regime ii) is very probably due to the progressive styrene penetration into the microporosity towards the core of the ZIF-8 particles. Regime ii would be limited by the diffusion of styrene from the surface into the microporosity.
Figure 6 (a) Evolution of the refractive index of ZIF-8 colloidal film with respect to time for styrene/water vapors adsorption/desorption at different concentration. (b) Plot of the normalized refractive index as a function of the square root of the time for styrene/water adsorptions at different vapors concentrations.
Same detection experiments were also carried out by measuring luminance changes using the
ZIF-8/TiO2 heterostructure as a sensible platform. The evolution of the normalized
luminance as function of the square root of the time is shown in Figure 7 (a). As in the case of isopropanol, the luminance decreases while styrene adsorbs in the film. Similarly to what was observed by ellipsometry, two successive linear regimes are identified, probably due to styrene adsorption onto the surface (regime i) and into the microporosity (regime ii). In both
10% 5% 2% 1%
(b)
0 0.005 0.01 0.015 0.02 0.025 0.03 0 1 2 3 4 Nor malized Refractive Index time ½ (min) ½dry air dry air dry air dry air
1.15 1.16 1.17 1.18 1.19 1.2 1.21 1.22 1.23 1.24 0 50 100 150 200 130°C 20°C 130°C 20°C 130°C 20°C 130°C 20°C 10% 5% 2% 1% styrene water vapors styrene water vapors styrene water vapors styrene water vapors time (min)
(a)
n (700nm) dry air i iiellipsometry and luminance measurements, the concentration-dependent uptake rate can be determined from the slopes of the straight tendencies of regime ii. Figure 7(b) shows the plot of uptake rates as a function of the vapors composition obtained from ellipsometry and diffraction grating (DG) experiments. A good agreement in term of tendency is found indicating that sensing of styrene can be performed by using an extremely sensitive technique like ellipsometry as well as a simple photo-camera.
Figure 7 (a) Plot of the luminance of the ZIF-8/TiO2 diffraction grating with respect to the
square root of time for styrene/water adsorptions at different vapors concentration. (b) Plot of the uptake rates versus vapor concentration obtained by diffraction grating (DG) and ellipsometry.
In order to verify if this approach could be generalized to other organic molecules, the experiment shown in Figure 6 (b) was performed with other organic solvents (Fig. S10). In particular, a ZIF-8 film was exposed to styrene, toluene, cyclohexane and xylene vapors at the
same concentration of 5% P/P0. As shown in Figure S10 (left), for all the systems, the two
regimes could be identified. The amplitude of the refractive index and the variation of the uptake rates determined by fitting the slope of regimes (i) and (ii) for each solvent are reported in the graph in Fig. S10 (right). A significant variation in uptake rates in both regimes is observed for the four solvents. The adsorption rate of the four volatile hydrocarbons are found in the following order for regime ii: cyclohexane > xylene > styrene > toluene. This difference can be attributed to a certain number of factors including a molecular sieving effect and the different chemical affinity between the adsorbed solvent and the ZIF-8 particle surface (regime i) and the inner microporosity (regime ii). This solvent-dependent
behavior suggests that a strategy based on the determination of the adsorption rates can be envisioned to evaluate the contribution of each component in the case of mixed solvents. This could be achieved by approaches of combinatorial sensing by the integration of different
sensing materials in a single platform as reported in the literature.[8c]
3 Conclusions
In this work we demonstrated an versatile approach to fabricate MOF- based 2D photonic
structures by soft NanoImprinting Lithography. ZIF-8 homo and ZIF-8/TiO2 hetero –
structures, exhibiting several features with dimensions as small as 200 nm, were replicated on
different substrates over relatively large surfaces (up to 1 cm2). The resulting systems
exhibited iridescence characteristic of 2D diffraction gratings. A new sensing approach based on the variation of the optical properties of MOF patterns, induced by the selective adsorption of organic solvent vapors, was studied. This method relies on the evaluation of the adsorption-induced-color-luminance change, induced by the MOF refractive index variation, which is simply detected by a CCD camera, as those integrated in simple smart-phones. Detection performances of the sensing platforms were demonstrated using isopropanol as a model adsorbate and a biphasic styrene/water mixture as a relevant environmental contaminant system. Vapors sensing was successfully demonstrated by using ZIF-8 as sensible matrix integrated into 2D diffraction gratings. Interestingly detection of styrene can be based on the dynamic variation of optical properties of the films and not on their absolute values. In this simple proof-of-concept, we didn’t test vapors concentrations below 1 % of styrene; in addition some improvements can be envisioned to improve the transduction method. Even in the case of the less concentrated vapors mixture (1%), the content of styrene in the atmosphere was calculated being equal to 57 ppm, a value that is below the Permissible
Exposure Limit in the US for employees working in chemical industry;[35] other styrene
detection protocols mainly based on gas chromatography[35] ensures better sensitivity but
requires the utilization of bulky, expensive instrumentations. Importantly, this approach based of MOF diffraction gratings allows an easy optical detection by using a simple and accessible tool such as the camera of a smart phone that can be potentially interfaced with image analysis applications for real-time air-quality monitoring.
Master and PDMS-based stamp fabrication
The silicon master mold were fabricated by electron beam lithography at 100 KeV (Vistec 5000+) and reactive ion etching. An A7 PMMA positive-tone resist (495PMMA A Resists, solids: 7% in Anisole) was spin-coated on a 2-inch Si(100) wafer and baked for 45 min at 160 °C. The sample was exposed at 10 nA with a dose of 1300 µC/cm2, developed for 45 sec in a solution of Methyl-isobutyl-ketone (MIBK) and Isopropanol (mixture 1:3), rinsed in Isopropanol and gently dried with pure nitrogen gas. The pattern was transferred by reactive ion etching using a SF6/CHF3 gas mixture.
The anti-sticking treatment was performed using 1H,1H,2H,2H-Perfluorooctyltriethoxysilane (POTS) by chemical vapor deposition method. A sealed glass Petri dish containing the Silicon master and several drops of POTS was heated in an oven at about 120 °C for 1 h to enable the reaction between the OH groups on the Si substrate surfaces and the POTS and then
maintained at about 150 °C for 2 h to remove the unreacted POTS molecules.[36]
A bi-layer PDMS/PDMS stamp was then replicated first by spin-coating a thin hard-PDMS layer on the silicon master and secondly by casting a mixture of commercial available (RTV615 from GE) two components solution (1:10) on top. The bi-layer hard-PDMS/PDMS stamp was degassed and soft-baked at 60 °C for 48 h. Finally, after being peeled off from the
silicon master, the bi-layer stamp was treated with trichloromethylsilane TMCS.[37]
ZIF-8 homo- and ZIF-8/TiO2 hetero structures fabrication
The synthesis of the ZIF-8 nanoparticles followed the conditions reported by Cravillon et
al.[25] A solution of Zn(NO3)2.6H2O (2.933g, 9.87 mmol ; 98% Sigma-Aldrich) in 200 mL of
methanol (100% VWR Chemicals) is poured in a solution of 2-methylimidazole (6.489g, 79.04 mmol ; 99% Sigma-Aldrich) in 200 mL of methanol under stirring at room temperature. After 1h, the nanocrystals are separated from the milky solution by centrifugation at 20000 rpm for 15 min. Nanoparticles were redispersed in absolute ethanol and centrifuged 3 times to remove the unreacted species.
For the patterning of ZIF-8 nanostructures, a 10 µL-droplet of colloidal solution was first applied on the substrate. The solution droplet was immediately covered by the patterned PDMS stamp without applying any external pressure. The liquid layer was homogeneously spread beneath the PDMS stamp while the stamp’s nanocavities were naturally filled by capillarity. In this configuration, the evaporation of the solvent takes place through the permeable PDMS stamp. Replication of the features and homogeneous packing of the
colloidal network were obtained after complete evaporation and de-molding. Finally, the system was consolidated at 130°C for 10 minutes.
For the fabrication of ZIF-8/TiO2 heterostructures, titania thin films were first prepared from a
solution composed of TiCl4/H2O/Ethanol (TiCl4 99% Sigma-Aldrich) with a respective molar
ratio of 1/6/50. After complete dissolution and homogenization, a layer of solution was deposited on silicon wafers by spin-coating at 2500 rpm for 10s under a relative humidity of 40%. In the same time, the PDMS stamp was pumped 10 min under vacuum and then readily applied on the as-deposited titania thin film. After 1 min at room temperature the thin film surrounded by the PDMS stamp was heated at 100°C for 5 min on a hot plate. The PDMS stamp was then removed and the titania thin film was finally calcinated at 450°C for 5 min on
a hot plate. ZIF-8 coating was deposited on nanoimprinted TiO2 gratings by dip-coating with
a withdrawal speed of 8 mm/s.
Characterization
Ellipsometry measurements were performed on a UV-visible (from 240 to 1000 nm) variable angle spectroscopic ellipsometer (VASE - 2000U Woollam), and the data analyses were performed with the Wvase32 software using Cauchy models. Environmental ellipsometry porosimetry involves a dynamic in situ monitoring of the refractive index and the thickness of the film upon variation of the relative vapor pressures between 0% and 100% inside the analysis chamber. Microscope images showing the film structure were collected using a field-emission gun scanning electron microscopy (FEG-SEM - Hitachi SU7000 instrument). Grazing incidence wide-angle X-ray scattering (GI-WAXS) was recorded using a Rigaku S-MAX 3000 with simultaneous small angle X-ray scattering (SAXS) capabilities, on an image plate.
Detection experiments
The photocamera-assisted detection experiment is schematically illustrated in Figure 4 and it was performed in a closed black box in order to avoid interferences with ambient light. Specific windows and connections were built for irradiation and detection and to allow vapors injection into the closed box. The diffracting grating samples were irradiated by a white LED (ZEISS CL 6000 LED) perpendicularly to the substrate. For each experiment, the intensity of
the incident light was tuned between 0,1 and 3 W/cm2 in order to achieve reasonable
diffracted light avoiding saturation in the diffracted images. A commercially available smart-phone I-Phone 3GS (photo camera resolution 3 MegaPixel) was used for the i-PrOH detection while a steady photo-camera Manta G125CIRC (resolution 1.3 MegaPixels) was used for the
longer styrene adsorption detection. The photo camera was place at an angle of 28° as respect of the incident light and at distance of 30 cm from the sample.
Supporting Information
Supporting Information is available from the Wiley Online Library or from the author.
Acknowledgements
We thank David Montero for his support for electronic microscopy (Institut des Matériaux de Paris Centre FR2482). We acknowledge the financial support from CNano Region Ile-de-France and the Labex Matisse.
References
[1] N. Stock, S. Biswas, Chemical Reviews 2012, 112, 933-969.
[2] J. R. Li, R. J. Kuppler, H. C. Zhou, Chem. Soc. Rev. 2009, 38, 1477-1504.
[3] a) X.-Z. Song, S.-Y. Song, S.-N. Zhao, Z.-M. Hao, M. Zhu, X. Meng, L.-L. Wu, H.-J.
Zhang, Advanced Functional Materials 2014, 24, 4034-4041; b) S.-N. Zhao, L.-J. Li, X.-Z. Song, M. Zhu, Z.-M. Hao, X. Meng, L.-L. Wu, J. Feng, S.-Y. Song, C. Wang, H.-J. Zhang, Advanced Functional Materials 2015, 25, 1463-1469.
[4] M. Faustini, J. Kim, G.-Y. Jeong, J. Y. Kim, H. R. Moon, W.-S. Ahn, D.-P. Kim,
Journal of the American Chemical Society 2013, 135, 14619-14626.
[5] a) P. Falcaro, R. Ricco, C. M. Doherty, K. Liang, A. J. Hill, M. J. Styles, Chem. Soc.
Rev. 2014, 43, 5513-5560; b) S. Furukawa, J. Reboul, S. Diring, K. Sumida, S.
Kitagawa, Chem. Soc. Rev. 2014, 43, 5700-5734.
[6] a) A. Demessence, C. Boissiere, D. Grosso, P. Horcajada, C. Serre, G. Ferey, G.
Soler-Illia, C. Sanchez, Journal of Materials Chemistry 2010, 20, 7676-7681; b) A. Demessence, P. Horcajada, C. Serre, C. Boissiere, D. Grosso, C. Sanchez, G. Ferey,
Chem. Commun. 2009, 7149-7151.
[7] G. Lu, J. T. Hupp, Journal of the American Chemical Society 2010, 132, 7832-7833.
[8] a) F. M. Hinterholzinger, A. Ranft, J. M. Feckl, B. Ruhle, T. Bein, B. V. Lotsch,
Journal of Materials Chemistry 2012, 22, 10356-10362; b) Z. Hu, C.-a. Tao, F. Wang,
X. Zou, J. Wang, Journal of Materials Chemistry C 2015, 3, 211-216; c) A. Ranft, F. Niekiel, I. Pavlichenko, N. Stock, B. V. Lotsch, Chemistry of Materials 2015, 27, 1961-1970.
[9] G. Lu, O. K. Farha, L. E. Kreno, P. M. Schoenecker, K. S. Walton, R. P. Van Duyne,
J. T. Hupp, Adv. Mater. 2011, 23, 4449-+.
[10] O. Shekhah, J. Liu, R. A. Fischer, C. Woll, Chem. Soc. Rev. 2011, 40, 1081-1106. [11] A. Cattoni, P. Ghenuche, A.-M. Haghiri-Gosnet, D. Decanini, J. Chen, J.-L. Pelouard,
S. p. Collin, Nano Letters 2011, 11, 3557-3563.
[12] D. Chanda, K. Shigeta, S. Gupta, T. Cain, A. Carlson, A. Mihi, A. J. Baca, G. R. Bogart, P. Braun, J. A. Rogers, Nat Nano 2011, 6, 402-407.
[13] P. Falcaro, D. Buso, A. J. Hill, C. M. Doherty, Adv. Mater. 2012, 24, 3153-3168. [14] a) Y. You, H. Yang, J. W. Chung, J. H. Kim, Y. Jung, S. Y. Park, Angewandte Chemie
A. Martens, J. Hofkens, L. Alaerts, B. F. Sels, D. E. De Vos, Adv. Mater. 2010, 22, 2685.
[15] D. Witters, N. Vergauwe, R. Ameloot, S. Vermeir, D. De Vos, R. Puers, B. Sels, J. Lammertyn, Adv. Mater. 2012, 24, 1316-1320.
[16] R. Ameloot, L. Stappers, J. Fransaer, L. Alaerts, B. F. Sels, D. E. De Vos, Chemistry
of Materials 2009, 21, 2580-2582.
[17] S. Hermes, F. Schroder, R. Chelmowski, C. Woll, R. A. Fischer, Journal of the
American Chemical Society 2005, 127, 13744-13745.
[18] P. Falcaro, A. J. Hill, K. M. Nairn, J. Jasieniak, J. I. Mardel, T. J. Bastow, S. C. Mayo, M. Gimona, D. Gomez, H. J. Whitfield, R. Ricco, A. Patelli, B. Marmiroli, H.
Amenitsch, T. Colson, L. Villanova, D. Buso, Nat. Commun. 2011, 2, 8.
[19] a) C. Carbonell, I. Imaz, D. Maspoch, Journal of the American Chemical Society 2011, 133, 2144-2147; b) E. Bellido, S. Cardona-Serra, E. Coronado, D. Ruiz-Molina,
Chem. Commun. 2011, 47, 5175-5177.
[20] C. Dimitrakakis, B. Marmiroli, H. Amenitsch, L. Malfatti, P. Innocenzi, G. Grenci, L. Vaccari, A. J. Hill, B. P. Ladewig, M. R. Hill, P. Falcaro, Chem. Commun. 2012, 48, 7483-7485.
[21] a) G. Lu, O. K. Farha, W. N. Zhang, F. W. Huo, J. T. Hupp, Adv. Mater. 2012, 24, 3970-3974; bB. K. Keitz, C. J. Yu, J. R. Long, R. Ameloot, Angew. Chem.-Int. Edit. 2014, 53, 5561-5565.
[22] C. M. Doherty, G. Grenci, R. Ricco, J. I. Mardel, J. Reboul, S. Furukawa, S. Kitagawa, A. J. Hill, P. Falcaro, Adv. Mater. 2013, 25, 4701-4705.
[23] B. Chen, Z. Yang, Y. Zhu, Y. Xia, Journal of Materials Chemistry A 2014, 2, 16811-16831.
[24] K. S. Park, Z. Ni, A. P. Côté, J. Y. Choi, R. Huang, F. J. Uribe-Romo, H. K. Chae, M. O’Keeffe, O. M. Yaghi, Proceedings of the National Academy of Sciences 2006, 103, 10186-10191.
[25] J. Cravillon, S. Münzer, S.-J. Lohmeier, A. Feldhoff, K. Huber, M. Wiebcke,
Chemistry of Materials 2009, 21, 1410-1412.
[26] C. Luo, X. Ni, L. Liu, S.-i. M. Nomura, Y. Chen, Biotechnology and Bioengineering 2010, 105, 854-859.
[27] C. S. Chern, Progress in Polymer Science 2006, 31, 443-486.
[28] M. Zhu, X.-Z. Song, S.-Y. Song, S.-N. Zhao, X. Meng, L.-L. Wu, C. Wang, H.-J. Zhang, Advanced Science 2015, 2, n/a-n/a.
[29] J. F. Feller, H. Guezenoc, H. Bellegou, Y. Grohens, Macromol. Symp. 2005, 222, 273-280.
[30] Y. Wang, X. Du, Y. Long, X. Tang, Z. Chen, Y. Jiang, Sensors and Actuators B:
Chemical 2015, 206, 252-257.
[31] E. T. Zellers, N. Hassold, R. M. White, S. M. Rappaport, Analytical Chemistry 1990,
62, 1227-1232.
[32] M. P. Rowe, W. H. Steinecker, E. T. Zellers, Analytical Chemistry 2007, 79, 1164-1172.
[33] Y. Li, J. N. Ding, N. Y. Yuan, in Micro-Nano Technology Xiv, Pts 1-4, Vol. 562-565 (Ed.: F. Tang), Trans Tech Publications Ltd, Stafa-Zurich, 2013, pp. 446-451. [34] P. Pandey, J. K. Srivastava, V. N. Mishra, R. Dwivedi, J. Nat. Gas Chem. 2011, 20,
123-127.
[35] 100 ppm according to the Occupational Safety & Health Administration :
https://www.osha.gov/pls/oshaweb/owadisp.show_document?p_table=STANDARDS &p_id=9993
[36] L. Wang, J. Wei, Z. Su, Langmuir 2011, 27, 15299-15304.
[37] A. Cattoni, E. Cambril, D. Decanini, G. Faini, A. M. Haghiri-Gosnet, Microelectronic