HAL Id: hal-00691644
https://hal.archives-ouvertes.fr/hal-00691644
Submitted on 26 Apr 2012
HAL is a multi-disciplinary open access
archive for the deposit and dissemination of
sci-entific research documents, whether they are
pub-lished or not. The documents may come from
teaching and research institutions in France or
abroad, or from public or private research centers.
L’archive ouverte pluridisciplinaire HAL, est
destinée au dépôt et à la diffusion de documents
scientifiques de niveau recherche, publiés ou non,
émanant des établissements d’enseignement et de
recherche français ou étrangers, des laboratoires
publics ou privés.
Comparison of 3D Deformable Models For in vivo
Measurements of Mouse Embryo from 3D Ultrasound
Images
Bo Qiu, Patrick Clarysse, Johan Montagnat, Marc Janier, Didier Vray
To cite this version:
Bo Qiu, Patrick Clarysse, Johan Montagnat, Marc Janier, Didier Vray. Comparison of 3D Deformable
Models For in vivo Measurements of Mouse Embryo from 3D Ultrasound Images. International
Ul-trasonics, Ferroelectrics, and Frequency Control (UFFC’04), Aug 2004, Montreal, Canada. pp.1-10.
�hal-00691644�
Comparison of 3D Deformable Models For in vivo
Measurements of Mouse Embryo from 3D Ultrasound Images
1
Bo Qiu,
1Patrick Clarysse,
1Johan Montagnat,
1,2Marc Janier,
1,2Didier Vray
1CREATIS, UMR CNRS 5515, INSERM U630, 69621 Villeurbanne, France
2
ANIMAGE, CERMEP, 59 Bd Pinel, 69003 Lyon, France
clarysse@creatis.insa-lyon.fr; vray@creatis.insa-lyon.fr
Abstract
In this paper, we are interested in the analysis of the 3D shape of mouse embryo from 3D ultrasound (US) images acquired using an experimental ultrasonic system. Two approaches for the 3D segmentation of mouse embryo are evaluated. The first one is the simplex-mesh deformable surface and the other one is a deformable elastic template. The methods are compared qualitatively by evaluating the segmentation results and quantitatively by computing shape parameters.
Keywords:
3D segmentation, deformable models,ultrasound imaging, small animals imaging
1 Introduction
As 3D ultrasound images become available, there is a growing need for the development of image analysis tools in order to automatically detect specific structures, extract their 3D shape and compute shape characteristics (volumes, dimensions…) [1],[6]. In the context of this paper, we are interested in the analysis of the 3D shape of mouse embryo from 3D ultrasound (US) images acquired using an experimental ultrasonic system. Automatic segmentation of structures from images is a difficult and still opened problem in the image processing field. Among the existing segmentation methods, the deformable model based techniques rely on a prior shape model of the structure. These methods have been widely used in various contexts, especially in medical image analysis. However, the methods have to be adapted according to the specific properties of ultrasound images (low signal to noise ratio, presence of speckle, not well defined structure boundaries). From the anatomical point of view, at least two structures (the embryo and the placenta plus amniotic liquid) can be extracted separately or even simultaneously by iteratively deforming the prior 3D anatomical model.
In this paper, we evaluate two deformable model techniques for the extraction of embryo in 3D US images. The first one is the simplex-mesh based deformable surface model (SMD method) [2],[5]. The second model is named the Deformable Elastic Template (DET method) [3],[4]. The main difference between the two methods is that in the SMD model, surface boundaries of structures
are represented by simplex meshes on which image forces are applied while in the DET method, both boundary and interior of the objects are modeled by an elastic material. Both methods rely on the minimization of energy functional but respective energy minimization schemes differ.
Methods comparison is conducted on 3D phantom images and 3D images from in vivo acquisitions of mouse tumor and embryo. The segmentation results obtained by the two methods are compared as well as shape characteristics such as volume and object principal dimensions.
2 Material and methods
2.1 Ultrasound data
• Phantom image
Acquisition has been conducted to image a 3D phantom containing an ellipsoid inclusion (egg shape). It is composed of a mixture of agar (4% by weight) and gelatin (8%). The acquisition was performed using a 5.5-8MHz US system with a 2D probe mounted on a motorized table to perform a 3D acquisition.
• Mouse imaging
Acquisition of a tumor and an embryo were performed
in vivo on mice using a 20MHz transducer displaced
mechanically. 3D data were acquired as a series of 2D images, incrementing the position of the probe using a step by step motor.
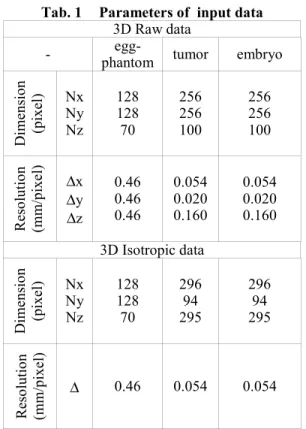
Some parameters of the raw data volumes are summarized in Tab. 1. As required by the segmentation methods presented in the next section, isotropic volumes were generated using a linear or cubic interpolation method. Dimension and resolution of these new volume data are given in the same table.
2.2 3D segmentation method
• SMD method
According to [2], SMD method belongs to the category of discrete deformable models as objects surface is represented by discrete simplex meshes. A simplex mesh [7] is a discrete model representation with a constant vertex connectivity. 2-simplex meshes are used to represent surfaces.
Tab. 1 Parameters of input data
3D Raw data
- phantom egg- tumor embryo
D imens ion (pixel) Nx Ny Nz 128 128 70 256 256 100 256 256 100 Reso lu tio n (mm/ pi xel ) ∆x ∆y ∆z 0.46 0.46 0.46 0.054 0.020 0.160 0.054 0.020 0.160 3D Isotropic data D imens ion (pixel) Nx Ny Nz 128 128 70 296 94 295 296 94 295 Reso lu tio n (mm/ pi xel ) ∆ 0.46 0.054 0.054
Each vertex of 2-simplex meshes is connected to three, and only three neighbors (as shown in Figure 1 (a)). 2-simplex meshes are topologically dual to triangulations as illustrated in Figure 1 (b).
(a) 2-simplex mesh (b) triangulation dual to
a simplex mesh Figure 1 Simplex mesh
The surface representation affects the possible evolution of a model. As with most deformable models, the surface evolution in the SMD method is driven by the minimization of an energy functional E, which is composed of 2 terms including an intrinsic regularizing term Ereg and a data term Eext. The energy of a surface S is
defined by:
(S)
E
+
(S)
E
=
E(S)
reg ext (1)If vi denotes one vertex of S, equation (1) derives in:
)
(v
βf
+
)
(v
αf
+
dt
dv
γ
=
dt
v
d
i ext i int i i 2 2 (2)In this case, the internal force is a curvature regularity term computed by averaging the simplex angle of the surface at each vertex over a neighborhood. The simplex angle is a geometric parameter intrinsic to the simplex mesh representation that is related to the notion of curvature. It ensures that the modeled object will have a smooth surface and no sharp edges.
The external force is computed at each vertex by tracking the highest gradient value detected in the image along the surface normal. Thus, it is proportional to the distance to image contour points. The image gradient is estimated by a simple Sobel convolution operator.
The weights α and β tune the relative strength of the internal and the external forces while the damping parameter γ is used to optimize the numerical scheme convergence speed.
• DET method
In the DET method [1],[3],[4], the object is described by an elastic body defined by Young modulus (E) and Poisson coefficient (µ).
Figure 2 Initial template: a 3D ellipsoid
In the context of this study, a 3D ellipsoid (see Figure
2) is taken as the prior model while being considered as a
linear elastic body. The equilibrium of the model is obtained through the minimization of the following global energy functional: data elastic
+
E
E
=
E
(3)In which, Eelastic represents the elastic deformation
energy of the model (the 3D ellipsoid), and Edata is the
energy due to the external image forces. Their respective expressions are:
( )
u
=
(
u)
(
u)dΩ
E
T Ω2
1
elastic∫
S
D
S
(4)( )
u
=
t
u
dΓ
E
Γ data− .
∫
(5)In which, S is a differential operator, D is the elasticity matrix, and u is the displacement vector, with Γ the border of the object domain Ω. The boundary force field
t
is either derived from the gradient of a potential function
P (
t
=
−
grad
( )
P
) computed from an edge map, or a specific force field called gradient vector flow (GVF) [8] which is sometimes more efficient regarding the initialization and the convergence to edges.The minimization process which drives the initial ellipsoid to coincide with the data relies on the Finite Element Method.
2.3 Method Comparison
The shared characteristics by the SMD and DET methods are:
1) Both methods rely on the minimization of an energy function to reconstruct the object as the segmentation result;
2) An initial shape (surface or ellipsoid) is needed and manually positioned in the data/image; 3) Boundary force field is needed to deform the
model. The differences are:
1) SMD is a surface model, which means only the surface of the object is constructed; while DET is a volume model, including the object’s interior in addition to the surface;
2) Based on 3D elasticity theory framework, DET has some physical parameters like E, µ to describe the elastic body;
3) Minimization process is different. DET has clearer physical meaning.
3 Experimental results
Results on Egg phantom
Results obtained on egg phantom data are shown in Figure 3, including two different orthogonal projection images and 3D presentation of the final results.
Parameters of SMD are often changed during processing by manual interaction. They concern the types of transformation, locality parameter, threshold for force field map, etc.; sensitive parameters of DET are adjusted according to successive tests. For all the experiments, a canny operator was used to compute the potential image. Force factor, which weights the external energy part, is set to 50 and displacement threshold (stopping criteria) is set to 0.010 (voxel). Quantitative evaluation is shown in Tab. 2. The results obtained by both methods are close to the true sizes.
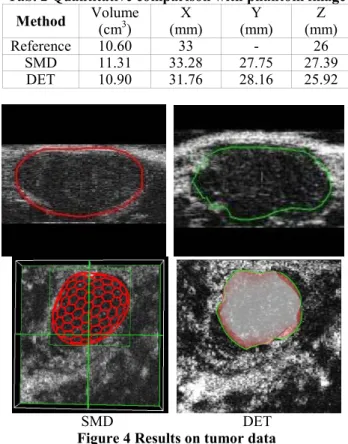
Results on Mouse Tumor
Results obtained with tumor data are shown in Figure 4. With the DET method, force factor is set here to 100. Displacement threshold is set to 0.005.
As shown in Tab. 3, the quantitative evaluation presents significant differences between the two methods. DET method tends to give smaller measures than the SMD model. The true tumor’s sizes lie in between the two results considering the experts’ opinions.
SMD DET
Figure 3 Results on egg phantom data Tab. 2 Quantitative comparison with phantom image
Method Volume (cm3) (mm) X (mm) Y (mm) Z Reference 10.60 33 - 26 SMD 11.31 33.28 27.75 27.39 DET 10.90 31.76 28.16 25.92 SMD DET
Figure 4 Results on tumor data
Tab. 3 Quantitative comparison with tumor data Method Volume (mm3) (mm) X (mm) Y (mm) Z
SMD 173.25 8.34 4.33 8.73 DET 133.25 8.45 3.85 8.16
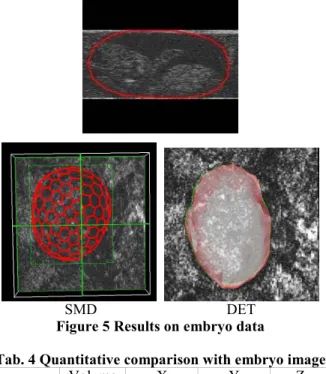
Results on mouse embryo
Results with embryo data are shown in Figure 5. In this test, images are incomplete and only part of the embryo is visible. So neither SMD nor DET can obtain good results except for some partial borders. With the DET method, force factor is set to 150 and displacement threshold is set to 0.005.
SMD DET
Figure 5 Results on embryo data
Tab. 4 Quantitative comparison with embryo image Method Volume (mm3) (mm) X (mm) Y (mm) Z
SMD 309.34 11.00 5.00 9.57 DET 246.75 12.80 4.65 8.81
4 Discussion and Conclusions
There is a clear difference in image quality between egg phantom images, tumor and especially embryo images. The contours of the embryo are in fact very difficult to identify even by eye.
Results on phantom images are pretty similar with the two methods. One can say that generally DET method tends to give smaller measures than the SMD model and is slightly closer to the reference values in this particular test (10.9cm3 vs. 11.31cm3 compared with 10.60cm3).
The same tendency is observed with mouse tumor and embryo, but the differences are more significant especially for volume estimation with 133.25 cm3 (DET)
vs. 173.25 cm3 (SMD) for tumor, and 246.75cm3 (DET) vs. 309.34cm3 (SMD) for embryo. Both methods have the
initialization and convergence problems with in vivo images.
Manual interactions are usually required with the SMD model and made very efficient within a clever and intuitive user-friendly interface. As no interaction was made possible here, DET method automatically performed the segmentation after a manual initialization. Indeed, corrections are still required with in vivo data
with both methods, unless images of better quality are available, and US specific force field is proposed. Also, a judicious combination of the two approaches could certainly allow to obtain accurate segmentation results within a reduced time. This will be the part of our future work.
Acknowledgement
The support of French Ministry of Research, contract Bio-ingénierie 2001, contract #01 H 0143, is gratefully acknowledged.
References
[1] D. Vray, A. Discher, and J. Lefloc’h et al, “3D Quatification of ultrasound Images: Application To Mouse Embryo Imaging In Vivo”, IEEE International Ultrasonics Symposium, München, Germany, October 2002.
[2] J. Montagnat, H. Delingette and N. Ayache, “A review of deformable surfaces: topology, geometry and deformation”, Image and Vision Computing, Vol.19, No.14, Elsevier, pp. 1023-1040, December 2001. [3] Q. C. Pham, F. Vincent, and P. Clarysse et al, “A
FEM-Based Deformable Model for the 3D Segmentation and Tracking of the Heart in Cardiac MRI”, Image and Signal Processing and Analysis (ISPA 2001), Pula, Croatia, pp.250-254, June 2001. [4] F. Vincent, P. Clarysse, and P. Croisille et al, “An
Elasticity-based Region Model and its Application to the Estimation of the Heart Deformation in Tagged MRI”, Proceeding of ICIP 2000, Vancouver, Canada, 2000.
[5] H. Delingette, “General Object Reconstruction Based on Simplex Meshes”, International Journal of Computer Vision, 32(2): 111-146, 1999.
[6] T. R. Nelson, D. H. Pretorius, “Three-dimensional ultrasound imaging”, Ultrasound in Med. & Biol. 24(9): 1243-1270, 1998.
[7] J. Montagnat and H. Delingette, “Globally constrained deformable models for 3D object reconstruction”, Signal Processing, Vol.71, No.2, Elsevier Science, pp. 173-186, December 1998.
[8] C. Xu and J.L. Prince, “Snakes, shapes, and gradient vector flow”, IEEE Trans. Image Processing, 7, 3, pp. 359-369, 1998.