HAL Id: hal-00003762
https://hal.archives-ouvertes.fr/hal-00003762
Submitted on 4 Jan 2005
HAL is a multi-disciplinary open access
archive for the deposit and dissemination of
sci-entific research documents, whether they are
pub-lished or not. The documents may come from
teaching and research institutions in France or
abroad, or from public or private research centers.
L’archive ouverte pluridisciplinaire HAL, est
destinée au dépôt et à la diffusion de documents
scientifiques de niveau recherche, publiés ou non,
émanant des établissements d’enseignement et de
recherche français ou étrangers, des laboratoires
publics ou privés.
Numerical study of the temperature and porosity effects
on the fracture propagation in a 2D network of elastic
bonds.
Harold Auradou, Maria Zei, Elisabeth Bouchaud
To cite this version:
Harold Auradou, Maria Zei, Elisabeth Bouchaud. Numerical study of the temperature and porosity
effects on the fracture propagation in a 2D network of elastic bonds.. European Physical Journal B:
Condensed Matter and Complex Systems, Springer-Verlag, 2005, 44, pp.365.
�10.1140/epjb/e2005-00135-2�. �hal-00003762�
ccsd-00003762, version 1 - 4 Jan 2005
(will be inserted by the editor)
Numerical study of the temperature and porosity effects on the
fracture propagation in a 2D network of elastic bonds.
Harold Auradou1,2, Maria Zei1,3, and Elisabeth Bouchaud1
1 Commissariat `a l’Energie Atomique, DSM/DRECAM/Service de Physique et Chimie des Surfaces et Interfaces, Bˆat. 462,
F-91191, Gif-sur-Yvette cedex, FRANCE.
2 Laboratoire Fluide, Automatique et Syst`emes Thermiques, UMR No. 7608, CNRS, Universit´e Paris 6 and 11, Bˆatiment 502,
Universit´e Paris Sud, 91405 Orsay Cedex, France.
3 Laboratoire d’´etude des Milieux Nanom´etriques, Universit´e d’Evry, Bˆatiment des Sciences, rue du p`ere Jarlan, 91025 Evry
Cedex.
January 4, 2005
Abstract. This article reports results concerning the fracture of a 2d triangular lattice of atoms linked by springs. The lattice is submitted to controlled strain tests and the influence of both porosity and temperature on failure is investigated. The porosity is found on one hand to decrease the stiffness of the material but on the other hand it increases the deformation sustained prior to failure. Temperature is shown to control the ductility due to the presence of cavities that grow and merge. The rough surfaces resulting from the propagation of the crack exhibit self-affine properties with a roughness exponent ζ = 0.59 ± 0.07 over a range of length scales which increases with temperature. Large cavities also have rough walls which are found to be fractal with a dimension, D, which evolves with the distance from the crack tip. For large distances, D is found to be close to 1.5, and close to 1.0 for cavities just before their coalescence with the main crack.
PACS. 62.20.Mk Fatigue, brittleness, fracture, and cracks 62.20.Fe Deformation and plasticity (including yield, ductility, and superplasticity) 81.40.Np Fatigue, corrosion fatigue, embrittlement, cracking, fracture and failure 05.40.-a Fluctuation phenomena, random processes, noise, and Brownian motion 68.35.Ct Interface structure and roughness
1 Introduction
Many materials such as cement or rocks have mechan-ical properties which are greatly influenced by the pres-ence of pre-existing defects such as microcracks and micro-porosity due to their elaboration process [1]. In order to understand the mechanical behavior of such materials, dif-ferent numerical modelling are developed.
The most classical approach consists in using discretiza-tion schemes for the continuum descripdiscretiza-tion. The favorite scheme in fracture and damage mechanics is the finite el-ement method. Yet network models constitute an alter-native scheme which has been developed in order to sim-ulate the effect of heterogenities on the fracture process. Network models can be classified in three categories. The first group is composed of scalar models, which exploit the similarity between the failure of a heterogeneous material submitted to an external load and the breakdown of an array of randomly distributed fuses [3,4]. The results can be used as a very interesting guideline, but in order to compare theory with experiments, it is inevitable to con-sider the vectorial nature of elasticity. In the central force model [5], the bonds are springs which can freely rotate
around the site. The site, which will be called “atom” in the following, undergoes displacements under the action of the local forces acting on it. The third model, which will not be considered here, is the beam model [6] which contains full bond bending elasticity. In this case the elas-tic energy of the beam is the sum of the elongation, shear and flexural energies. This contrasts with the spring model for which only the elongation of the bonds leads to their failure.
For all network approaches, bonds are supposed to model the material at a mesoscopic level, and the aim is to inves-tigate the interrelation between disorder and properties of the network - such as fracture stress or strain, and damage spreading. The surprising result is that properties of the network are related to the system size by scaling laws in-volving non trivial exponents, independent of the precise distribution, and of the microscopic aspects of the consid-ered model [7].
Scaling is also observed on rough fracture surfaces for a large variety of materials [8,9] (from rocks [10] to wood [11] through metallic alloys [12] and glasses[13,14]), which can be described as self-affine structures. Self-affinity [15] means that a profile extracted from such a surface,
de-2 Harold Auradou et al.: Title Suppressed Due to Excessive Length scribed by a heights distribution z(x), where x is a
Carte-sian coordinate along the profile, remains statistically in-variant under the scale transformation z(λx) = λζz(x), where the Hurst or roughness exponent ζ characterizes the roughness of the surface. The fluctuation of the sur-face heights over a length L is given by σz(L) = ℓ (L/ℓ)
ζ . Here ℓ is the topothesy, defined as the horizontal distance over which fluctuations in height have a RMS slope of one [10]. For 3d fracture surfaces, experimental values of ζ are found to be close to 0.8, for most materials [10,11,12,13, 14], with the exception of some materials displaying inter-granular fractures, such as sandstone rocks, where ζ ∼ 0.5 [16]. The exponent 0.5 was also measured on glasses [13] and on metallic alloys [17,18] at length scales smaller than the length scales at which the 0.8 exponent is observed [8, 9].
Experiments conducted on two-dimensional samples re-ported somewhat smallest self-affine exponent; 0.6 ± 0.1 for paper [19] and 0.68 ± 0.04 for the fracture of wood, when the crack propagates along the fibers[20].
In this paper, we present simulations of a mode I macro crack initiated by a notch growing in a bidimensional porous material. The model is precisely described in Section II. The initial pores are defined as regions of the sample where bonds are missing. In our model, the temperature of the network is controlled and its effect on the macroscopic me-chanical behaviour of the system is studied in Section III. In this section, the stress-strain curves corresponding to a samples with no disorder and with 30% porosity are com-pared for two values of the temperature. It is shown that under an increasing strain, the pores will grow into cavi-ties, and merge with each other and with the main crack. Fracture hence proceeds by voids growth and coalescence. The size and the density of the cavities is influence by the temperature. At low temperature, the stress concentration due to the initial notch dominate the junction of cavities which are most likely collinear and located in its vicinity while at high temperature, the cavities spread over the whole materials. This has strong consequence on the fail-ure mechanisum: at low temperatfail-ure, the material frac-tures in a brittle way, while at high temperature, it ex-hibits a ductile behaviour. Once the porous samples are broken, we study the resulting rough profiles, which are, like for real cracks, self-affine with a roughness exponent ζ = 0.59 ± 0.07 that is independent of temperature. The results of the analysis of the morphology of both the frac-ture profiles and the cavities during their growth prior to failure are presented in Section IV. Finally, Section V is devoted to discussion.
2 The model
The model consists in a 2d triangular lattice with nearest-neighbour interactions (see Fig.1) that break as soon as the mutual distance becomes larger than a prescribed thresh-old. More precisely, by noting ri the position of the ith “atom”, the force fij due to the interaction with the j
th
particle can be written as follows: fij = F (|ri− rj|)
ri− rj |ri− rj|
(1) where | · | is the modulus and F (u) is a scalar function defining the force law. Here, we have chosen F (u) to be a linear function of the distance u between atoms: F (u) = −α(u − d) (harmonic potential). The parameters are fixed in such a way that u = d is the equilibrium position and α is the spring constant. In order to explicitly eliminate the irrelevant parameters, we suitably rescale the spatial vari-ables as well time: in this way, both α and d can be fixed to unity in all that follows. Accordingly, all the quantities defined in this paper are dimensionless.
In this work the size of the network is kept constant and is made of 68608 triangular bonds. Due to the orientation of the lattice with respect to the network (see Fig.1), its sizes in unit of atoms distance d is 886.8 for length, and 201 for width.
As far as the sample is concerned, c denotes the fraction of initially missing bonds. c = 0 thus corresponds to a perfectly homogeneous medium. Note that c = cp≡ 0.653 corresponds to the ordinary percolation threshold: for c > cpso many bonds are missing that the lattice is no longer macroscopically connected [21]. Moreover, in the case of central forces, there is a second threshold, the so-called rigidity-percolation threshold (cr = 0.3398 [22,23]) above which the lattice although connected has zero Young mod-ulus. In what follows, the fraction of missing bonds is set to c = 0.3.
A triangular notch of sides 50 atoms is carved at the left side of the lattice to act as a stress concentrator and force a main crack to propagate from the notch tip, along the x direction (see Fig. 1). The lattice is then submitted to a controlled strain which acts vertically along the upper and lower sides of the sample, to which fixed boundary con-ditions are imposed, while free boundary concon-ditions are chosen along the right and left borders.
The application of an external strain which gradually in-creases by small steps of size δǫ = 0.000725 results in a deformation of each spring, hence into atoms motion. Between two successive increases of the strain, the new positions of the atoms are computed. The first step of the calculation consists in determining, for each atom, the force applied by its neighbours is computed, and the var-ious components are added to get the total force acting on the considered atom. Newton’s equation [24] is then solved for each atom i (coordinates ri(t) ; velocity ˙ri(t)). For this purpose, we use the leap-frog algorithm [24,25], which is a modified version of the Verlet algorithm. This algorithm uses positions and accelerations at time t and positions at time t + δt to predict the positions at time t + δt, where δt is the integration step, set to the value 10−2. This step is repeated N times before a new δǫ in-crease of the strain is imposed.
A bond breaks when it reaches a critical length d∗ which is set to the uniform value 1.1. The fracture of a bond transforms its potential energy into kinetic energy, which travels all over the lattice. A local dissipation, i.e. a force
term −γ ˙ri, is added along the left and right boundaries (Fig. 1) where we expect the coupling with the external world to be more efficient in removing kinetic energy from the medium. In the present work, complete damping, i.e. γ = 1 is imposed.
A close look at the amount of kinetic energy present in the system prior to any strain increase reveals fluctuation of the order of 10% with an average, hEi constant over the whole range of strain including the loading and the failure parts of the test. The parameter that controls the amount of kinetic energy present in the network is the number N of iterations used to determine atomic positions. A decrease in N results in an increase of the amount of kinetic energy remaining in the network. The latter is used to define a reduced equivalent temperature
T∗=hEi ǫc
(2) where ǫc = 0.5α(d − d∗)2 is the energy needed to break a single bond (under our conditions ǫc = 0.005). The re-duced equivalent temperature can be seen as the number of bonds that the remaining kinetic energy might break if it was not diluted in the network.
In the present work, two different values of N are used: N = 105and N = 106, which lead respectively to reduced equivalent temperatures T∗= 80 and T∗= 8. Before dis-cussing the quantitative results concerning the structure of damage and the roughness of the fracture profiles, let us here briefly illustrate the phenomenology that can be observed for the two values of T∗.
3 Macroscopic mechanical properties
Let us first examine the stress response at the two differ-ent reduced equivaldiffer-ent temperatures. Figure 2 shows the variation of the stress as a function of strain for two sets of simulations performed at T∗= 80 and T∗= 8, and for two different materials. The first material is initially intact (c = 0), meaning that no bonds were removed. From the second one, 30% of the springs were removed at random (c = 0.3).
After a first stage where the system gets easily deformed − e.g. for strains smaller than 0.005 −, the stress-strain curves all exhibit a linear behaviour. The stiffness de-creases when bonds are removed, from 2.5 ± 0.2 for the intact material to 0.70 ± 0.04 when c = 0.3. This decrease does not seem to be temperature-dependent.
There is another major difference between the behaviours of the two materials. For a given temperature, (see Tab. 1), the initially damaged material breaks at a lower stress but sustains a higher deformation. This is a typical “quasi-brittle” behaviour, where toughening in an intrinsically brittle material is the result of damage created ahead of the crack tip, which screens out the external field under-gone by the main crack.
Let us now focus on the effect of the temperature. While the stiffness is only a function of the density of remain-ing sprremain-ings, the maximum strain reached before the onset
of crack propagation increases with the temperature, as shown in Tab. 1. At low temperature, a sharp decrease of the stress is observed after the critical strain is reached. The strain-stress curve is more rounded for a larger tem-perature. This effect reflects the presence of damage ahead of the crack tip, as can been seen in Figures 3 and 4. It is clear from these figures, that a temperature increase results in an increase of the number of damage cavities. This can be seen on the dynamics of bond failures: as shown in Fig. 5, bonds start breaking at a lower strain when the temperature is increased. For T∗= 8, the num-ber of broken bonds as a function of strain almost follows a step function, and increases abruptly when the crack starts to propagate. This distribution broadens when the temperature is increased up to 80, showing that some of the bonds are broken before the main crack propagation. Despite this change in the shape of the distribution of the number of broken bonds, which has a strong influence on the macroscopic mechanical property of the network, the total number of broken bonds changes only slightly, from 209 for T∗= 8 to 241 for T∗= 80, which only represents approximately 0.15% of the springs.
The other striking difference occurring when the temper-ature is increased is an increase in the vertical shift of the stress-strain curve. In fact, a linear fit of the data indi-cates that the strain-stress curves do not pass through 0. This indicates that an excess of stress is present within the material. This quantity is independent of the disorder and evolves from 2.10−4for T∗= 8 to 2.10−3for T∗= 80. Note that stress is applied via the forces acting on the sur-face atoms: a positive stress excess thus indicates a force acting from the bulk toward the outside and comes from the energy flux going from the network, at temperature T∗, to its ”cold” sides where complete damping of the en-ergy is imposed. Moreover, as for a perfect gas, the stress acting on the sides is proportional to temperature.
This section points out that changes in the network porosity and temperature greatly influence its macroscopic properties. The porosity eases the creation of damage cav-ities, the density of which is shown to be dependent on temperature. At low temperature, the cavities are more likely ahead the crack tip; in the region where the stress is concentrated. When the temperature rises, cavities spread over the network and the crack propagates in the damaged material by meandering from one cavity to another. This phenomenon has a strong effect on the maximum strains that can be sustained by the structure. The deviation from the main direction of propagation results, after failure, in rough fracture profiles. The next section is devoted to the analysis of their statistical properties.
4 Self-affine properties of the fracture lines
After each mechanical test, the positions of atoms belong-ing to the two fracture lines are recorded. Figure 6 shows the four profiles obtained from the two tests performed at T∗ = 8 and 80 on the porous material. In the past
4 Harold Auradou et al.: Title Suppressed Due to Excessive Length years, various methods have been developed to measure
the roughness exponent of self-affine structures. In this paper, two independent methods are considered namely the average wavelet coefficient (AWC) analysis [26] and the min-max method [15].
In the case of the AWC analysis the one-dimensional line z(x) is transformed into the wavelet domain as
W[y](a, b) = 1 √ a Z ψ∗ a,b(x)z(x)dx, (3)
where ψa,b(x) is obtained from the analyzing wavelet ψ (in our case a Daubechies wavelet [27]), via rescaling and translation, ψa,b(x) = ψ((x − b)/a). The AWC measures the average “energy” present in the profile at a given scale, defined as the arithmetic average of |W[y](a, b)|2 over all possible locations b, and for a statistically self-affine pro-file with exponent ζ, it scales as: h|W[y](a, b)|2ib∼ a2ζ+1. For the second method, the profile of length L is divided into windows of width r. The linear trend of the line is then subtracted from the profile for each window. The differ-ence ∆z(r) between the maximum and minimum height are computed on each window and then averaged other all possible windows. For a self-affine profile, a power law behavior is expected :
h∆z(r)i ∝ rζ (4)
For both methods, the self-affine scaling invariance will be revealed by data aligned along a straight line on a log-log plot, with a slope which provides an estimate of ζ. Figures 7 and 8 shows log-log plots of the results of the AWC and the min-max methods respectively, for the four profiles considered. A self-affine domain can be defined in each case and a self-affine exponent can be measured. In the case of the wavelet analysis (Figure 7), ζ is found close to 0.60 ± 0.07 for T∗ = 80 and to 0.55 ± 0.1 for T∗ = 8. For the min-max method (Figure 8), a linear fit indicates that ζ = 0.65 ± 0.1 for T∗ = 80 and ζ = 0.55 ± 0.02 for T∗= 8. The self-affine exponent characterizing the geom-etry of the profiles may appear to depend slightly on the temperature, with a slight increase when the temperature rises from 8 to 80. However, the scaling domain is quite restricted (especially when the AWC method is used), and the difference lies within error bars. When averaged over the imposed temperature, the self-affine exponent is found to be close to 0.59 ± 0.07. The difference in the lower cut-off revealed by the two methods may be attributed to the presence of overhangs on the profiles (see Figure 6), which are not included in the AWC description, as discussed in [28]. Contrary to the value of the exponent, the self-affine correlation length, defined as the upper cutoff of the power-law domain, appears to be temperature-dependant and is found to be close to 100 atoms spacing for T∗= 8, while for T∗= 80 it overpasses the system size (886 inter-atomic spacing).
In this section, we have pointed out that despite the ductility enhancement observed on the macroscopic me-chanical properties when the temperature is raised, the
resulting post mortem profiles have a self-affine roughness characterized by an exponent ζ = 0.59±0.07, independent of the temperature. Yet, the temperature has a strong in-fluence on the crossover length which separates the self-affine regime observed at small scales and the euclidean behavior displayed at large scales. At low temperature, the growth of cavities is a consequence of the disordered structure of the sample, in a region close enough to the main crack tip for the stress to be high enough. Cavities nucleate from missing atoms in this region, and the process zone remains in the vicinity of the crack tip. The fracture profiles which result from the coalescence of the macro crack with the cavities have thus an amplitude which is limited by the lateral extension of the process zone. On the other hand, when the temperature rises, the excess of stress due to the undamped kinetic energy (see Section 3) becomes non negligible compared to the stress created by the notch, and cavities are created everywhere in the lattice. In this case, the macro crack meanders through the whole network, and the amplitude of the post mortem profiles is larger.
Recently experimental and numerical observations of crack propagation in damaged materials suggested the existence of two self-affine domains [9]. At the scale of the cavity, the surface is characterized by an exponent ζ ∼ 0.5 while a larger exponent, ζ ∼ 0.8, is observed at the scale of the ”superstructure” resulting from the coalescence of these cavities. The next section is devoted to the quantitative analysis of the morphology of a single cavity.
5 Structure of the damage zone
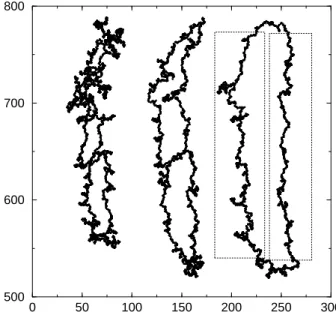
Figure 4 shows clearly that the morphology of the crack profiles is influenced by the presence of cavities. In order to describe quantitatively their evolution, we focus our at-tention on one of the largest cavities. Figure 9 shows the positions of atoms belonging to the external contour of the cavity for three different values of the strain, during crack propagation. Note that the total number of atoms, 1600, belonging to this contour remains unchanged through these three stages, and that the first contour (stage (1)) is al-ready the result of the coalescence of smaller cavities. We clearly see on this figure that as the crack tip gets closer to the cavity, the latter is more open and elongated. More-over, when the distance from the crack tip is important, the contour shows meanders, the importance of which de-creases as the crack tip gets closer. In order to describe the tortuosity of the contours and their possible scale in-variance properties, the average mass method has been selected [29].
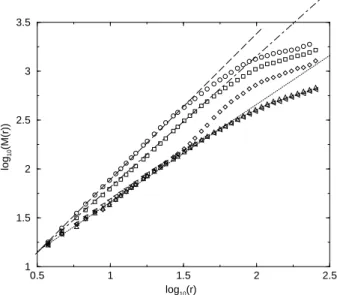
This method is very similar to the box counting method and consists in computing the number of atoms, N (r) lo-cated within a circle of radius r with its center lolo-cated on one of the atoms of the contour. The average of N (r) over all possible circle centers provides hN(r)i. Figure 10 displays the evolution of log10(hN(r)i) with respect to log10(r), for the various contours. For a fractal con-tour, hN(r)i should increase with r following a power law, hN(r)i ∝ rD, where D is the fractal dimension. For a
smooth, Euclidean line, D = 1, while for a line filling completely the plane, D = 2.
Let us first focus on the behaviour of the contour of the cavity at stages (1) and (2). For these two stages, the cav-ity displays a fractal geometry over a domain of length scales spanning from the atom spacing, d, up to approxi-mately 50 d. Its fractal dimension decreases from D = 1.5 (stage (1)) to 1.35 (stage (2)). For stage (3), the aver-age mass displays a more complex behaviour: for length scales smaller than 50 d, the contour has a fractal dimen-sion of 1 but for larger length scales, the fractal dimendimen-sion seems to increase. In order to understand this behaviour, we have analyzed separately the left and ride sides of the cavity normal to the external load (Figure 9). As shown in Figure 10, the two sides are characterized by a fractal dimension D = 1 and no abrupt change is detected. The analysis of the contour of the cavity indicates that it is indeed fractal, with a fractal dimension which decreases continuously when the distance between crack tip and cav-ity decreases. For large distances, the fractal dimension is found close to 1.5, but just before junction between the cavity and the main crack, the contour of the cavity has a fractal dimension of 1.
It must be remembered however that the fractal dimen-sion of a self affine function is not uniquely defined: it strongly depends on the range of length scales considered as well as on the method used. As pointed out in the in-troduction, the height fluctuations of a self-affine profile is characterized by two parameters: the self-affine exponent ζ and the topothesy l which is the scale at which the slope of the profile is of the order of unity. Above l, the fractal dimension is equal to 1 for a 2d profiles. At smaller length scales, the dimension will depend on the method used and is D = 2 − ζ for the average mass method. Because of the fact that in the present work the topothesy of the two sides of the cavity is less than the atom spacing the aver-age mass method is not an appropriate method to analyse possible self-affine nature of the sides of the cavity. As mentioned in Sec. 4, a more appropriate tool to de-scribe the self-affine nature of the profiles is the AWC method. The latter has been applied to the two sides of the cavity (See Fig. 7), they display a self-affine character-istic with an exponent, ζ ∼ 0.6, close to the value obtained for the fracture profiles over length scales ranging from 6 to 50 atoms spacing.
This section was devoted to the analyse of the morphology of a single cavity. Previous works suggested that cavities have rough walls with a self affine geometry character-ized by a self affine exponent close to 0.5 [9]. The dam-age cavities obtained with our modelization is found to be self-affine with an exponent close to the one which charac-terizes the post mortem surface i.e. 0.6. Yet, the self affine regime is observed over a narrow range of scale (less than one decade), making difficult any conclusion. Neverthe-less, the structure of the walls of the cavity was found to be sensitive to the presence of the crack tip. This contrast with the scenario suggested in [9] in which the surfaces created by the failure have a ”quenched” geometry.
6 Discussion
Within the framework of a bidimensional numerical model, we have examined crack propagation and damage spread-ing in a porous material at two temperatures. We have shown that damage develops more at high temperature, which results into a decrease of the fracture strength and, correlatively, into an increase in ductility. This increase in the elongation at failure results from a screening of the external stress by damage. No plasticity is required in the model, which only involves bonds breaking and atom re-arrangements on a local scale. This behaviour is similar to the one observed in quasi-brittle materials [11]-[30].
The crack morphology exhibits in both cases the same self-affine roughness, with an exponent close to 0.6 which agrees with measurement performed on 2d materials [19, 20]. The structure of damage at high temperature is also examined. Damage cavities are shown to be fractal, with a fractal dimension which decreases from 1.5 to 1 prior to coalescence with the main crack. This change in the fractal dimension is due to the increase of the local stress generated by the closer vicinity of the crack tip during propagation. This increase results in the coalescence of small cavities and in atomic rearrangements of atoms on the cavity front which can be interpreted as a partial ”de-pinning”. A similar change in the morphology of cavities with their size was actually observed recently in [31]. The scaling properties of the resulting crack is, in fine, due to the relative positions of damage cavities with respect to each other rather than to their structure, since they are no more fractal when they join the main crack and become part of it. Further studies of the inter-correlations of dam-age cavities for 2- and 3-dimensional systems should lead to a better understanding of the still mysterious morphol-ogy of fracture surfaces.
We are indebted to A. Politi, who is at the origin of the model used here. Many thanks also to R. Kalia, J-P Hulin, D. Bonamy and C. Guillot for their scientific support, and to Y. Meurdes-oif and P. Kloos (CEA-Saclay Computer Science Division) for their technical support in the parallel simulations. HA is sup-ported by the CNRS and ANDRA through the GdR FORPRO (contribution No. XXXX) and the EHDRA (European Hot Dry Rock Association) and PNRH programs.
6 Harold Auradou et al.: Title Suppressed Due to Excessive Length
References
1. Physical Aspects of fracture NATO Sciences Series. 2. J.C. Charmet, S. Roux and E. Guyon, Disorder and
frac-ture, Plenum Press.
3. P.M. Duxbury, P.B. Beale and P.L. Leath, Phys. Rev. Lett. 57, 1052 (1986).
4. A. Hansen and J. Schmittbuhl, Phys. Rev. Lett. 90,045504 (2003).
5. A. Politi and M. Zei, Phys. Rev. E 63, 056107 (2001). 6. H. Herrmann, A. Hansen and S. Roux, Phys. Rev. B 39,
637 (1989).
7. L. de Arcangelis, A. Hansen, H. Herrmann and S. Roux, Phys. Rev. B 40, 877 (1989)
8. E. Bouchaud, J. Phys.: Condensed Matter 9 4319 (1997). 9. E. Bouchaud, Surf. Rev. and Lett. 10, 73 (2003).
10. C. Poon, R. Sayles, and T. Jones, J. Phys. D: Appl. Phys. 25, 1269 (1992).
11. S. Morel, J. Schmittbulh, J. L´opez and G. Valentin, Phys. Rev. E 58, 6999 (1998).
12. E. Bouchaud, G. Lapasset, and J. Plan`es, Europhys. Lett. 13, 73 (1990).
13. P. Daguier, B. Nghiem, E. Bouchaud, F. Creuzet, Phys. Rev. Lett. 78, 1062 (1997).
14. F. C´elari´e, S. Prades, D. Bonamy et al, Phys. Rev. Lett. 90, 075504 (2003).
15. J. Feder, Fractals (Plenum, New York, 1988).
16. J.M. Boffa, C. Allain and J.P. Hulin, European Phys. J. -App. Phys. 2, 2 (1998).
17. E. Bouchaud, S. Nav´eos, J. de Physique (Paris) 15, 547 (1995).
18. P. Daguier, S. H´enaux, E. Bouchaud, F. Creuzet, Phys. Rev. E 53, 5637 (1996).
19. L. Salminen, M. Alava and K. Niskanen, Eur. Phys. J. B 32, 369 (2003).
20. T. Engøy, K.J. M˚aløy, A. Hansen and S. Roux, Phys. Rev. Lett. 73, 834 (1994).
21. D. Stauffer and A. Aharony, Introduction to Percolation Theory, 2nd ed. London: Taylor and Francis, 1992. 22. S. Feng and P.N. Sen, Phys. Rev. Lett. 52, 216 (1984). 23. D.J. Jacobs and M.F. Thorpe, Phys. Rev. E 53, 3682
(1996).
24. R. P. Feynman, R. B. Leighton and M. Sands, The Feyn-man Lectures on Physics, Vol. 1, Addison-Wesley, 1963, Chapter 9 (“Newton’s Laws of Dynamics”).
25. M. P. Allen and D. J. Tildesley, Computer simulation of liquids, Oxford, 1987.
26. I. Simonsen, A. Hansen and O.M. Nes, Phys. Rev. E. 58, 2779 (1998).
27. I. Daubechies, Ten Lectures on Wavelets (SIAM, Philadel-phia, 1992).
28. G. Drazer and H. Auradou, J. Koplik, J.P. Hulin, Phys. Rev. Lett. 92 014501 (2004).
29. H. Auradou and J.P. Hulin, S. Roux Phys. Rev. E 63 066306 (2001).
30. S. Morel, E. Bouchaud, J. Schmittbuhl, G. Valentin, Int. J. of Fracture 114 307 (2002).
31. F. Paun, E. Bouchaud, Int. J. of Fract. 121 43 (2003).
T∗ 80 8 T∗ 80 8
c= 0 ǫσmax 0.014 0.0096 c= 0.3 ǫσmax 0.023 0.022
σmax 0.029 0.024 σmax 0.017 0.013
ǫmax 0.024 0.012 ǫmax 0.029 0.026
Table 1. Mechanical properties of the system as a function of the temperature T∗ for two different fractions of missing
springs c = 0.0 and c = 0.3. ǫmax, σmaxand ǫσmaxstand for the
maximum strain (reached at the onset of complete failure), the maximum stress reached during the test, and the corresponding strain.
Fig. 1. Illustration of the elastic bond network used in the simulations. a) shows the specimen submitted to an external uniaxial tension . b) is a detailed view of the material consisting of atoms initialy placed on a triangular lattice and connected by identical elastic springs. Note that a fixed density of springs is removed before application of the load.
0 0.01 0.02 0.03 0.04 ε 0 0.01 0.02 0.03 σ
Fig. 2. Stress-strain evolution of the system. Circles and squares correspond respectively to c = 0.3 and c = 0 (non-porous material). Filled and empty symbols correspond respec-tively to T∗= 8 and 80.
Fig. 3. Breakdown of the atoms network under strain test performed at the temperature T∗= 8. From bottom to top the
strain is respectively ǫ = 0.0223, 0.0224, 0.0225 and 0.0282.
Fig. 4. Breakdown under tension of a network kept at the temperature T∗ = 80. From bottom to top the strain is
re-spectively ǫ = 0.0217, 0.0231, 0.0225 and 0.0289. 0.015 0.02 0.025 0.03 ε 0 0.005 0.01 0.015 0.02 σ
Fig. 5. Filled and unfilled symbols correspond respectively to T∗ = 8 and 80. Circles show the stress-strain variation for a
porosity c = 0.3. Diamonds show the number of broken bonds verticaly normalised to fit the plot.
8 Harold Auradou et al.: Title Suppressed Due to Excessive Length 0 200 400 600 800 −200 −100 0 100 200
Fig. 6.Fractures profiles obtained after the breakdown of the lattice with c = 0.3. The two top curves correspond to the top and bottom profiles obtained for T∗= 80. The two lowest
profiles are for T∗= 8.
0 1 2 3 log10(a) 0 1 2 3 4 5 6 log 10 (<W(a,b) 2 > b )
Fig. 7. log10h|W[y](a, b)|2ib as function of log10(a) where a is
in unit of d. Circles and squares show the result of the analyse of the top and bottom profiles after failure at T∗= 80 while
di-amonds and crosses are obtained when top and bottom failure profiles obtained at T∗= 8 are considered. The filled triangles
correspond to the average of the analyse of the two sides of the cavity at stage (3) displays in Fig. 9. The dotted lines has a slope of 2ζ + 1 = 2.2 corresponding to a self-affine exponent ζ= 0.6. These results where shifted verticaly for convinience.
0 1 2 3 log10(r) 0.0 0.5 1.0 1.5 2.0 log 10 < ∆ z (r)>
Fig. 8. log10(h∆z(r)i) as function of log10(r). Circles and
squares show the result of the analyse of the top and bottom profiles after failure at T∗= 80 while diamonds and triangles
are obtained when top and bottom failure profiles obtained at T∗ = 8 are considered. These results where shifted verticaly
for convinience. The dotted line has a slope of 0.6 .
0 50 100 150 200 250 300
500 600 700 800
Fig. 9. From the left to the right, pictures of the same cavity at stages (1), (2) and (3) of the test performed on the porous material at temperature 80. The distance from the crack tip is respectively : 393, 359 and 355 atoms spacing. The boxes indicate the left and right sides of the cavity at stage (3).
0.5 1 1.5 2 2.5 log10(r) 1 1.5 2 2.5 3 3.5 log 10 (M(r))
Fig. 10. Log log representation of the average mass M (r) measured within circle of radius r applied to the three cav-ities displayed in figure 9. Cirlcle, squares and diamonds are respectively for cavities 1, 2 and 3. Triangles up and left are for the right and left sides of the cavity (3) displayed in Fig. 9. The long dashed, the dot dashed and the dahed lines have respectively a slope of 1.5, 1.35 and 1.