HAL Id: halshs-01832319
https://halshs.archives-ouvertes.fr/halshs-01832319
Submitted on 7 Jul 2018HAL is a multi-disciplinary open access archive for the deposit and dissemination of sci-entific research documents, whether they are pub-lished or not. The documents may come from teaching and research institutions in France or abroad, or from public or private research centers.
L’archive ouverte pluridisciplinaire HAL, est destinée au dépôt et à la diffusion de documents scientifiques de niveau recherche, publiés ou non, émanant des établissements d’enseignement et de recherche français ou étrangers, des laboratoires publics ou privés.
China’s Global Shipping Connectivity: Internal and
External Dynamics in the Contemporary Era
(1890–2016)
César Ducruet, Liehui Wang
To cite this version:
César Ducruet, Liehui Wang. China’s Global Shipping Connectivity: Internal and External Dynamics in the Contemporary Era (1890–2016). Chinese Geographical Science, Springer Verlag, 2018, 28 (2), pp.202 - 216. �10.1007/s11769-018-0942-x�. �halshs-01832319�
China’s global shipping connectivity: internal and external
dynamics in the contemporary era (1890-2016)
This work is the draft version of the article published in Chinese Geographical Science, 28(2) : 202-216
César DUCRUET
Centre National de la Recherche Scientifique (CNRS) UMR 8504 Géographie-cités
cdu@parisgeo.cnrs.fr
Tel. +0033(0)140.464.000 Fax. +0033(0)140.464.009
Liehui WANG1
East China Normal University (ECNU) School of Urban & Regional Science
lhwang@re.ecnu.edu.cn Tel: +0086(0)21-62233821 Fax: +0086(0)21-62223074
Abstract
China’s global shipping connectivity had been somewhat overlooked as the bulk of related studies predominantly focused on the throughput volume of its own port cities. This article tackles such lacunae by providing a relational perspective based on the extraction of vessel movement archives from the Lloyd’s List corpus. Two complementary analyses are proposed: long-term dynamics with all ships included (1890-2008) and medium-term dynamics focusing on container flows (1978-2016). Each analysis examines China’s maritime connectivity in various ways and ondifferent spatial scales, from the global to the local, in terms of concentration, vulnerability, and expansion. The main results underline the influence of technological, economic, and political factors on the changing distribution of connectivity internally and externally. In particular, China has managed to reduce its dependence upon external transit hubs, to increase the internal connectivity of its own port system, and to strengthen its dominance towards an increasing number of foreign nodes and trade partners through the maritime network.
Keywords: China; connectivity; maritime network; port system; vessel movements
1. Introduction
The global shipping network had become an increasingly popular research topic in the last decade or so (Wang et al., 2016; Ducruet, 2017). Related works are mainly motivated with the analysis of the network’s topological structure and spatial distribution at different levels, from ports to countries and world areas. In the empirical literature however, it remains unclear whether China and its port cities have actually become integrated into this global shipping network, alongside decades of socio-economic and trade development.
Although many aspects of China’s port and maritime activities had been documented extensively from various perspectives from the distant past up to nowadays (Ng and Tam, 2012), the majority of such studies still remain focused on containerization dynamics taking place in the recent period (Rimmer and Comtois, 2009). Another limitation of this multifaceted research field is the dominant focus on specific ports or regions, mainly due to the enormous size of the country. Pioneer works at local level include more qualitative analyses of the vital role of Hong Kong in South China’s port modernization and connectivity (Wang, 1998; Song, 2002); these were later followed by more quantitative approaches to port competition and throughput concentration within main port regions such as the Yangtze port system (Veenstra and Notteboom, 2011; Wang and Ducruet, 2012; Cao et al., 2015; Wu and Chen, 2015; Yang and Wang, 2017), the Pearl River Delta port system (Wang et al., 2012; Liu et al., 2013; Cheng et al., 2015), and the Bohai Rim or Yellow Sea port system (An and Han, 2000; Han and An, 2001; Feng and Notteboom, 2013), to name but a few.
Yet, some studies have provided an analysis of the whole Chinese port system in terms of port throughput dynamics including all commodities and on the very long-term (Wang and Ducruet, 2013), restricted to container throughput in the more recent period such as 1998-2010 (Pan et al., 2014), or focusing on other aspects such as port integration mechanisms and clusters (Wang et al., 2015; Wang and Kuang, 2014). Some studies have even expanded the analysis to the entire East Asian port system (Notteboom, 2006a). A global perspective on the diffusion of containerization across ports of the world classified most (mainland) Chinese ports in the “fourth wave” entitled “global standard” from the mid-1990s (Guerrero and Rodrigue, 2014), defined by the standardization of containerization across the world, the emergence of post-panamax ships, increased regionalization among East Asian countries, and the entry of major Chinese ports in the global shipping network. In such a category, Chinese ports are grouped with mainly transshipment hubs (e.g. Salalah, Gioia Tauro, Colon, Freeport, Tanjung Pelepas)
as well as gateway ports in emerging countries (e.g. Vietnam, Mexico, India, Brazil). A handful of other Chinese ports belonged to the “fifth wave” labelled “peak growth” by the authors, such as Yingkou and Taicang, which benefited from congestion in large gateways, alongside Tangier Med, Caucedo, and Prince Rupert. It is important to mention pioneering works about the maritime connectivity of the Chinese port system (Wang and Jin, 2006; Xu et al., 2007) using graph theory and complex networks as analytical tools.
Yet, very little attention has been paid to the external relations, or shipping connectivity, of Chinese port cities with the outside world, just like studies of maritime forelands and overseas linkages / connectivity in general in port geography for instance (Ng et al., 2014). Port throughput volumes, and other important aspects of ports such as management, planning, and policies, are good proxies of China’s evolving trade relations externally, with a gradual adaptation to global standards in terms of technology and governance. However, they cannot provide a precise understanding of the evolution of shipping flow patterns; namely how Chinese port cities have integrated the global maritime network through successive phases during its contemporary history. Such an approach is particularly relevant nowadays, given the recent emphasis put by the Chinese government on its “One Belt, One Road” vision and policy, and the gradual reintegration of Hong Kong, a major container hub, into China’s territory and economy, since its partial retrocession in 1997.
This article takes its inspiration from a few existing contributions on the matter, with the ambition to propel them further. A first group of studies takes China as the core subject of investigation, questioning its maritime connectivity in various ways. For instance, Comtois (1999) directly addressed China’s port system integration into global container shipping. Although his work provided many clues about interrelated factors such as port privatization, port expansion, the modification of transactional networks and the emergence of a new business environment in China, it did not formally analyze the physical integration through shipping flows. Some years later, Comtois and Wang (2003) as well as Rimmer and Comtois (2005) investigated more directly the changing patterns of shipping lines (e.g., Evergreen, COSCO) that included Chinese ports in their scheduled services, showing important changes in the design of those services at intra- and extra-Asian levels. Looking back in time, Wang et al. (2015) analyzed the spatial distribution of British and Japanese maritime networks in China and Asia in the 1920s, revealing interesting functional and regional differentiations at different scales between the two networks. More focused on specific mainland Chinese ports, Wang and Ng (2011) found that existing studies tended too often to overlook non-hub Chinese seaports,
despite their potential role to rival established hub ports, and shed new light on how China is divided by globalization through trade relations with different regions around the world. Yet, Wang and Hong (2016) adopted a complex network perspective to investigate the changing pattern of cross-strait liner shipping networks between mainland China and Taiwan.
A second group of studies offered a broader vision of China’s maritime connectivity, by shifting from a China-centered view to a more regional (transnational) or even global view. The Chinese geographer Chengjin Wang (2008) can be considered as a pioneer by putting Chinese ports in a global perspective, revealing their paramount dependence upon adjacent (foreign) transshipment hubs. Later on, Ducruet et al. (2010) noticed that although Northeast Asian ports could not compete with major Chinese ports (e.g., Shanghai, Shenzhen, Qingdao, Tianjin) in terms of throughput volume and growth between 1996-2006, Busan and Hong Kong maintained their centrality and dominance in the regional liner shipping network. Such a divergence between throughput volume and network centrality was also found at global level, due to the persistent domination of Singapore and the aforementioned hubs of the Asian and even global systems (Ducruet and Notteboom, 2012). Alongside other possible reasons such as the fiscal system or other geopolitical considerations, the principal explanation was the fact that the main function of (mainland) Chinese ports was to serve domestic demand, yet without any ambition to supersede existing hubs for international transshipment. Barrier effects in the global maritime network linking cities of the world were underlined by Ducruet et al. (2015a) in the case of China. For instance, in 1951, Shanghai stood out for its large demographic size but with limited centrality in the maritime network, being reduced to a minor and peripheral hub in a subnetwork comprising only four other Chinese port cities, mainly due to political circumstances at the time. In the subsequent years under study (1960-1990), its maritime centrality still remained limited, but Shanghai became better integrated within a larger subcomponent of the global network polarized by Tokyo. Other global-level studies such as those by Tran and Haasis (2014), Li et al. (2015), and Xu et al. (2015) remained too aggregated, at the level of large world regions (e.g. East Asia), to account for a precise view of China’s position in global maritime flows.
The ambition of this paper is thus to provide a more dynamic view on the evolution of China’s external connectivity through maritime transport networks, as existing studies remain highly static. In addition, it is our goal to extend the focus to other sectors than sole container shipping. Based on largely untapped data on global vessel movements obtained from Lloyd’s List, a world leader in maritime insurance and shipping intelligence, we propose for the first time to analyze
the changing connectivity of Chinese (port) cities in global maritime flows for two different periods. A long-term perspective including all vessel circulation connecting Chinese ports (1890-2008) mainly serves to verify the impact of political and technological change on shipping connectivity. The more recent period on container shipping flows (1978-2016) documents from the Open Door Policy launched in 1978 up to the present how containerization, from its initial adoption at a few nodes, has diffused nation-wide over time as well as externally. Our central research question can thus be formulated as follows: how have Chinese cities become integrated in the global maritime network, and how has this integration fostered or reduced excessive traffic concentration internally and dependence or vulnerability externally?
Answers to such questions are proposed based on relatively classic methods originating from graph theory and spatial statistics. The connectivity of Chinese ports in this paper is mainly measured by degree centrality (i.e., the number of links to other ports, at node, sub-region, and national level), and also by looking at domestic inter-port linkages. Another useful measure is hub dependence, explored by Ducruet (2008) in the case of North Korean ports, to evaluate the vulnerability level of ports by their dependence upon external nodes. Such measures are compared with the more common ones of traffic volumes but also traffic concentration. The global port-to-port adjacency matrix also serves to measure the changing geographic distribution of China’s maritime forelands by world region, based on both continents and political blocks. The remainder of this paper is as follows: in the second section, we present the results obtained from the usage of maritime traffic statistics covering the 1890-2008 period in order to describe important connectivity changes that occurred across different political regimes and technological innovations. The third section, focusing on container flows since the Open Door Policy, will apply similar methods up to the year 2016, insisting more on traffic inequality issues. The last section will discuss and conclude with the lessons learned from this study for further academic research and policy recommendations in the fields of ports, maritime transport, but also networks and urban development in general.
2. Data and methodology
In this paper, we compare the evolution of China’s shipping connectivity over two different time scales, namely 1868-2008 and 1978-2016. These two periods complement each other by the fact that the first comprises all types of ships, and the second focuses on containerships only. Long-term and medium-term analyses are useful to grasp essential features, such as
China’s resilience or adaptation to changing trade patterns, (geo)political circumstances, and technological standards. The analysis of China’s connectivity since the 19th century is based on two complementary sources. One first database was assembled by Wang and Ducruet (2013) and updated by the authors of this paper to provide a general background on China’s evolving port and maritime activity over the longest possible period (1868-2014), based on customs data and ministry data. The rest of the analysis is based on the Lloyd’s List corpus, which was extracted on the basis of one publication of the Shipping Index every five years or so between 1890 and 2008, providing a snapshot of global maritime flows based on the latest movement of each recorded vessel at the time of the selected publication, around the period of April-May for the sake of comparability (see Ducruet et al., 2015b for a full description of this corpus). The
Lloyd’s database is rather unique in that it provides the possibility to focus on the external
linkages of port cities, complementing the analysis of tonnage by a relational perspective, albeit over a shorter period (1890-2008).
There are two major differences with the former approach when it comes to analyze container flows linking China and the rest of the world. They have in common to focus on vessel movements, from the same source Lloyd’s List, but the study of containerization leaves behind other ship types, and of course, concentrates on a shorter time period (1978-2016). Firstly, the 1978-2016 database comprises full months of daily vessel movements, making it possible to track complete maritime routes instead of just one-stop calls between previous, current, and next port. This potentially has enormous implications on the way China’s shipping connectivity can be understood, especially from a geographic perspective. For the sake of comparability, the month of June was retained each year, with the exception of 1981, 1986, 1991, 2001, 2007, and 2008 for which it is replaced by the month of March due to data availability issues. Around 30 days of continuous circulation thus compose the yearly snapshot of connectivity. Secondly, vessel capacity, measured in twenty-foot equivalent units (TEUs) is taken into account, compared with the sole count of vessel calls in the previous section, which inevitable excluded the size effect and was another cause for the over- or underestimation of certain linkages between China and the rest of the world.
The proposed analyses consist in applying standard graph-theoretical and statistical measures to the aforementioned matrices of inter-port vessel flows, such as degree centrality (i.e. number of adjacently connected port nodes) and concentration measures (i.e. Gini coefficient, Herfindhal index). It is complemented by a look at the average kilometric distance of China’s overseas shipping linkages, the distribution of vessel traffic by main cargo types, the global and
regional distribution of China’s overseas traffic, and the share of China at external nodes and regions. Finally, we investigate the changing distribution of inter-port linkages within Northeast Asia, based on the single linkage analysis method, to reveal China’s preferential attachments with its immediate neighbors, but also internally, based on domestic or coastal shipping linkages.
3. China’s long-term maritime connectivity (1868-2008)
As seen in Figure 1, the evolution of tonnage is a good starting point to document the changing scale and geographic distribution of port activities in mainland China in the last 150 years or so. Different phases can be differentiated in terms of total tonnage: stability and moderate growth until the late 1880s, namely following and during the Treaty Ports era mainly based on foreign (European) intervention; accelerated growth during the era of leased territories or concessions to Japan, Russia, Germany, United Kingdom, and France until the late 1920s; lack of statistical data on the 1930s and 1940s; major traffic disruption and decline during the political transition towards the empowerment of Mao Zedong and the People’s Republic of China in the late 1940s and early 1950s followed by the Korean War (1950-1953) and trade embargoes; recovery in the early Cold War period of the 1960s based on new trade circuits with preferential partners such as the USSR and the socialist block; instability in the late 1950s and 1960s with traffic growth during the Great Leap Forward (1958-1960); the revival of certain trades with Japan and Western Europe; fluctuations and decline due to priority given to agriculture, railways, and heavy industries (on the development of the Chinese railway network between 1906 and 2000, see Wang et al., 2009) before and during the Cultural Revolution; traffic growth during the economic revitalization and modernization under Zhou Enlai and the Gang of Four (1970-1976); uninterrupted and fast traffic growth following China’s Open Door Policy launched by Deng Xiaoping, and the only slight decline being felt in 2009 due to the global financial crisis, which affected not only China but also the rest of the world.
A closer look at Figure 1 reveals interesting regional dynamics taking place within the country. While all of the three main port ranges have followed the national trend, and the central region (or Yangtze River Valley) always ranked first among them, one can observe an inversion between North China and South China that persisted from the early 1900s until nowadays. Even during the major disruption of the late 1940s and early 1950s, North China went through a lesser decline than the two other regions. One reason is geopolitical, as North China, and especially Manchuria, rapidly became the focus of important foreign interests and interventions (e.g., Japan, Russia, Germany), resulting in fostered port development such as in Tianjin (Todd and Zhang, 1993). The other factor is both cultural and political, as South China had been traditionally more liberal and trade-oriented for centuries, notably since the Treaty of Nanking (1842) through which the British opened a number of treaty ports in South China (e.g. Shanghai, Guangzhou, Xiamen, Ningbo, and Fuzhou). However, South China became somewhat peripheral under the new regime installed in 1949 and based in Beijing, which largely neglected (or even disregarded) foreign trade in the subsequent and so-called period of “closure”. In addition, as port activity is measured in tons, this unit gives more advantage to North China even after the opening of 1978, as North China handles mainly raw materials such as coal and iron ore, while South China, though gradually becoming the world’s factory, handled lighter goods produced by manufacturing industries.
Lloyd’s database is rather unique in that it provides the possibility to focus on the external
linkages of port cities, complementing the analysis of tonnage by a relational perspective, albeit over a shorter period (1890-2008). The evolution of the number of shipping linkages between China and the rest of the world, as defined by the number of foreign ports connected (Figure 2), closely matches the previous figure based on total tonnage, despite a marked decline in the recent period. Chinese port cities have deployed their external connectivity substantially during specific periods, such as the Russo-Japanese war (1905) taking place in the Yellow Sea and Manchuria, economic prosperity during the Nanjing decade led by Chiang Kai-Shek until Japan’s invasion of Manchuria (1937), and after the Open Door Policy (1978), notwithstanding a noticeable decline in the years 2000 and 2008 for the following reasons, which are also derived from Figure 2.
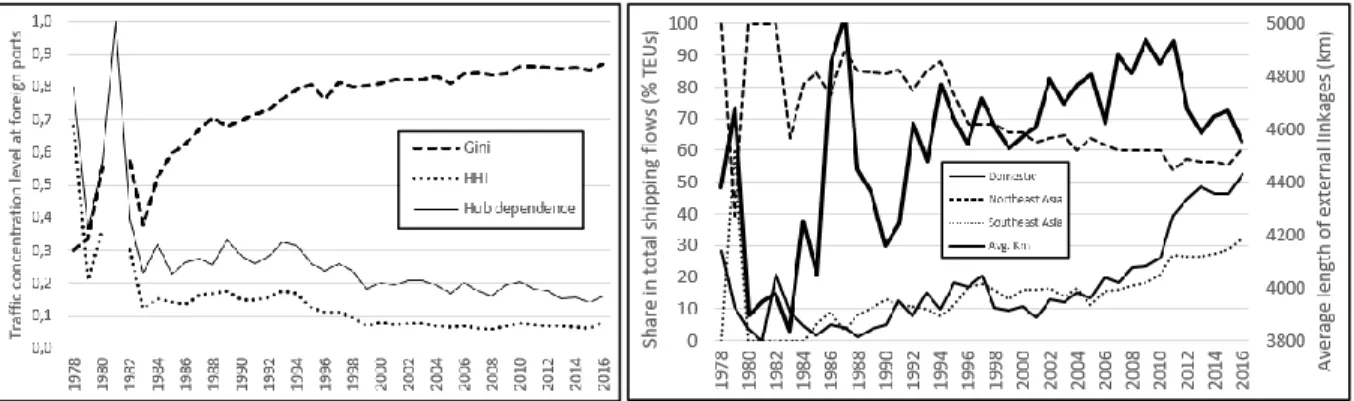
After suddenly reaching its lowest value in 1951, the Gini coefficient, a measurement of inequality applied on the distribution of vessel calls between China and foreign ports, increased tremendously in subsequent years, reaching nearly 0.75 in 2008. Such a trend suggests that although China had witnessed skyrocketing increases in traffic volumes in the latter period, its
external linkages had become increasingly concentrated at fewer main external nodes. As a consequence, the number of external nodes decreased latterly. This trend is also confirmed by the growing Herfindhal index, which summarizes the share of the largest connected nodes in China’s total foreign traffic, also reaching its peak value in 2008. One selected example is Hong Kong, whose share in China’s total foreign traffic increased from its lowest value in 1965 (7%) to about 23% in 2008. Although Hong Kong’s role as China’s gateway had been crucial following the Open Door Policy but tended to stagnate or even decline in recent years due to the shift and growth of port operations at mainland Chinese ports (Wang and Chen, 2010), it had remained a major connector (or bridge) between China and the rest of the world, at least until mainland Chinese ports became relatively autonomous for handling large containerships without needing transit trade through the Hong Kong hub. In parallel, the share of domestic linkages in total vessel traffic increased very fast in recent years, from an average of about 45% until 1985 to about 73% in 2008, thereby translating, mainly, Shanghai’s strengthening role as a domestic transshipment hub between North and South China, and for the whole Yangtze River Valley (Wang and Ducruet, 2012).
[Insert Figure 2 about here]
Such topological and spatial considerations show to what extent China’s shipping connectivity translates various events, shocks, and transitions of a different nature. The political transition of the late 1940s clearly had the most intense influence on such connectivity, in accordance with the model of Ducruet (2008) on the level of hub dependence in constrained economies. The changing political regime caused a drastic reorientation of internal economic priorities as well as external trade relationships, resulting, as seen also in Figure 2, in a dispersion of external traffic (i.e. decreasing Gini coefficient) but at the same time, it led to a concentration at a handful of largest external nodes (i.e. increasing Herfindhal index). This corresponds exactly to the impacts observed in the study of North Korea’s external shipping linkages when it lost its main trade partners during the collapse of the USSR (Ducruet et al., 2009), thereby providing grounds for more generic approaches to the impact of major shocks and disruptions on the evolution of network topology.
Another crucial dimension of connectivity is its geographic distribution (Figure 3), given that major spatial shifts may occur as already observed in the Yellow Sea in recent years, in the context of rapid economic growth and increasing trade relationships between China and South Korea (Lee and Rodrigue, 2006). Two dimensions are proposed, each of them grouping foreign ports and their host country into world regions (left) and political groups (right). World regions mainly overlap in the sharing of continents, with Asia split between East and West; the first being a North-South area from Indonesia to Far-East Russia, and the second an East-West area from Myanmar to Syria. Political regions are defined by the dominant ideology of the country’s constitution, with reference to the Cold War era when the world was divided amongst three main groups. Although such a typology does not apply to the 120 years under consideration, it does provide a benchmark to situate shipping connectivity according to other factors than sole physical geography.
[Insert Figure 3 about here]
Results can be explained by changes in both trade relationships and shipping network design. Before the 1960s, China’s shipping connectivity was dominated by its linkages with the Western world (Europe and America), which evolved from 88.1% in 1890 to 80.2% in 1935, before going down to 61.0% in 1940, i.e. in the early phase of the Second World War. The rest of the period is marked by the continued decline of such a relationship, with the exceptional importance of North America (mainly the United States) in 1946 (62.6%, against 1.7% for Europe), when vessels sailed all over the world to support recovery from war losses and strengthen geopolitical control; the link with North America fell to zero percent in 1951. In parallel, East Asia increasingly occupied the lion’s share of China’s shipping connectivity, up to 55.8% in 2008. While such recent figures seem to contradict trade figures which, on the contrary, show a tremendous growth of China-Europe and China-US flows from the 1980s onwards, this fading connectivity with the Western world stems from the fact that shipping networks (especially container shipping) have been reorganized in the form of scheduled, pendulum services calling at a limited number of large gateways and transit hubs, thereby artificially causing spatial shrinkage as the data is based on the previous or next port of call. This system has gradually replaced the port-to-port configuration, less centralized and more long-distance, based on origin-destination shipments. This explains why North America had
regained substantial importance after China’s resuming of its trade relations with the West, being more directly accessible across the Pacific, compared with the China-Europe route, organized along successive intermediary stops. The temporary increase of Africa’s share in the 1960s-1970s is directly attributable to China’s foreign policy promoted by Zhou Enlai through the signature of the first official bilateral trade agreements with Algeria, Egypt, Guinea, Somalia, Morocco and Sudan, mainly to encourage decolonization and the fight against capitalist super-powers.
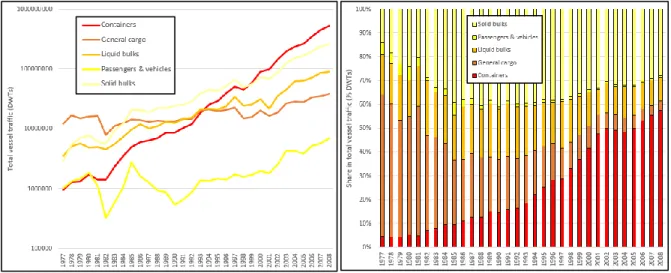
When it comes to political regions, Figure 3 confirms the aforementioned trends, with a shrinking dominance of capitalist partners during the period (from 89.5% in 1890 to 52.5% in 2008), a rise of socialist partners in the years following political change, the highest share being 30.2% in 1951, but gradually declining since then. As for Europe in general, connectivity with the USSR and the socialist block via the China-Europe route (Black Sea, Baltic Sea) became underestimated given the reorganization of shipping networks. Non-aligned countries often located in Asia, for instance, kept a substantial share up to the present day, with 36.5% in 2008. Thus, shipping connectivity well overlapped political and trade relationships until their disentanglement provoked by technological progress in shipping and port operations. Such a consideration motivates us to zoom in on the more recent period in the next section, to look at how China’s connectivity had evolved through the particular vector of container shipping. In particular, and based on another database for the 1977-2008 period covering all ship types, it has been possible to compare the share of container traffic with that of other types in China’s total traffic (Figure 4). It must be noted, however, that although the first container line started operating in 1973, dedicated container handling facilities were developed in Tianjin port only in 1980. While all traffic categories increased over time, container traffic both in absolute and relative values increased from the lowest to the highest score relatively rapidly. It superseded general cargo and liquid bulks in the mid-1990s, as well as solid bulks in the early 2000s, although nowadays China still handles enormous amounts of raw materials, such as coal, (Wand and Ducruet, 2014). By comparison, general cargo has substantially stagnated, partly because such merchandise was increasingly containerized. This drastic transition in China’s maritime traffic structure motivates a further look in the next section at container shipping dynamics, especially in terms of overseas connectivity.
4. China’s container shipping connectivity (1978-2016)
There are two major differences between the previous and current sections in terms of connectivity measurement based on vessel movements, in addition to the type of fleets (all vessels vs. containerships) and the time period (1890-2008 vs. 2016). Firstly, the 1978-2016 database comprises full months of daily vessel movements, making it possible to track complete maritime routes instead of just one-stop calls between previous, current, and next port. This potentially has enormous implications on the way China’s shipping connectivity can be understood, especially from a geographic perspective. For the sake of comparability, the month of June was retained each year, with the exception of 1981, 1986, 1991, 2001, 2007, and 2008 for which it is replaced by the month of March due to data availability issues. Around 30 days of continuous circulation thus compose the yearly snapshot of connectivity. Secondly, vessel capacity measured in twenty-foot equivalent units (TEUs) is taken into account, compared with the sole count of vessel calls in the previous section, which inevitably excluded the size effect and was another cause for the over- or under-estimation of certain linkages between China and the rest of the world.
A first analysis considers simple indicators such as total overseas traffic, degree centrality (number of external linkages), number of domestic nodes being connected with the outside, and the level of traffic concentration within the country (Figure 5). In accordance with the previous Figure 4, we observe a rapid growth in the number of connected nodes (internally and externally), albeit following different trends, namely more regular for domestic nodes, and exponential for foreign ports. This means that the development and spatial diffusion of containerization had been rather gradual internally, but slow and then very fast externally. This means too that China had to catch up with containerization until it became able to deploy its connectivity with foreign partners. As in many port systems worldwide (Notteboom, 2006b), the spread of containerization reinforced traffic inequalities within China, as seen with the constant increase of the Gini coefficient, from about 0.5 in the early 1980s to about 0.8 in recent years. The gradual decline of the Herfindahl index (HHI) suggests that the Chinese port system had become more polycentric, whereby larger ports keep concentrating traffic but with a parallel growth of small and medium-sized ports.
[Insert Figure 5 about here]
When it comes to the distribution China’s external linkages (Figure 6), there was a rapid concentration of traffic at foreign ports until the mid-1990s, and a slight increase of this concentration since then, up to the present day. It means that China’s external connectivity has evolved from dispersion to concentration, favoring fewer but larger hubs. At the same time, the share of the largest linkage (cf. hub dependence) and of the top linkages (Herfindahl index or HHI) have both decreased over time, after exceptional values in the late 1970s and early 1980s due to the rarity of connections. This suggests that although China concentrated its external traffic at a few large hubs, recalling the process of vulnerability (Ducruet, 2008), it managed to diversify its connectivity by a parallel spread of its linkages to other ports as well in addition to the largest ones. Most interesting is the gradual expansion of China’s geographic radius in terms of the average kilometric distance (orthodromic) of its container shipping linkages with foreign ports, despite certain fluctuations, and fall-off in recent years. This overall trend goes along with the decline of the share of its surrounding region (Northeast Asia) in total foreign traffic, although it still remains nowadays around 60%. The share of the neighboring region of Southeast Asia, an important crossroad connecting Europe and Asia, has noticeably increased from zero percent in the early 1980s to more than 30% in latest years. But such an expansion and growing integration in the global shipping network does not contradict the fact that intra-national (or domestic, coastal) container shipping had decreased. On the contrary, the share of coastal shipping had grown at a modest but regular pace until the early 2000s, faster afterwards, reaching no less than above 50% of China’s total container traffic in 2016. The same methodology could be applied to specific Chinese ports and regions, as a possible pathway for further research.
[Insert Figure 6 about here]
We have chosen to move forward to the observation of the geographic distribution of these external linkages, at the level of Northeast Asia’s main partners and by world region (Figure 7). While China’s first container lines connected Japan in the early period of containerization, the latter gradually lost its prominence over time, from 100% in 1978 to less than 20% in 2016.
In relative terms, China’s traffic with its adjacent neighbors gradually shifted to South Korea as well as Taiwan, especially from the mid-1990s. This evolution is partly explained by the growing centralization of Northeast Asia’s liner shipping networks upon transshipment hubs such as Busan in Korea and Kaohsiung in Taiwan (Ducruet et al., 2010), as well as increasing trade between China and South Korea (Lee and Rodrigue, 2006). By comparison, Hong Kong kept its role as a major external node, although one can observe a gradual decline of its share since its partial retrocession in 1997, which directly provoked a shift in liner shipping network configurations, with the first direct call of Evergreen, a major shipping line, to a Chinese mainland port, Yantian, in 1998 (Wang, 1998). Hong Kong’s share within Northeast Asia thus declined from around 40% to less than 30% since then, with a transfer of cargo handling operations to adjacent ports such as Shenzhen.
[Insert Figure 7 about here]
A rapid zoom in on the share of the two major hubs of Busan and Hong Kong in China’s total and regional container traffic is worthy of investigation to complement such a broad view on the external vulnerability (or hub dependence) of Chinese ports. While Hong Kong’s share in China’s total foreign traffic gradually declined from 54.6% in 1978 to 7.7% in 2016, especially after British retrocession (their share was still around 20% in 1997); the same share had declined everywhere but remains higher for South China in 2016 (11.3%), compared with Central/Yangtze (6.3%) and North China (3.7%), for obvious reasons such as spatial proximity but also close business ties. In the case of Busan, a similar process is observable, but with a growing share in China’s total external traffic up to 2005 (11.1%), and a gradual decline since then, down to 6.6% in 2016. North China, which is closer to Busan, remained more dependent than other Chinese port regions, culminating at 16.9% in 2005 (compared with 12.2% for Central/Yangtze and 8.2% for South China), and remaining higher than average in 2016 with a score of 8.1% for North China, 7.9% for Central/Yangtze, and 4.3% for South China. China thus remains internally differentiated in terms of vulnerability upon external transshipment hubs, but managed to overcome such a situation by deploying its connectivity outside the regions and increasingly bypass these hubs with direct calls from major shipping lines.
The geographic spread of China’s shipping connectivity by world region had been rather chaotic until the early 1990s, and has stabilized since then with specialization centered on North America (cf. transpacific trade), West Asia, as an intermediary zone between Europe and East Asia (cf. Middle East and Indian Ocean), and Europe itself. Other continents occupy a relatively minor share, although the recent growth of Africa, albeit still moderate, confirms growing Chinese investments in this continent, recently seen as a major factor in the shift of Africa’s connectivity towards Asia in general (Chaponnière, 2010).
The other side of the coin is also worthy of interest, namely to what extent foreign ports and regions are dependent on China. Starting with Figure 8, it was possible to calculate the share in the total number of ports and container traffic in the world related with China. After reaching a peak value in 2007 (38.5%), the share of ports connected directly or indirectly with China gradually fell to 28.1% in 2016. Still, it means that nearly one-third of the world’s container ports are involved in routes and services including Chinese ports, which is rather impressive, compared with 1.6% in 1978. In terms of world container traffic, China’s share rose to 21.5% in 2016, its highest value, meaning that no less than one-fifth of global container shipping is related to China, which moreover currently hosts most of the top 20 container ports in the world. Looking at the figures when split by world region, we note that China’s container traffic share had become substantial in the middle of the period (early 2000s), when it joined the World Trade Organization (WTO) in December 2001. Still, these numbers should be analyzed with caution, as China’s share was calculated in the total container traffic of each world region, including intra-regional traffic as well, thus causing a bias. Perhaps, further analyses should consider recalculating this share only based on extra-regional flows. This might explain why the most China-dependent regions are East Asia and West Asia, due to their geographic proximity, and why this share had even decreased in very recent years in all other regions, perhaps also due to lower economic growth for China itself, recently reported as a general economic slowdown.
[Insert Figure 8 about here]
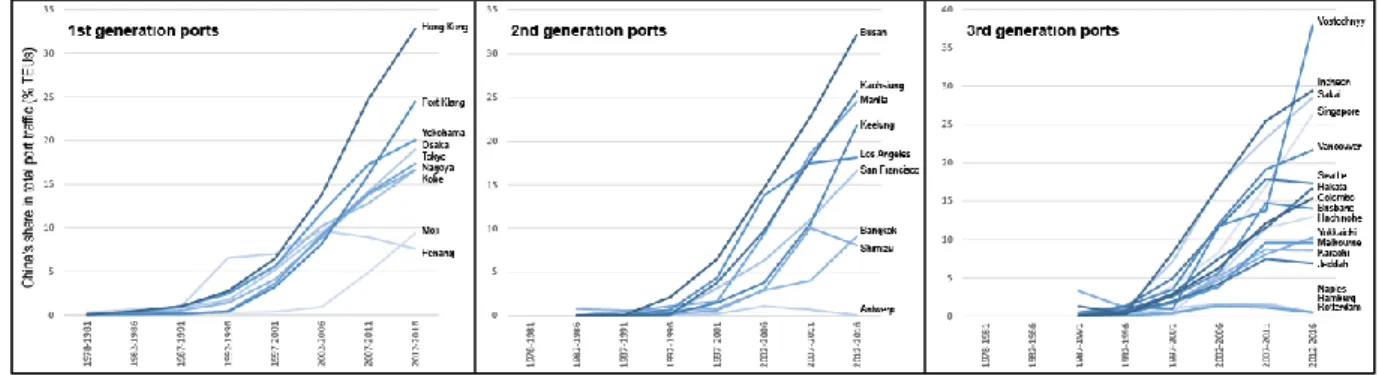
Yet, and it is the goal of our last analysis, China’s traffic share has risen impressively at the level of individual foreign ports (Figure 9). The latter nodes were differentiated according to
the period from which they started to be connected with Chinese ports, keeping only the main nodes and the three first “generations”. Interestingly, whereas China had become less and less dependent upon Hong Kong for external traffic, Hong Kong is increasingly dependent on China, accounting for up to 32.8% of its total traffic in the last period. It is followed by a number of major Japanese ports, but also Port Klang and Penang in Malaysia, albeit at lower levels. Among the second generation ports, (i.e., connected from the period 1982-1986), Busan stands out as the most China-dependent port, reaching 32.2% of its total traffic in the last period. This is again an interesting inversion as its share in China’s external traffic had constantly decreased. It is followed by a number of South Asian ports (Manila, Keelung, Bangkok), as well as US West Coast ports and also Antwerp in Europe, albeit at a much lower level for the latter (0.1% in the last period). Among the third-generation ports, some nearby nodes have the highest share of China-related traffic (Incheon, Sakai, Vostochnyy), followed by a number of ports that are more and more distant geographically speaking, reaching as far as North Europe, the Middle East, and Australia. All these evolutions have been extremely rapid, although certain losses are felt at a number of Japanese ports (Moji, Shimizu) but also at Brisbane and Seattle.
[Insert Figure 9 about here]
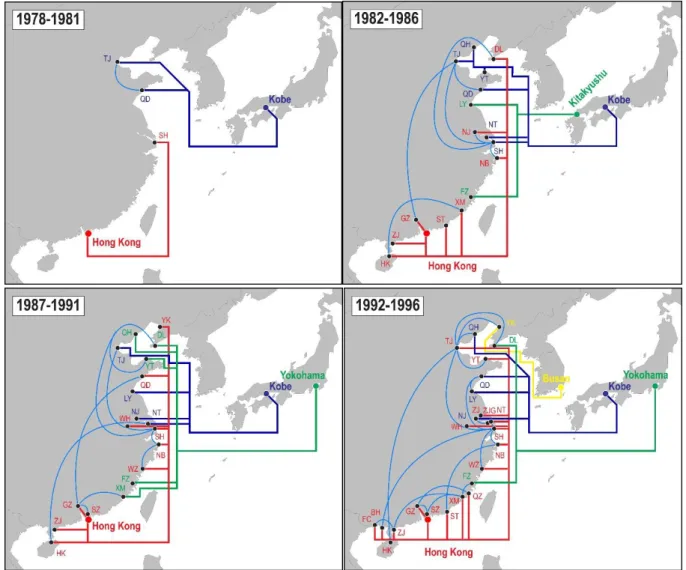
The last part of this analysis is the mapping of the major shipping linkages of mainland Chinese ports at two complementary levels: domestic and international. For the sake of clarity, we have restricted foreign linkages to Northeast Asia, bearing in mind that only very few of those were actually reaching outside the region (for a similar methodology applied to the case of North Africa, see Mohamed-Chérif and Ducruet, 2016). Such an approach allows us to test the coevolution of domestic and international linkages with reference to concepts of hub dependence, port system integration, and network vulnerability. The main results (Figure 10) demonstrate that although China as a whole had, as showed in previous sections, deployed its global shipping connectivity in ways previously unthinkable, and reduced its dependence upon neighboring foreign transit hubs, it still relies up to nowadays, on a limited number of external nodes to access the global maritime network of container shipping. Another recurrent finding is that mainland China has always been divided between North and South in terms of the geographic coverage of its external hubs. During the early periods, North China was more polarized by the main Japanese ports (i.e. Kobe, Yokohama, Kitakyushu), and by the main
South Korean ports in the late periods (i.e. Busan and Incheon). In constant evidence is the polarization of South China by Hong Kong, notwithstanding certain exceptions at different periods, and noticeable fluctuations of this influence. Up to the mid-1990s, Hong Kong was gradually expanding its dominance from South to North, but since then, it is rivalled mainly by Busan, which even supersedes Hong Kong in the period 2002-2006, a period of strong port growth in South Korea following its global strategy of becoming Northeast Asia’s logistics hub. In the last period, it is the first time that Shanghai shifts from Hong Kong’s influence to the influence of Busan. From then onwards, North and South China remained rather separate in terms of foreign linkages, Nantong, in the middle of the country, being the only Chinese port predominantly connected with Japan in recent times.
Internally, there have been drastic changes in the way China had become connected through coastal shipping. Up the early 2000s, North and South China remain barely connected (based on dominant, largest flow linkages), as each region is more connected internally, or through the intermediate central or Yangtze region such as through Shanghai or Ningbo main ports. Each region, in parallel to this evolution, is characterized by the emergence of local or regional hubs polarizing their surrounding neighbors, such as Tianjin (China’s first container port) in the first two periods, Shanghai in the 1980s, Qingdao and Xiamen in the period 1997-2001, and from the period 2002-2006 one can observe a more polycentric system emerging, well connected through these hubs. The late periods witness the emergence of Shenzhen as a very strong hub, with even more dominant linkages than Shanghai, although it is spatially restricted to South China itself.
[Insert Figure 10 about here]
5. Conclusion
The analysis of China’s maritime connectivity from the local to the global and over the long-term is a new contribution to both transport studies and Chinese studies in academic literature. China deserves such an ambitious approach, given the economic importance it has gained over the years, and its growing role in global shipping. Yet, such an exercise greatly depended on huge efforts to collect and extract massive statistical data covering not only China’s port activity itself but also its relationships with the rest of the world through its port cities. The only possible
source being the Lloyd’s List, this article carefully selected the most relevant time series to highlight key features that characterized China’s contemporary connectivity in the worldwide maritime network.
While this approach is only at its eve and further research is needed, additional evidence could be provided, such as important geographic and functional shifts occurring at different time scales and spatial scopes, internally and externally. Massive shocks and disruptions during the contemporary era have been absorbed and overcome differently across the country, and such a geographic differentiation still persists even though port and shipping technologies have greatly changed and improved. While the influence of physical geography such as distance, resulting in transport costs, certainly plays a role in the emergence of certain patterns of flows, other factors are also at stake, such as the cultural and economic variety of China, as reflected in the recurrent differentiation between North and South. The extent to which China’s reliance on external, foreign transit hubs to connect global maritime networks is a structural vulnerability or a conjectural phenomenon that may change in the near or distant future remains to be verified. Many port cities of the world are becoming increasingly dependent upon Chinese trade or transit, but at the same time, China has not yet become the dominant hub of Asia, despite its spectacular traffic growth. Backed by more qualitative evidence, further research should investigate in greater detail the factors at stake behind such logic, which certainly goes beyond pure transport economics, and may lead us to different research arenas such as political geography, political economy, and geopolitics. Another research pathway is to update the current vessel movement database including all ship types to better document the recent role played by raw materials, not only containers, on China’s increasing insertion in the current and future world system. Finally, it would be extremely necessary to integrate shipping data with socio-economic and trade data into multivariate analyses to better understand their mutual influences overtime.
References
An X., Han Z. (2000) The problem on the construction of container load center in north China. Human Geography, 15(4): 29-33.
Cao Y., Jiang Z., Chen H., Wu W., Liang S. (2015) The evolution course and mechanism of the port system along the Yangtze River. Progress in Geography, 34(11): 1430-1440.
Chaponnière J.R. (2010) Le basculement de l’Afrique vers l’Asie. Enjeux pour les ports africains. Afrique Contemporaine, 234(2): 25-40.
Cheng J., Wang C. (2015) Evolution and dynamic mechanism of container port system in the Pearl River Delta. Acta Geographica Sinica, 70(8): 1256-1270.
Comtois C., Wang J.J. (2003) Géopolitique et transports : nouvelles perspectives stratégiques dans le détroit de Taiwan. Etudes Stratégiques, 34(2): 213-227.
Ducruet C. (2008) Hub dependence in constrained economies: The case of North Korea.
Maritime Policy and Management, 35(4): 374-388.
Ducruet C. (2017) Multilayer dynamics of complex spatial networks: the case of global maritime flows (1977-2008). Journal of Transport Geography, 60: 47-58.
Ducruet C., Cuyala S., El Hosni A., Kosowska-Stamirowska Z. (2015a) Co-evolutionary dynamics of ports and cities in the global maritime network, 1950–90. In: Ducruet C. (Ed.),
Maritime Networks: Spatial Structures and Time Dynamics, London & New York: Routledge
Studies in Transport Analysis, pp. 351-373.
Ducruet C., Haule S., Ait-Mohand K., Marnot B., Kosowska-Stamirowska Z., Didier L., Coche M.A. (2015b) Maritime shifts in the contemporary world economy: Evidence from the Lloyd’s List corpus, 18-21 c., In: Ducruet C. (Ed.), Maritime Networks: Spatial Structures
and Time Dynamics, London & New York: Routledge Studies in Transport Analysis, pp.
134-160.
Ducruet C., Lee S.W., Ng A.K.Y. (2010) Centrality and vulnerability in liner shipping networks: Revisiting the Northeast Asian port hierarchy. Maritime Policy and Management, 37(1): 17-36.
Ducruet C., Notteboom T.E. (2012) The worldwide maritime network of container shipping: Spatial structure and regional dynamics. Global Networks, 12(3): 395-423.
Ducruet C., Roussin S., Jo J.C. (2009) Political and economic factors in the evolution of North Korea’s maritime connections. Journal of International Logistics and Trade, 7(1): 1-23. Feng L., Notteboom T. (2013) Peripheral challenge by small and medium sized ports (SMPs) in multi-port gateway regions: the case study of northeast of China. Polish Maritime
Guerrero D., Rodrigue J.P. (2014) The waves of containerization: shifts in global maritime transportation. Journal of Transport Geography, 34: 151-164.
Han Z., An X. (2001) Research on the construction and optimization of container
transportation network in northeast China. Scientia Geographica Sinica, 21(4): 308-314.
Lee J.Y., Rodrigue J.P. (2006) Trade reorientation and its effects on regional port systems: The Korea‐China link along the Yellow Sea Rim. Growth and Change, 37(4): 597-619.
Li Z., Xu M., Shi Y. (2015) Centrality in global shipping network basing on worldwide shipping areas. Geojournal, 80(1): 47-60.
Liu L., Wang K.Y., Yip T.L. (2013) Development of a container port system in Pearl River Delta: path to multi-gateway ports. Journal of Transport Geography, 28: 30-38.
Mohamed-Chérif F.Z., Ducruet C. (2016) Regional integration and maritime connectivity across the Maghreb seaport system. Journal of Transport Geography, 51: 280-293.
Ng A.K.Y., Ducruet C., Jacobs W., Monios J., Notteboom T.E., Rodrigue J.P., Slack B., Tam K.C., Wilmsmeier G. (2014) Port geography at the crossroads with human geography:
between flows and spaces. Journal of Transport Geography, 41: 84-96.
Ng A.K.Y., Tam K.C. (2012) China’s seaport development during the early Open Door Policy period, 1978–2002. In: Harlaftis G., Tenold S., Valdaliso J.M. (Eds.), The World’s Key
Industry, Palgrave McMillan UK, pp. 180-199.
Notteboom T. (2006a) Container throughput dynamics in the East Asian container port system. Journal of International Logistics and Trade, 4(1): 31-52.
Notteboom T. (2006b) Traffic inequality in seaport systems revisited. Journal of Transport
Geography, 14(2): 95-108.
Pan K., Cao Y., Liang S., Wei H. (2014) New tendency of Chinese container port system: 1998–2010. Geojournal, 79(3): 373-384.
Rimmer P.J., Comtois C. (2005) China's extra- and intra-Asian liner shipping connections, 1990-2000. Journal of International Logistics and Trade, 3: 75-97.
Rimmer P.J., Comtois C. (2009) China’s container-related dynamics, 1990–2005. Geojournal, 74(1): 35-50.
Song D.W. (2002) Regional container port competition and co-operation: the case of Hong Kong and South China. Journal of Transport Geography, 10(2): 99-110.
Todd D., Zhang L. (1993) Political and technical factors impinging on port operations: The case of Manchuria. Geojournal, 30(4): 441-454.
Tran N.K., Haasis H.D. (2014) Empirical analysis of the container liner shipping network on the East-West corridor (1995–2011). Netnomics, 15(3): 121-153.
Veenstra A., Notteboom T. (2011) The development of the Yangtze River container port system. Journal of Transport Geography, 19(4): 772-781.
Wang A., Kuang G. (2014) The evolution and competition situation of container port cluster system in China. Economic Geography, 34(6): 92-99.
Wang C.J. (2008) Spatial organization networks of world marine container transportation.
Geographical Research, 27(3): 636-648.
Wang C.J., Ducruet C. (2012) New port development and global city making: Emergence of the Shanghai-Yangshan multilayered gateway hub. Journal of Transport Geography, 25: 58-69.
Wang C.J., Ducruet C. (2013) Regional resilience and spatial cycles: Long-term evolution of the Chinese port system (221BC-2010AD). Tijdschrift voor Economische en Sociale
Geografie, 104(5): 521-538.
Wang C.J., Ducruet C. (2014) Transport corridors and regional balance in China: The case of coal trade and logistics. Journal of Transport Geography, 40: 3-16.
Wang C.J., Ducruet C., Wang W. (2015) Port integration in China: Temporal pathways, spatial patterns and dynamics. Chinese Geographical Science, 25(5): 612-628.
Wang C.J., Jin F. (2006) Organization networks of Chinese marine container transportation.
Scientia Geographica Sinica, 26(4): 392-401.
Wang C.J., Wang J., Ducruet C. (2012) Peripheral challenge in container port system: A case study of Pearl River Delta. Chinese Geographical Science, 22(1): 97-108.
Wang J., Jin F., Mo H., Wang F. (2009) Spatiotemporal evolution of China's railway network in the 20th century: An accessibility approach. Transportation Research Part A, 43(8): 465-478.
Wang J.J. (1998) A container load center with a developing hinterland: a case study of Hong Kong. Journal of Transport Geography, 6(3): 187-201.
Wang J.J., Chen M.C. (2010) From a hub port city to a global supply chain management center: A case study of Hong Kong. Journal of Transport Geography, 18(1): 104-115.
Wang J.J., Ng A.K.Y. (2011) The geographical connectedness of Chinese seaports with foreland markets: A new trend? Tijdschrift voor Economische en Sociale Geografie, 102(2): 188-204.
Wang L., Hong Y. (2016) Spatial structure of container port systems across the Taiwan Straits under the direct shipping policy: A complex network system approach. Acta Geographica
Sinica, 71(4): 605-620.
Wang L., Notteboom T., Yang L. (2015) British and Japanese maritime networks in China in the 1920s. In: Ducruet C. (Ed.), Maritime Networks: Spatial Structures and Time Dynamics, London & New York: Routledge Studies in Transport Analysis, pp. 112-133.
Wang N., Wu N., Dong L.L., Yan H.K., Wu D. (2016) A study of the temporal robustness of the growing global container-shipping network. Nature Scientific Reports, 6: 34217.
Wu Q., Chen Q. (2015) Spatial-temporal evolution of main cargo structure in the port system of Yangtze River Delta. Economic Geography, 35(3): 108-114.
Xu M., Li Z., Shi Y., Zhang X., Jiang S. (2015) Evolution of regional inequality in the global shipping network. Journal of Transport Geography, 44: 1-12.
Xu X., Hu J., Liu F. (2007) Empirical analysis of the ship-transport network of China. Chaos, 17(2): 023129.
Yang D., Wang S. (2017) Analysis of the development potential of bulk shipping network on the Yangtze River. Maritime Policy and Management, 44(4): 512-523.
Zheng J., Yang D. (2016) Hub-and-spoke network design for container shipping along the Yangtze River. Journal of Transport Geography, 55: 51-57.
Figure 1. Throughput evolution of mainland Chinese ports, 1868-2014
Source: updated from Wang and Ducruet (2013)
Figure 2. Maritime connectivity of mainland Chinese ports, 1890-2008 Source: own elaboration based on Lloyd’s List data and Wessa software
Figure 3. China’s maritime foreland distribution by world region, 1890-2008 Source: own elaboration based on Lloyd’s List data
Figure 4. Traffic distribution by main vessel types at Chinese ports, 1977-2008 Source: own elaboration based on Lloyd’s List data
Figure 5. Container shipping connectivity of Chinese ports, 1978-2016
Figure 6. Distribution and concentration of external traffic, 1978-2016 Source: own elaboration based on Lloyd’s List data and Wessa software
Figure 7. Geographic distribution of China’s maritime forelands, 1978-2016 Source: own elaboration based on Lloyd’s List data
Figure 8. World’s dependence on Chinese container shipping, 1978-2016 Source: own elaboration based on Lloyd’s List data
000 00 000 000 000 000 000 001 111 1 2 1 2 23 2 4 3 3 22 1 000 00 000 111 111 112 445 457 710 12 14 13 1517 19 20 2231 34 37 37 36 39 000 00 000 000 000 000 000 000 111 1 11 1 11 11 1 111 0 000 00 000 000 000 000 000 000 0 00 0 11 1 11 111 111 0 000 00 000 000 000 000 011 122 34 5 666 768 78 7 877 3 000 00 000 000 000 001 000 021 111 2 45 6 45 7 9 6 787 2 000 00 000 000 000 000 111 112 224 445 775 6 10 8 887 4 Africa East Asia Europe Latin America North America Oceania West Asia 1978 1979 1980 1981 1982 1983 1984 1985 1986 1987 1988 1989 1990 1991 1992 1993 1994 1995 1996 1997 1998 1999 2000 2001 2002 2003 2004 2005 2006 2007 2008 2009 2010 2011 2012 2013 2014 2015 2016
Figure 9. Foreign ports’ dependence on Chinese container shipping, 1978-2016 Source: own elaboration based on Lloyd’s List data
Figure 10. Dominant linkages among Chinese ports and with Northeast Asian ports, 1978-2016