HAL Id: hal-03214441
https://hal.archives-ouvertes.fr/hal-03214441
Submitted on 3 May 2021
HAL is a multi-disciplinary open access
archive for the deposit and dissemination of
sci-entific research documents, whether they are
pub-lished or not. The documents may come from
teaching and research institutions in France or
abroad, or from public or private research centers.
L’archive ouverte pluridisciplinaire HAL, est
destinée au dépôt et à la diffusion de documents
scientifiques de niveau recherche, publiés ou non,
émanant des établissements d’enseignement et de
recherche français ou étrangers, des laboratoires
publics ou privés.
Distributed under a Creative Commons Attribution| 4.0 International License
Summit, Greenland
Max Berkelhammer, David Noone, Hans Christian Steen-Larsen, Adriana
Bailey, Christopher Cox, Michael O’neill, David Schneider, Konrad Steffen,
James White
To cite this version:
Max Berkelhammer, David Noone, Hans Christian Steen-Larsen, Adriana Bailey, Christopher Cox,
et al.. Surface-atmosphere decoupling limits accumulation at Summit, Greenland. Science Advances ,
American Association for the Advancement of Science (AAAS), 2016, 2 (4), pp.e1501704.
�10.1126/sci-adv.1501704�. �hal-03214441�
C L I M A T O L O G Y 2016 © The Authors, some rights reserved; exclusive licensee American Association for the Advancement of Science. Distributed under a Creative Commons Attribution NonCommercial License 4.0 (CC BY-NC). 10.1126/sciadv.1501704
Surface-atmosphere decoupling limits
accumulation at Summit, Greenland
Max Berkelhammer,1,2,3* David C. Noone,2,3,4Hans Christian Steen-Larsen,2,5,6Adriana Bailey,2,3,7
Christopher J. Cox,2,3,8 Michael S. O’Neill,2,8David Schneider,2,9Konrad Steffen,2,10James W. C. White11,12,13
Despite rapid melting in the coastal regions of the Greenland Ice Sheet, a significant area (~40%) of the ice sheet rarely experiences surface melting. In these regions, the controls on annual accumulation are poorly con-strained owing to surface conditions (for example, surface clouds, blowing snow, and surface inversions), which render moisture flux estimates from myriad approaches (that is, eddy covariance, remote sensing, and direct observations) highly uncertain. Accumulation is partially determined by the temperature dependence of satu-ration vapor pressure, which influences the maximum humidity of air parcels reaching the ice sheet interior. However, independent proxies for surface temperature and accumulation from ice cores show that the re-sponse of accumulation to temperature is variable and not generally consistent with a purely thermodynamic control. Using three years of stable water vapor isotope profiles from a high altitude site on the Greenland Ice Sheet, we show that as the boundary layer becomes increasingly stable, a decoupling between the ice sheet and atmosphere occurs. The limited interaction between the ice sheet surface and free tropospheric air reduces the capacity for surface condensation to achieve the rate set by the humidity of the air parcels reaching interior Greenland. The isolation of the surface also acts to recycle sublimated moisture by recondensing it onto fog particles, which returns the moisture back to the surface through gravitational settling. The observations highlight a unique mechanism by which ice sheet mass is conserved, which has implications for understanding both past and future changes in accumulation rate and the isotopic signal in ice cores from Greenland.
INTRODUCTION
The rate of ice accumulation on the Greenland Ice Sheet (GrIS) emerges from a balance between mass loss from coastal calving associated with melting and sublimation and additions from precipitation and conden-sation. In coastal regions, the former now significantly exceeds the latter, leading to a receding ice edge and a contribution to rising sea levels (1). However, at high altitudes (~≥2500 m) where melting is rare and runoff is negligible (2), snow accumulation continues to occur at a rate between 2 and 10 cm liquid-equivalent year–1, implying a tendency for the bal-ance of surface fluxes (precipitation and condensation minus sublima-tion and evaporasublima-tion) to exceed the rate of ice flow divergence (3).
Air temperature influences accumulation through its effect on the humidity of air parcels reaching the ice sheet, which determines the maximum amount of condensation/precipitation that can occur (4). Therefore, rising temperatures are anticipated to generate an increase in accumulation in regions where summer temperatures remain below the 0° isotherm (5). To understand the aggregated influence of tempera-ture on ice accumulation, previous studies have relied on analysis of ice core records (6), which confirm the presence of a strong positive
corre-lation between temperature (from stable isotope ratios in the ice) and accumulation (from layer thickness) (7). However, the response of accumulation to temperature is inconsistent with an exclusively ther-modynamic process (8), which has been interpreted to mean that large-scale shifts in atmospheric circulation have occurred coincident with past temperature changes (9–11). Previous work, however, has largely neglected the role that boundary layer and surface processes play in modulating ice-atmosphere moisture exchange. In arid glaciated landscapes where sublimation and condensation are occurring persist-ently between the limited number of storm events, the role of these pro-cesses may influence the response of accumulation to temperature.
The boundary layer dynamics over the ice sheet, which mediate the coupling between synoptic climate and surface processes, are distinct from terrestrial environments in nonpolar domains in a number of sig-nificant ways. The surface has a high albedo, low friction, an essentially infinite source of moisture, and muted diurnal cycles of radiative inputs for much of the year (12). As a consequence of these particular condi-tions, surface temperature inversions occur almost every day and can last without interruption for days to weeks (fig. S1) (13). Under these stable atmospheric conditions, the ability for the surface and free tropo-spheric air to mix is significantly reduced. Therefore, gas species produced at the surface or within the upper firn have a tendency to accumulate in the near-surface atmospheric layer (14). Similarly, water vapor subli-mated from the ice can remain near the surface and influence accumu-lation by recondensing on the surface and through facilitating the growth of near-surface cloud and fog particles (15–17). The importance of these processes is poorly understood because observing latent heat fluxes in polar environments using classical methods (for example, flux-gradient and eddy covariance) is highly uncertain due to the failure of critical assumptions in similarity theory (18, 19). Here, we use obser-vations of the vertical profiles of water vapor isotope ratios, which do
1Department of Earth and Environmental Sciences, University of Illinois at Chicago, Chicago,
IL 60607, USA.2Cooperative Institute for Research in Environmental Sciences, University of
Colorado, Boulder, CO 80309, USA.3Department of Atmospheric and Oceanic Sciences, University of Colorado, Boulder, CO 80309, USA.4College of Earth, Ocean, and Atmospheric Sciences, Oregon State University, Corvallis, OR 97331, USA.5Laboratoire des Sciences du
Climat et de l’Environnement, UMR CEA-CNRS-UVSQ/IPSL 8212, Gif-sur-Yvette, France.6Center
for Ice and Climate, University of Copenhagen, Copenhagen, Denmark.7Joint Institute for the Study of the Atmosphere and Ocean, University of Washington, Seattle, WA 98195, USA.
8National Oceanic and Atmospheric Administration, Boulder, CO 80305, USA.9National
Center for Atmospheric Research, Boulder, CO 80305, USA.10Swiss Federal Research Insti-tute WSL, Birmensdorf, Switzerland.11Department of Geological Sciences, University of Col-orado, Boulder, CO 80309, USA.12Environmental Studies Program, University of Colorado,
Boulder, CO 80309, USA.13Institute of Arctic and Alpine Research, University of Colorado,
Boulder, CO 80309, USA.
*Corresponding author. Email: [email protected]
on May 3, 2021
http://advances.sciencemag.org/
not require the same assumptions, to assess the net exchange of mass associated with boundary layer processing of water vapor. The results show that under the stable conditions that typically persist during the winter, the surface is isolated from free-tropospheric moisture sources, which impedes both accumulation associated with surface condensa-tion and mass loss through sublimacondensa-tion.
RESULTS
The exchange of water between the ice sheet and the atmosphere is eval-uated here using the vertical profiles of the isotope ratios of water vapor [18O/16O and2H/1H, referred to hereafter in common“d notation” (20)] above the ice sheet. Between July 2012 and July 2014, the isotopic composition of water vapor and the water vapor mixing ratio were measured using a laser absorption spectrometer installed at the base of a 46-m research tower at Summit Camp within the accumulation zone of GrIS (72°35′46.4″N, 38°25′19.1″W and 3210 amsl) (21). Air was continuously sampled from inlets ranging in height from 30 cm below the surface of the snow (firn air) to 40 m above the ice sheet surface, generating more than 12,000 water vapor isotopic profiles (Materials and Methods and fig. S2).
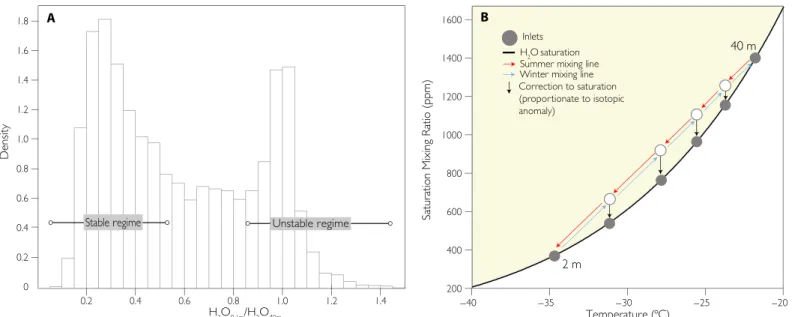
We observe significant vertical variations in humidity near the ice sheet surface, indicating that the exchange of water between the ice sheet and atmosphere has a strong influence on the atmosphere through sub-limation and condensation processes. The water vapor mixing ratio gra-dient (the difference between the water vapor mixing ratio measured at the lowermost and uppermost inlets) is characterized by a bimodal distribution (Fig. 1A). One population emerges during unstable atmo-spheric conditions when mixing leads to vertical homogeneity of the water vapor concentration and its isotopic ratio from the surface to 40 m (Fig. 2 and Materials and Methods; see fig. S3 for definition of stability). Using observations from the same site, Box and Steffen (16) found an overall tendency for the surface to be a moisture sink under
these unstable conditions. Their results suggest that the surface is, on average, a condensing environment, implying that the radiative balance produces a condition where free tropospheric air is supersaturated, with respect to the surface. The lack of a measurable humidity gradient is maintained in spite of surface condensation by rapid mixing between the surface and free tropospheric air masses.
Under stable conditions, the predominant condition all winter and during summertime nights, surface temperature inversions lead to cold and saturated air at the surface. Because of the strength of the tempera-ture inversion, the water vapor mixing ratio at the surface is often less than 20% of that at 40 m (Figs. 1B and 2, bottom row). These remark-ably steep humidity gradients are conducive to phase changes when mixing brings these proximal, yet thermodynamically distinct, air masses in contact. However, the processes involved in controlling mois-ture exchange under stable conditions have not been studied, and thus, the influence that changes in atmospheric stability have on accumula-tion is unknown.
Water vapor isotopic profiles above the ice sheet
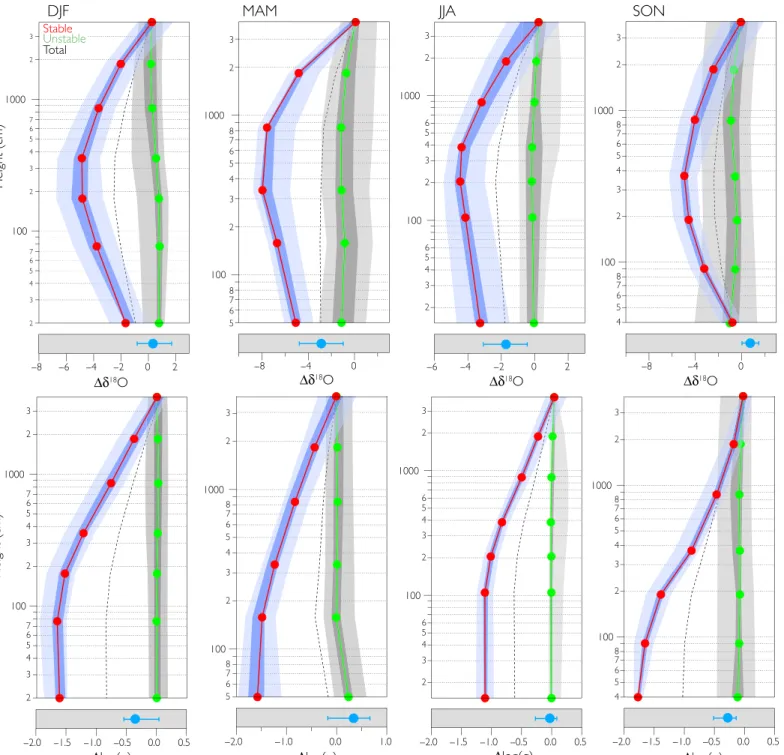
The vertical profiles of the stable water isotopic ratio are used to trace the presence of condensation or sublimation at or near the surface based on the understanding that condensation depletes the heavy isotopes from the water vapor remaining in the air. The most prominent feature in the water vapor isotopic profiles is the presence of a pronounced iso-topic minimum of 2 to 6‰ between 2 and 8 m above the ice surface during stable periods (Fig. 2, top row). To our knowledge, isotopic pro-files of this shape have not been observed elsewhere because previous studies only made summertime measurements and/or did not have suf-ficient vertical resolution to capture this feature (22, 23). This isotopic pattern is distinct from the water vapor mixing ratio profiles (Fig. 2, bottom row), which increase with height. The distinction between the shape of the water vapor mixing ratio and the isotopic ratio profiles arises because the former follows temperature, a consequence of the temperature dependence of water vapor saturation, whereas the latter
A B
Fig. 1. Humidity profiles over Summit Camp. (A) Distribution of the ratio between the water vapor mixing ratio at the surface (~0.1 m) and at ~40 m taken from hourly averaged profiles between 2012 and 2014. (B) Saturation mixing ratios as a function of temperature (47). Theoretical summer and winter mixing lines with schematic depictions of where the air inlets in Fig. 2 would be sampling.
on May 3, 2021
http://advances.sciencemag.org/
Fig. 2. Vertical profiles of the isotopic ratio (d18O) and humidity at Summit Camp. (Top) Isotopic ratio profile. (Bottom) Water vapor mixing ratio profile. The seasonal profiles were generated as the average of all hourly profiles from the respective time window and reported relative to the value at the top inlet. Red (green) lines are generated from profiles during stable (unstable) periods (fig. S3), and the error envelope represents the 66th and 90th percentiles. The dotted line is the average of all profiles. Blue dots below the profiles are the average isotopic ratios measured from the firn interstitial vapor. The error envelop for the firn vapor is 1 SD.
on May 3, 2021
http://advances.sciencemag.org/
is sensitive to the amount of condensation relative to the amount of wa-ter vapor at that height (Fig. 1B). Condensation preferentially removes heavy water isotopes from the air, which results in the observed isotopic depletion that occurs a few meters above the surface. Observations of persistent low-level fogs from a pair of particle probes at 2 and 10 m support this assertion.
To understand the physical origin of this isotopic feature, we must consider the processes driving the exchange of vapor and ice between the ice sheet and atmosphere. During spring and early summer, the firn is cooler than the air below the inversion, and if the latter is saturated (or near-saturated), it has a higher water vapor mixing ratio than the air in the pore spaces (24, 25). Under these circumstances, there is a tendency for the latent heat flux to be toward the surface. During stable periods in the winter months, the air below the inversion is cooler than both the air above and the firn air below, which retains heat from the previous sum-mer. Mixing across the inversion, a product of inversion-wind shear (12), generates condensation of moisture originating from the free tro-posphere and would produce low-level clouds and fog. Because the firn pore spaces are warmer than the air below the inversion, the air in the pore spaces remains at saturation with respect to the snow temperature, resulting in a higher water vapor mixing ratio than in the air below the inversion (26).
The isotopic minimum in the vapor above the surface during the winter therefore reflects a combination of two coexisting processes: one involving the upward mixing of firn air and the second involving downward shear mixing between the air parcels below and above the inversion (12). The condensation above the surface can be conceptua-lized as the atmospheric analog to the mechanism associated with the formation of“depth hoar,” which occurs through vapor diffusion and deposition toward the cold point in the snowpack (27). The temperature minimum above the surface of the ice sheet effectively acts as a trap of moisture by condensing vapor from the free troposphere and retaining water that has sublimated from the surface. Under these stable conditions, the mass added to the ice sheet from surface condensation
and settling of fog particles should follow free atmospheric temperatures because the only net exchange of moisture would be through conden-sation of moisture whose humidity would be set by the temperature of the overlying air mass. However, with increasing atmospheric stability, the near-surface atmosphere becomes isolated, which limits interaction between the surface and the reservoir of moisture available from air masses reaching the ice sheet from marine origins. We hypothesize that as decoupling between the surface and free tropospheric air increases, the ice sheet approaches a condition of zero net accumulation ir-respective of the temperature.
Budget closure model
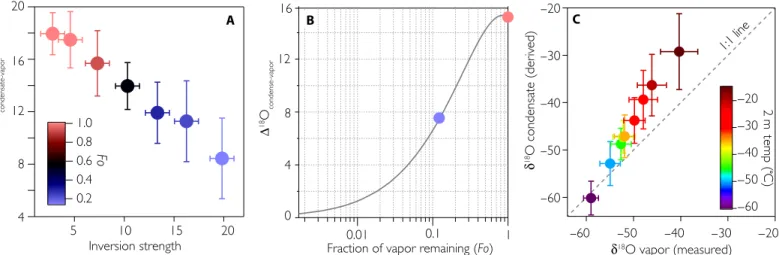
The extent of surface decoupling is quantified here using isotope ratio constraints on a mass balance calculation that imposes isolation (that is, a closed atmospheric column). The model used was a Rayleigh dis-tillation model, which describes the evolution of the isotopic ratios of the product (condensate) and reactant (vapor) as a system progressively loses moisture (28). As an air parcel cools and vapor condenses, the isotopic ratios of the instantaneous product and reactant become in-creasingly distinct from one another. This is because equilibrium fractionation is larger at low temperatures and is stronger for ice con-densation (29, 30). However, the isotopic ratio of the integrated conden-sate (“condensate reservoir”) approaches equivalence to the initial vapor source (that is, D18O = 0) as the distillation is completed, assuming that moisture in the atmospheric column is fully conserved (Fig. 3B). Using this model, simultaneous measurements of the isotopic ratios in both the condensate reservoir (Materials and Methods) and the vapor enable a quantification of the efficiency with which moisture is recycled be-tween the ice sheet and near-surface atmosphere. For simplicity, only the results for d18O are discussed, but fig. S4B indicates very consistent results between the two isotopic species.
During warmer periods (that is, when temperatures exceed−30°C), the difference between the daily averaged humidity-weighted isotopic ratio of the vapor and the collected frost/rime (hereafter D18O) is
C B
A
Fig. 3. Rayleigh distillation and inversion strength. (A) Isotopic difference between collected rime and simultaneous vapor (D18O) plotted as a function of inversion strength measured as the difference between the surface and 10-m temperatures. (B) Evolution of the difference between the condensation reservoir and the initial vapor source as a function of fraction of moisture remaining (Fo). The coloring of points corresponds to the Fo values in (A). (C) Isotopic composition of the surface latent heat flux derived using the gradient method against the isotopic composition of the background vapor. Profiles were selected only when the correlation coefficient between inverse of the water vapor mixing ratio and d18O exceeded 0.8 (43). Colored dots show the inferred isotopic fluxes and measured isotopic ratio of the vapor for 5°C bins. The fit of the derived flux against the background vapor intercepts with the 1:1 line at cold temperatures, providing a similar perspective on hydrological closure during the winter season as depicted in (A) and (B).
on May 3, 2021
http://advances.sciencemag.org/
~20‰, which is consistent with the value expected for condensation of ice occurring under equilibrium conditions within this temperature range (fig. S4A) (22, 25, 29, 30). As ambient temperatures cool below −30°C, D18O diminishes with temperature. The negative correlation
be-tween D18O and temperature is contrary to expectations based on em-pirical measurements of equilibrium liquid/ice-vapor fractionation in a system where the reservoir of vapor is continually replenished (29–31). Molecular diffusion during ice nucleation would reduce the magnitude of the D18O value (32). However, even with liberal consideration of these effects [for example,Werner et al. (33) and Majoube (29); fig. S4A], the observed D18O remains significantly different than theory based on fractionation during condensation would predict. The odd occurrence of coexisting phases of water (ice and vapor) with such similar isotopic ratios suggests nearly complete isolation of the ice sheet during typical winter
conditions. This is in clear contrast to the average D18O during summer, which is consistent with a well-ventilated atmospheric column.
Further support for this observation emerges by comparing the iso-topic composition of the vapor and the inferred isoiso-topic ratio of the la-tent heat flux derived using the profile mixing model described by Noone et al. (34), based on the Keeling plot method (Fig. 3C) (35). This method does not compare in situ vapor measurements with collected rime or frost, but uses inferred estimates of the isotopic ratio of the latent heat flux (Materials and Methods). The vast majority of boundary layer profiles show the presence of an isotopic flux enriched relative to the background vapor (Fig. 3C), consistent with the expectation that the condensate is preferentially accumulating heavy isotopologues. However, during the winter season when temperatures cool and the boundary layer is persistently stable (Fig. 4), the inferred isotopic composition
∆
A B
C D
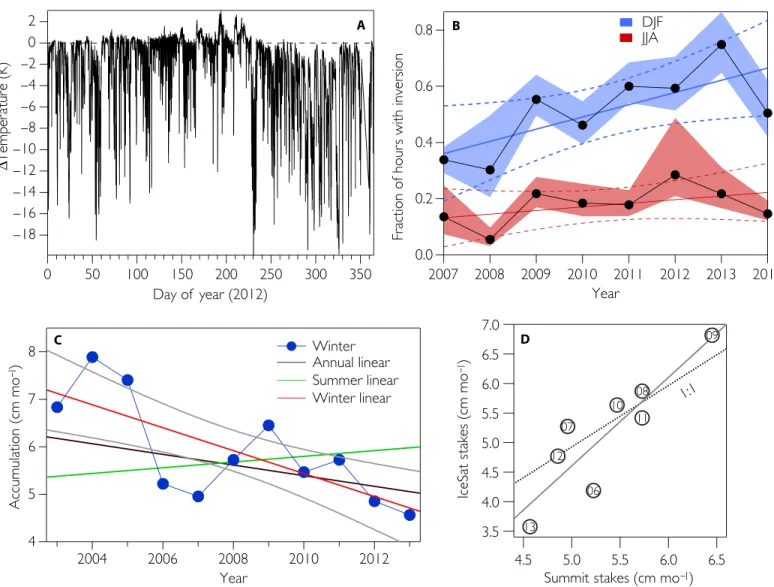
Fig. 4. Temperature inversions and accumulation at Summit Camp. (A) Seasonal cycle of inversion strength inferred by subtracting temperatures recorded at the uppermost and lowermost temperature probes. (B) Trend in winter (blue) and summer (red) inversion frequency. The error envelope shows the response of the trend to shifting the threshold for an“inversion event” between 2° and 4°C. A best-fit line through the annual data and 95% confidence interval on the fit are also shown. (C) Recent accumulation near Summit Camp assessed by looking at the burial rate of a series of bamboo poles (48). Best-fit lines for the different seasons [annual, NDJFM (November to March), and MJJAS (May to September)] and the 90% confidence interval for NDJFM (gray lines) are shown. (D) Comparison between winter accumulation from Summit and the nearby IceSat site using the same technique. The numbers correspond to the year (that is,“06” is 2006). The dotted line is the 1:1 line, and the solid line is the best-fit linear regression showing that there are local differences in total accumulation but interannual variability is consistent.
on May 3, 2021
http://advances.sciencemag.org/
of the condensate intersects with the isotopic ratio of the near-surface vapor. This, again, is contrary to expectations that fractionation is greater at colder temperatures (29–31), and supports our hypothesis that during stable periods, a hydrological equilibrium emerges where condensation and surface fluxes become balanced and there is no net accumulation (or loss) of mass.
By assuming that D18O is set only through distillation of moisture as it rises through the boundary layer, the calculation shows that virtually all of the available moisture condenses and there is minimal replace-ment of near-surface water vapor with that available from the reservoir in the warmer free troposphere. However, there is a limit to the amount of condensation possible. The limit is set by the minimum amount of condensation required to bring the air, saturated with respect to the firn temperature, to saturation at the coldest point in the inversion (Fig. 1A). To satisfy the observed condition that coexisting phases of water (vapor and condensate) have similar isotopic ratios but distillation cannot run to completion (that is, D18O = 0), an additional set of processes must be invoked to bring a flux of isotopically heavy vapor into the near-surface air. One hypothesis is that under these stable conditions, a steady state emerges where condensation is acting to deplete the isotopic compo-sition of the vapor, which, in turn, produces a strong isotopic gradient between the firn air and near-surface vapor. This generates a flux of iso-topically enriched air into the near-surface atmosphere. The balance be-tween the removal of moisture to condensate and replenishment by isotopically enriched firn air maintains isotopic equivalence between the vapor and condensate phases.
DISCUSSION
Using the first extended year-round observations of water vapor iso-topes at Summit, Greenland, we document the presence of a persistent isotopic depletion between 2 and 8 m above the surface of the ice sheet (Fig. 2). The isotopic minimum is present under stable atmospheric conditions, which is the predominant state during the winter months, and common all year (Fig. 4). This feature emerges because of the forma-tion of surface fogs and low-level clouds, which preferentially condense out heavy isotopes and leave behind vapor that is isotopically depleted. In typical nonpolar environments, such as forests, isotopic fluxes associated with phase change generally occur directly onto or from surfaces. The results from Summit indicate an“ethereal” surface just above the ice sheet that forms because of anomalously steep humidity (and temperature) gradients, which promote condensation not associated with synoptic storms (Fig. 1). This is analogous to a forest canopy where a dense con-centration of leaves produces a second surface above the ground. Below this ethereal surface, vapor is effectively trapped through condensation and settling of hydrometeors (Fig. 3). From a hydrological standpoint, the atmosphere near the surface is apparently almost completely isolated from the free troposphere under typical winter conditions.
In the context of the GrIS, Summit represents a somewhat unique environment because it is situated in a region of minimal relief. Other locations off the peak of the ice sheet are affected by katabatic winds that occur during inversion events (12). These wind events increase shear mixing and would decrease the isolation of the surface even during strong surface temperature inversions. The conditions we document at Summit therefore represent an end-member in terms of the extent that the surface can experience decoupling. However, the moisture bud-gets at Summit and similar low-relief high-altitude sites in Greenland
and Antarctica are critical to constrain because it is these regions where most extended ice core records have been developed. Closing the hydro-logic and isotopic budget at sites like Summit is therefore necessary to quantitatively interpret the physical mechanisms associated with the large changes in accumulation that occurred in response to past epi-sodes of global climate change (6).
When these results are combined with previous work on latent heat fluxes from Summit (16, 19), it can be concluded that, during turbulent periods, condensation onto the surface leads to a net positive latent heat flux, whereas stable periods are associated with no net moisture ex-change. The summertime hydrological budget is therefore set by both surface-atmosphere exchange (that is, condensation and sublimation/ evaporation) and synoptic storm events (25), and the hydrologic budget during winter is effectively closed with the exception of moisture delivered during storm events.
Boundary layer structure and ice accumulation
The cumulative effect of boundary layer moisture recycling on accumu-lation is difficult to isolate because the combination of persistently stable conditions and the presence of blowing snow continues to hinder quan-titative closure of the hydrological budget (19, 36). However, tempera-ture profiles from the research tower at Summit indicate that the wintertime boundary layer has become increasingly stable over the past decade, which affords an opportunity to consider how these changes may have influenced recent accumulation trends (Fig. 4). It can be as-sumed that surface condensation and settling hydrometeors produce a significantly smaller flux than precipitation events, with the latter providing the dominant control on interannual accumulation variabil-ity. However, the decoupling of the surface layer implies that even though sublimation rates are temperature-dependent, the net loss of moisture from this process would be more strongly dependent on the structure of the atmosphere. Thus, with the trend of increasing stability, the negative flux associated with wintertime sublimation has been decreasing despite rising temperatures (fig. S5). Additionally, the pres-ence of fogs and near-surface condensate would be increasing under these conditions, producing an indirect effect on the hydrologic budget by changing the radiative properties at the surface (37). These changes may be important in modulating the slope between temperature and accumulation, which is a common but variable feature in ice core re-cords across various time scales (8). Ultimately, the processes that link broad Arctic climate changes, such as shifting storm tracks and sea ice retreat (38) to the fine-scale atmospheric structure over the ice sheet, are not well known, nor are they currently considered in climate models. In light of the unique way boundary layer conditions at Summit influence water fluxes, it is likely necessary to consider these processes when forecasting or hindcasting the response of ice accumulation to climate change (39).
MATERIALS AND METHODS
Field system
Seven 1/2-inch OD cleaned copper tubes were installed at 20, 120, 220, 400, 900, 1900, and 3900 cm on the southern face of the 4800-cm me-teorological tower, located at the northern edge of the clean-air sector at Summit Camp (fig. S2). The tubes were insulated in foam and aggres-sively heated (50°C) to prevent condensation. Air flow through the tubes was maintained at≥5 liters/min by splitting the 50 liter/min flow from a
on May 3, 2021
http://advances.sciencemag.org/
Varian IDP-3 dry scroll vacuum pump between the inlet lines. The tubes were plumbed into a manifold mounted with three-way SMC VT-series solenoid values. The valves were activated in succession at 10-min intervals. A second pump (KNF Laboport) was installed down-stream of the manifold to increase flow rates between the manifold in-ternal volume and the inlet to the instrument cavity. The response time between the inlet and the instrument cavity was measured to be less than 1 min (fig. S2). This was measured by introducing ethanol at the inlet and timing the response by the instrument. The response time var-ied systematically as a function of inlet height (that is, tubing length). The first 4.5 min of the sampling period at each height was removed to minimize the influence of the previous inlet on the cavity and interior plumbing. All plumbing was done with copper because it was deemed to have the least effects on the isotopic composition of the vapor compared to other common tubing. During July of 2013, the lowermost inlet (in-stalled during the previous season) was replaced with a custom inlet that was buried in the firn to sample pore space vapor. The firn vapor sampling was accomplished by burying a perforated 1-liter vessel at 20 cm below the surface. To minimize sublimation, pore space air was allowed to fill the 1-liter volume without any active flow. Flow through this inlet was only initiated once every hour for 10 min at a flow rate of 0.2 liters/min using a programmed mass flow controller (Parker MPC series). Instrument calibration
A custom dew point generator was plumbed into the system, and the vapor produced was introduced into the instrument through a three-way valve, allowing the system to measure the sample or standard vapor (fig. S2). The calibration stream was generated by circulating ultradry air [≤100°C dew point/≤2 ppm (parts per million) of water] into a temperature-controlled 10-liter sealed water pool. The saturated air was then diluted by mixing dry air into the vapor stream. Dilution was accomplished in a two-step process enabling fine control of the humidity of the standard vapor over the range of 20 to 20,000 ppm. Standard air was measured at three humidity levels (ranging from 20 to 10,000 ppm) following every four atmospheric profiles.
Vapor volume mixing ratios from the Picarro spectrometer were calibrated periodically using a LiCor LI610 dew point generator. Isotope ratio measurements were corrected both for concentration dependence and deviation from the Vienna Standard Mean OceanWater (VSMOW)– Standard Light Antarctic Precipitation (SLAP) scale (40). Biases arising from the instrument’s concentration dependence were monitored over the course of the experiment using the custom dew point generator sys-tem, described above. These biases, which were found to be stable with time, were modeled using a locally weighted 2° polynomial (non-parametric) regression (with spanning parameters of 0.5 and 0.95 for d18O and dD, respectively), and the resulting predictions were sub-tracted from the observations (21). The dew point generator was also used to monitor instrumental precision; however, because long-term drift in the calibration data was not distinguishable from isotopic changes predicted by distillation of the dew point generator’s liquid res-ervoir, this trend was not subtracted from the ambient data. Following correction of the concentration dependence, deviations from the VSMOW-SLAP scale were addressed by applying a slope and offset cor-rection. These parameters were derived in July 2013 and confirmed in July 2014 by fitting a linear regression between known values of three flash-evaporated isotopic standards and the Picarro output values. The largest uncertainty in the isotope ratio measurements stemmed from increasing variability as the water vapor volume mixing ratio decreased
seasonally. The error was 0.5‰ on d18O at a typical summer humidity of 5000 ppm, and 2‰ at 200 to 300 ppm in winter. The results here depended on both precision, which was necessary for quantifying the shape of the vertical isotopic profiles, and accuracy, which was necessary for comparing vapor measurements with the rime and frost samples mea-sured separately in the laboratory. The error bars depicted in Fig. 2 arose from the full characterization of the multiple error sources and repeat measurement of profiles. The methods used here were similar to those of several previous studies (23, 25, 34, 41–43), except the calibration steps were done simultaneously, which had an important effect of allowing some systematic error to be removed. For further details about data treatment and bias assessment, readers are referred to Baileyet al. (21). Treatment of humidity data
Following calibration of the isotopic and humidity data, the data from each inlet were binned (no interpolation was performed) onto an hourly time scale. For each profile, the value from the top inlet was subtracted to generate a vertical structure that was not sensitive to seasonal and synoptic variations. Profiles from stable and unstable periods (derived using the inversion strength; fig. S4) were averaged to generate compo-site seasonal profiles for each of the two end-member stability states. Because inlet heights varied during the course of the experiment, the height of an inlet was taken as the average height of that inlet over a given sampling period (for example, MAM 2013). Therefore, the exact profile structure had a small amount of uncertainty that arose from a systematic decrease in the inlet height. The measurements were the total water measurement, a combination of both small condensate and vapor in the atmosphere. Whereas the measurements were weighted toward a water vapor sample, there was likely some flow of hydrometeors into the inlet system. This effect was reduced by widening the diameter at the mouth of the inlet, thus diminishing the flow rate at the intake and re-ducing the sampling efficiency of condensate greater than 50 mm. This effect was tested by comparing the profiles taken when condensed water was and was not present in the atmosphere, inferred from particle spectro-meters on the tower. The similarities between these profiles suggested that the reported measurements were dominated by a vapor measure-ment and/or that the measuremeasure-ments were minimally sensitive to the presence of condensate in the air.
Meteorological data
A number of additional sensors were used for the analyses. Two shielded and aspirated Vaisala HMP155 temperature and humidity probes were installed at approximately 2 and 10 m. An Apogee infrared temperature sensor was installed on a small 3-m tower adjacent to the Research tower. Snow accumulation was measured using a Campbell Scientific Sonic Ranging Sensor (SR50A) with a speed of sound correction applied using the Vaisala 2-m temperature probe. All aforementioned data streams were logged using a Campbell Scientific CR1000 Datalogger, and the temporal resolution was reduced to hourly for direct compar-ison with the humidity profile data. The data in fig. S5 were accessed from the GC-NET archive (44). We explicitly defined stable periods (for example, Fig. 2) as hours when the surface temperature inversion exceeded 3°C, a threshold that was defined by the intercept between in-version strength and the critical Bulk Richardson number (fig. S3) (45). Laboratory analyses
Each day during the campaign period, technicians at Summit Camp collected any rime or frost that collected on the tower or on a nearby
on May 3, 2021
http://advances.sciencemag.org/
flag. These samples were collected in plastic bags and transferred to Nal-gene bottles where they were stored frozen until they were shipped back to the University of Colorado. Upon arrival, samples were melted, pipetted into 1.8-ml vials with septa caps, and analyzed on a Picarro L2120-i isotopic analyzer following standard methods (34, 46).
SUPPLEMENTARY MATERIALS
Supplementary material for this article is available at http://advances.sciencemag.org/cgi/ content/full/2/4/e1501704/DC1
fig. S1. Air temperature time series for the Summit research tower. fig. S2. Diagram showing the vapor sampling system.
fig. S3. Hourly Bulk Richardson number calculated at the 2-m height using the 2D sonic wind and temperature data from the Summit Camp research tower.
fig. S4. Isotopic difference between vapor and condensate. fig. S5. Recent DJF and JJA temperature trends for Summit.
REFERENCES AND NOTES
1. T. Jacob, J. Wahr, W. T. Pfeffer, S. Swenson, Recent contributions of glaciers and ice caps to sea level rise. Nature 482, 514–518 (2012).
2. D. K. Hall, J. C. Comiso, N. E. DiGirolamo, C. A. Shuman, J. E. Box, L. S. Koenig, Variability in the surface temperature and melt extent of the Greenland ice sheet from MODIS. Geophys. Res. Lett. 40, 2114–2120 (2013).
3. C. Harig, F. J. Simons, Mapping Greenland’s mass loss in space and time. Proc. Natl. Acad. Sci. U.S.A. 109, 19934–19937 (2012).
4. P. A. O’Gorman, T. Schneider, The physical basis for increases in precipitation extremes in simulations of 21st-century climate change. Proc. Natl. Acad. Sci. U.S.A. 106, 14773–14777 (2009). 5. D. McGrath, W. Colgan, N. Bayou, A. Muto, K. Steffen, Recent warming at Summit
Green-land: Global context and implications. Geophys. Res. Lett. 40, 2091–2096 (2013). 6. D. A. Meese, A. Gow, P. Grootes, M. Stuiver, P. A. Mayewski, G. Zielinski, M. Ram, K. Taylor,
E. Waddington, The accumulation record from the GISP2 core as an indicator of climate change throughout the Holocene. Science 266, 1680–1682 (1994).
7. R. B. Alley, D. A. Meese, C. A. Shuman, A. J. Gow, K. C. Taylor, P. M. Grootes, J. W. C. White, M. Ram, E. D. Waddington, P. Mayewski, Abrupt increase in Greenland snow accumulation at the end of the Younger Dryas event. Nature 362, 527–529 (1993).
8. W. R. Kapsner, R. B. Alley, C. A. Shuman, S. Anandakrishnan, P. M. Grootes, Dominant in-fluence of atmospheric circulation on snow accumulation in Greenland over the past 18,000 years. Nature 373, 52–54 (1995).
9. V. Masson-Delmotte, J. Jouzel, A. Landais, M. Stievenard, S. J. Johnsen, J. W. C. White, M. Werner, A. Sveinbjornsdottir, K. Fuhrer, GRIP deuterium excess reveals rapid and orbital-scale changes in Greenland moisture origin. Science 309, 118–121 (2005).
10. A. Rhines, P. J. Huybers, Sea ice and dynamical controls on preindustrial and last glacial maximum accumulation in central Greenland. J. Climate 27, 8902–8917 (2014). 11. C. Appenzeller, T. F. Stocker, M. Anklin, North Atlantic oscillation dynamics recorded in
Greenland ice cores. Science 282, 446–449 (1998).
12. S. R. Hudson, R. E. Brandt, A look at the surface-based temperature inversion on the Antarctic Plateau. J. Climate 18, 1673–1696 (2005).
13. N. B. Miller, D. D. Turner, R. Bennartz, M. D. Shupe, M. S. Kulie, M. P. Cadeddu, V. P. Walden, Surface-based inversions above central Greenland. J. Geophys. Res. Atmos. 118, 495–506 (2013).
14. D. Helmig, S. J. Oltmans, T. O. Morse, J. E. Dibb, What is causing high ozone at Summit, Greenland? Atmos. Environ. 41, 5031–5043 (2007).
15. E. Girard, J.-P. Blanchet, Simulation of arctic diamond dust, ice fog, and thin stratus using an explicit aerosol-cloud-radiation model. J. Atmos. Sci. 58, 1199–1221 (2001). 16. J. E. Box, K. Steffen, Sublimation on the Greenland ice sheet from automated weather
station observations. J. Geophys. Res. 106, 33965–33981 (2001).
17. J.-C. Gallet, F. Domine, J. Savarino, M. Dumont, E. Brun, The growth of sublimation crystals and surface hoar on the Antarctic plateau. The Cryosphere 8, 1205–1215 (2014). 18. T. Foken, 50 years of the Monin–Obukhov similarity theory. Boundary Layer Meteorol. 119,
431–447 (2006).
19. N. J. Cullen, K. Steffen, P. D. Blanken, Nonstationarity of turbulent heat fluxes at Summit, Greenland. Boundary Layer Meteorol. 122, 439–455 (2007).
20. I. D. Clark, P. Fritz, Environmental Isotopes in Hydrogeology (CRC Press, Boca Raton, FL, 1997). 21. A. Bailey, D. Noone, M. Berkelhammer, H. C. Steen-Larsen, P. Sato, The stability and cali-bration of water vapor isotope ratio measurements during long-term deployments. Atmos. Meas. Tech. 8, 4521–4538 (2015).
22. P. Grootes, M. Stuiver, Oxygen 18/16 variability in Greenland snow and ice with 10–3to 105
year time resolution. J. Geophys. Res. 102, 26455–26470 (1997).
23. H. C. Steen-Larsen, S. J. Johnsen, V. Masson-Delmotte, B. Stenni, C. Risi, H. Sodemann, D. Balslev-Clausen, T. Blunier, D. Dahl-Jensen, M. Ellehøj, S. Falourd, A. Grindsted, V. Gkinis, J. Jouzel, T. Popp, S. Sheldon, S. B. Simonsen, J. Sjolte, J. P. Steffensen, P. Sperlich, A. E. Sveinbjörnsdóttir, B. M. Vinther, J. W. C. White, Continuous monitoring of summer surface water vapor isotopic composition above the Greenland Ice Sheet. Atmos. Chem. Phys. 13, 4815–4828 (2013).
24. M. S. Town, S. G. Warren, V. P. Walden, E. D. Waddington, Effect of atmospheric water vapor on modification of stable isotopes in near-surface snow on ice sheets. J. Geophys. Res. 113, D24303 (2008).
25. H. C. Steen-Larsen, V. Masson-Delmotte, M. Hirabayashi, R. Winkler, K. Satow, F. Prié, N. Bayou, E. Brun, K. M. Cuffey, D. Dahl-Jensen, M. Dumont, M. Guillevic, S. Kipfstuhl, A. Landais, T. Popp, C. Risi, K. Steffen, B. Stenni, A. E. Sveinbjörnsdottír, What controls the isotopic composition of Greenland surface snow? Clim. Past 10, 377–392 (2014). 26. R. W. Style, M. G. Worster, Frost flower formation on sea ice and lake ice. Geophys. Res. Lett.
36, L11501 (2009).
27. R. B. Alley, Concerning the deposition and diagenesis of strata in polar firn. J. Glaciol. 34, 283–290 (1988).
28. J. R. Gat, Oxygen and hydrogen isotopes in the hydrologic cycle. Annu. Rev. Earth Planet. Sci. 24, 225–262 (1996).
29. M. Majoube, Fractionation factor of18O between water vapour and ice. Nature 226, 1242 (1970).
30. M. D. Ellehoj, H. C. Steen-Larsen, S. J. Johnsen, M. B. Madsen, Ice-vapor equilibrium frac-tionation factor of hydrogen and oxygen isotopes: Experimental investigations and impli-cations for stable water isotope studies. Rapid Commun. Mass Spectrom. 27, 2149–2158 (2013).
31. J. Horita, D. J. Wesolowski, Liquid-vapor fractionation of oxygen and hydrogen isotopes of water from the freezing to the critical temperature. Geochim. Cosmochim. Acta 58, 3425–3437 (1994).
32. J. Jouzel, L. Merlivat, Deuterium and oxygen-18 in precipitation: Modelling of the isotopic effects during snow formation. J. Geophys. Res. 89, 11749–11757 (1984).
33. M. Werner, P. M. Langebroek, T. Carlsen, M. Herold, G. Gerrit, Stable water isotopes in the ECHAM5 general circulation model: Toward high-resolution isotope modeling on a global scale. J. Geophys. Res. 116, D15109 (2011).
34. D. Noone, C. Risi, A. Bailey, M. Berkelhammer, D. P. Brown, N. Buenning, S. Gregory, J. Nusbaumer, D. Schneider, J. Sykes, B. Vanderwende, J. Wong, Y. Meillier, D. Wolfe, Determining water sources in the boundary layer from tall tower profiles of water vapor and surface water isotope ratios after a snowstorm in Colorado. Atmos. Chem. Phys. 13, 1607–1623 (2013).
35. C. D. Keeling, The concentration and isotopic abundances of atmospheric carbon dioxide in rural areas. Geochim. Cosmochim. Acta 13, 322–334 (1958).
36. B. B. Castellani, M. D. Shupe, D. R. Hudak, B. E. Sheppard, The annual cycle of snowfall at Summit, Greenland. J. Geophys. Res. 120, 6654–6668 (2015).
37. R. Bennartz, M. D. Shupe, D. D. Turner, V. P. Walden, K. Steffen, C. J. Cox, M. S. Kulie, N. B. Miller, C. Pettersen, July 2012 Greenland melt extent enhanced by low-level liquid clouds. Nature 496, 83–86 (2013).
38. R. Bintanja, F. Selten, Future increases in Arctic precipitation linked to local evaporation and sea-ice retreat. Nature 509, 479–482 (2014).
39. J. G. Fyke, M. Vizcaíno, W. H. Lipscomb, The pattern of anthropogenic signal emergence in Greenland Ice Sheet surface mass balance. Geophys. Res. Lett. 41, 6002–6008 (2014). 40. T. B. Coplen, Normalization of oxygen and hydrogen isotope data. Isot. Geosci. 72, 293–297
(1988).
41. J. Galewsky, C. Rella, Z. Sharp, K. Samuels, D. Ward, Surface measurements of upper tro-pospheric water vapor isotopic composition on the Chajnantor Plateau, Chile. Geophys. Res. Lett. 38, L17803 (2011).
42. J.-L. Bonne, H. C. Steen-Larsen, C. Risi, M. Werner, H. Sodemann, J.-L. Lacour, X. Fettweis, G. C esana, M. Delmotte, O. C attani, P. Vallelonga, H. A. Kjær, C . Clerbaux, Á. E. Sveinbjörnsdóttir, V. Masson-Delmotte, The summer 2012 Greenland heat wave: In situ and remote sensing observations of water vapor isotopic composition during an at-mospheric river event. J. Geophys. Res. 120, 2970–2989 (2015).
43. M. Berkelhammer, J. Hu, A. Bailey, D. Noone, C. J. Still, H. Barnard, D. Gochis, G. S. Hsiao, T. Rahn, A. Turnipseed, The nocturnal water cycle in an open-canopy forest. J. Geophys. Res. 118, 10225–10242 (2013).
44. K. Steffen, J. Box, W. Abdalati, Greenland climate network: GC-Net. US Army Cold Regions Reattach and Engineering (CRREL), CRREL Special Report (1996), pp. 98–103.
45. J. A. Businger, J. C. Wyngaard, Y. Izumi, E. F. Bradley, Flux-profile relationships in the at-mospheric surface layer. J. Atmos. Sci. 28, 181–189 (1971).
46. W. A. Brand, H. Geilmann, E. R. Crosson, C. W. Rella, Cavity ring-down spectroscopy versus high-temperature conversion isotope ratio mass spectrometry; a case study on d2H and
d18O of pure water samples and alcohol/water mixtures. Rapid Commun. Mass Spectrom.
23, 1879–1884 (2009).
on May 3, 2021
http://advances.sciencemag.org/
47. D. M. Murphy, T. Koop, Review of the vapour pressures of ice and supercooled water for atmospheric applications. Q. J. Roy. Meteorol. Soc. 131, 1539–1565 (2005).
48. J. E. Dibb, M. Fahnestock, Snow accumulation, surface height change, and firn densifica-tion at Summit, Greenland: Insights from 2 years of in situ observadensifica-tion. J. Geophys. Res. 109, D24113 (2004).
Acknowledgments: We would like to acknowledge the staff at Summit Camp including the National Oceanic and Atmospheric Administration (NOAA) science techs and the pilots and crews of the Air National Guard and Polar Field Services, particularly K. Gorham, for all the logistical support. Funding: Funding for this work was made available from NSF Award 1023574 to D.C.N., J.W.C.W., D.S., and K.S. C.J.C. and H.C.S.-L. acknowledge support from the Cooperative Institute for Research in Environmental Sciences (CIRES) Visiting Fellows Program, and C.J.C. acknowledges support from the NOAA Climate Program Office. H.C.S.L. acknowledges support from the Danish Council for Independent Research, Award 10-092850. Author con-tributions: All authors conceived the research. All authors designed the analyses. M.B., D.C.N., and
A.B. conducted the analyses. M.B. wrote the manuscript. Competing interests: The authors declare that they have no competing interests. Data and materials availability: All data used to obtain the conclusions in this paper will be available in the Advanced Cooperative Arctic Data and Information Service (ACADIS) data repository or presented in the paper and/or the Sup-plementary Materials. Additional data related to this paper may be requested from the authors.
Submitted 24 November 2015 Accepted 31 March 2016 Published 29 April 2016 10.1126/sciadv.1501704
Citation: M. Berkelhammer, D. C. Noone, H. C. Steen-Larsen, A. Bailey, C. J. Cox, M. S. O’Neill, D. Schneider, K. Steffen, J. W. C. White, Surface-atmosphere decoupling limits accumulation at Summit, Greenland. Sci. Adv. 2, e1501704 (2016).
on May 3, 2021
http://advances.sciencemag.org/
David Schneider, Konrad Steffen and James W. C. White
Max Berkelhammer, David C. Noone, Hans Christian Steen-Larsen, Adriana Bailey, Christopher J. Cox, Michael S. O'Neill,
DOI: 10.1126/sciadv.1501704 (4), e1501704.
2
Sci Adv
ARTICLE TOOLS http://advances.sciencemag.org/content/2/4/e1501704
MATERIALS
SUPPLEMENTARY http://advances.sciencemag.org/content/suppl/2016/04/26/2.4.e1501704.DC1
REFERENCES
http://advances.sciencemag.org/content/2/4/e1501704#BIBL
This article cites 46 articles, 5 of which you can access for free
PERMISSIONS http://www.sciencemag.org/help/reprints-and-permissions
Terms of Service
Use of this article is subject to the
is a registered trademark of AAAS. Science Advances
York Avenue NW, Washington, DC 20005. The title
(ISSN 2375-2548) is published by the American Association for the Advancement of Science, 1200 New Science Advances
Copyright © 2016, The Authors
on May 3, 2021
http://advances.sciencemag.org/