HAL Id: hal-03165299
https://hal.archives-ouvertes.fr/hal-03165299
Submitted on 10 Mar 2021
HAL is a multi-disciplinary open access
archive for the deposit and dissemination of
sci-entific research documents, whether they are
pub-lished or not. The documents may come from
teaching and research institutions in France or
abroad, or from public or private research centers.
L’archive ouverte pluridisciplinaire HAL, est
destinée au dépôt et à la diffusion de documents
scientifiques de niveau recherche, publiés ou non,
émanant des établissements d’enseignement et de
recherche français ou étrangers, des laboratoires
publics ou privés.
Spheroidal graphite coalescence during thermal cycling
in the ferritic domain of a high-silicon cast iron studied
by optical microscopy and X-ray computed tomography
Mariana Alves Pegoraro, Christophe Tenailleau, André Ebel, Benoit Malard,
Jacques Lacaze
To cite this version:
Mariana Alves Pegoraro, Christophe Tenailleau, André Ebel, Benoit Malard, Jacques Lacaze.
Spheroidal graphite coalescence during thermal cycling in the ferritic domain of a high-silicon cast
iron studied by optical microscopy and X-ray computed tomography. Materials Today
Communica-tions, Elsevier, 2020, 25, pp.101422. �hal-03165299�
Any correspondence concerning this service should be sent
to the repository administrator:
tech-oatao@listes-diff.inp-toulouse.fr
This is an author’s version published in:
http://oatao.univ-toulouse.fr/26648
To cite this version: Pegoraro, Mariana Alves and Tenailleau,
Christophe and Ebel, André and Malard, Benoit and Lacaze,
Jacques Spheroidal graphite coalescence during thermal cycling
in the ferritic domain of a high-silicon cast iron studied by optical
microscopy and X-ray computed tomography. (2020) Materials
Today Communications, 25. 101422. ISSN 23524928
Official URL
DOI :
https://doi.org/10.1016/j.mtcomm.2020.101422
Open Archive Toulouse Archive Ouverte
OATAO is an open access repository that collects the work of Toulouse
researchers and makes it freely available over the web where possible
Spheroidal graphite coalescence during thermal cycling in the ferritic
domain of a high-silicon cast iron studied by optical microscopy and X-ray
computed tomography
Mariana Alves Pegoraro
a, Christophe Tenailleau
a·
*
, André Ebel
a,
b, Benoit Malard
a,
Jacques Lacaze
aa CIRIMAT, Université de Toulouse, CNRS, .Fnmce b LCTS, Université de Bordeaux, France
ABS TRAC T
Keywords:
Optical microscopy X-ray computed tomography Spheroidal graphite coalescence High-silicon cast iron Alloys
Materials characterization
High-silicon cast irons remain ferritic at higher temperature than usual cast irons and present both better oxi dation resistance and higher mechanical strength. Such a high-silicon spheroidal graphite cast iron was heat treated up to 50 h in total at 800 °C in two clifferent manners: under isothermal and cyclic conditions. Under the isothermal condition, the distribution of graphite inclusions did not vary significantly. On the contrary, tem perature cycling led to spectactùar coalescence whose evolution was observed after 1000, 2000 and 3000 cycles. Quite unexpectedly, the largest graphite particles - that were growing because of coalescence - showed an ir regular outer surface after 1000 cycles, which evolved in impressive dendritic instabilities and then large pro tuberances after 2000 and 3000 cycles. Optical microscopy and X -ray computed tomography (XCT) were used to quantitatively study these microstructural changes.
1. Introduction
Cast irons are widely used in buildings (water pipes for instance), automotive (machines, engines and exhaust manifolds) and wind power (hubs) industries due to a combination of good casting properties and high mechanical properties. A graphitic cast iron is a composite mate rial made of graphite precipitates within a Fe-rich matrix. It is primarily composed of iron, carbon and silicon, but other elements can be added to modify graphite shape and mechanical properties of the matrix. High silicon cast irons have been developed in the 1980's for automotive applications due to the increase of the upper temperature at which ferrite is stable [l]. Further, silicon improves oxidation resistance which is also an important property for parts included in propulsion systems [2]. For the last few years, high silicon grades have also been developed for other applications because of the intrinsic strengthening effect of this element on the material.
In the usual cast irons, graphite takes on a so-called lamellar shape. However, adding a small amount of magnesium and inoculating the melt leads to the formation of discrete graphite spheroids [3] with an associated marked increase in mechanical properties. Intermediate spheroidizing treatment may lead to varions shapes of graphite known as compacted graphite with intermediate properties and better casting
• Corresponding author.
soundness than spheroidal graphite irons (SGI) [4]. Control of the graphite particle shape is of utmost importance as this affects service properties, but is in practice difficult as this is sensitive to the casting conditions (cooling rate) and the presence of low-level of impurities
[5].
This shape control is most generally carried out on 2D metallo graphic sections though 3D reconstructions have often given significant insight supporting better understanding of the microstructure forma tion in cast irons. It is worth mentioning here the patient work con sisting in successive polishing of a 2D section until sufficient informa tion can be gained to build 3D patterns. This allowed showing that cells of coral graphite [6] and compacted graphite [7] are both consisting of interconnected particles of graphite. Application of modem analytical means to cast irons started with the use of focused ion beam (FIB) milling by Velichko and Mücklich [8]. X-ray computed tomography (XCT) with a laboratory source [9] or with a synchrotron [10,11] al lowed to perform a full reconstruction of large (mm size) compacted graphite cells. Also, the formation of spheroidal graphite during soli dification could be followed on thin samples [12] and on mm size samples [13,14]. These above 3D works provided also quantitative in formation on the graphite size and shape distribution. Regarding SGI, more systematic studies have been carried out using laboratory XCT,
E-mail aMress: tenailleau@chimie.ups-tlse.fr (C. Tenailleau).
M.A. Pegoraro, et aL
e.g. to compare 3D size distributions as calculated from 2D observation and 3D measured distributions [15,16]. Yayun Yin et al. [17] in vestigated tbe effect of casting section size (cooling rate) on tbe 3D size and shape distribution of spheroids.
The objective of tbis paper is to precisely document tbe possibilities offered by 3D investigations as tbey appear particularly suited to quantitatively describe spheroidal graphite overgrowtbs which have been recently evidenced after tbermal cycling at 800 °C of high silicon cast irons [18]. It is wortb stressing tbat it bas been verified by dif ferential tbermal analysis tbat tbis maximum temperature is lower tban tbe temperature for tbe start of tbe transformation of ferrite to auste nite. The phenomenon investigated here thus proceeds witbout phase change but it could drive to a dramatic decrease in tbe mechanical properties depending on its actual 3D extension. When only 2D quali tative observations were reported in tbis preliminary work, botb optical microscopy and XCT were used here to systematically quantify the microstructural variations. While the former technique is easily acces sible and gives highly resolute sectional images down to a sub-micro meter scale, tbe latter is particularly useful to obtain a large number of sample layers in a non-destructive manner and to give detailed particle size, connection and shape distribution over tbe whole volume of analysis.
2. Experimental details
2.1. Materials preparation
The selected material was a high-silicon cast iron containing mainly 3.10 wt.% C and 4.45 wt.% Si, as well as 0.0037 wt.% Sb for avoiding degeneracy of spheroidal graphite during casting. It has been spher oidized and cast in Y-shape blocks as described previously [19]. For cycling treatment, ten samples (20 x 10 x 2 mm3) were machined out
from tbe casting and a hole was drilled for hanging. They were tben polished witb a P1200 sand-paper, cleaned witb acetone and alcohol and finally measured (in size and weight). Two otber samples witb 23 x 15 x 6 mm3 in size were prepared from tbe same block and tben
polished and cleaned as tbe otbers. One of tbese latter samples, denoted as-cast in the following, wi.11 serve as a "reference" for microstrucrural studies. The second one was introduced in a Carbolite CWF 1300 re sistance furnace heated to 800 'C and held for 50 h before being air cooled. This sample will be denoted as "isotbermal".
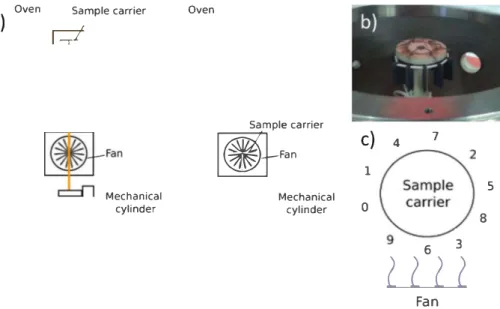
For tbermal cycling, a homemade facility was used which consists of a vertical resistance fumace and a samples carrier connected to a me chanical cylinder tbat moves the carrier from tbe lowest position in front of a fan to tbe highest position inside tbe furnace, and vice versa. The whole system, schematized in Fig. 1, is open to the air and com puter controlled. The 10 samples were fixed to tbe sample holder witb platinum wires and a tbermocouple was spot-welded on one of tbem and linked to a computer allowing for real-time recording of the sample temperarure.
The cycling procedure consisted in raising tbe samples inside the fumace and holding tbem inside until tbey spent approximately 60 s in tbe temperature range of 800 ± 10 'C. After tbis holding period, the sample holder was witbdrawn from tbe vertical fumace and moved in front of tbe fan to accelerate cooling. The samples were kept in tbis lower position outside of tbe fumace until they reached 100 "C (a tbermocouple was spot-welded on one of tbe samples and linked to a computer allowing to know when tbe temperature was reached), and were then raised again into the furnace for anotber cycle. The time slots required for heating and cooling were determined by preliminary tests. The process was repeated up to 3000 times, though interrupted every 200 cycles for weighing tbe samples so as to follow oxidation kinetics tbat will be presented elsewhere. Upon completion of 1000 cycles, tbree samples were taken out of tbe system and kept apart for analysis. This was repeated at 2000 cycles and after 3000 cycles tbe last three samples were witbdrawn. Thus, at tbe end of 3000 cycles, three samples had
undergone 1000 cycles, tbree more 2000 cycles and three otbers had completed 3000 tbermal cycles.
As three specimens were removed from tbe system after 1000 cycles and 2000 cycles, tbe holding time of the sample holder at tbe top po sition inside the furnace and at tbe bottom position in front of the fan were reduced in order to avoid temperature exceeding 810 'C upon heating. The resulting tbermal cycles and tbe histogram of cumulated durations spent in tbe rage 690 -810 °C after 3000 cycles are presented in Fig. 2. Note tbat the lime spent in the 800 'C + /- 10 'C range after 3000 cycles actually reaches 56 h, which is tbe same order of magni tude as the duration of isotbermal heat treatment.
2.2. Characterization methods
The five samples, i.e. tbe as-cast material, the isotbermal sample and one sample from each cycling time, were tben prepared for metallo graphic observations. A Secotom 50 Struers micro-chainsaw was used to make a vertical eut along each sample. They were then hot mounted and polished using SiC paper and diamond clotbs. The samples were finally cleaned in an ultrasonic batb in etbanol before observation. 2D microstructural analysis was performed using an optical Zeiss AXlO microscope and image analyses were carried out witb tbe lmageJ software. For the quantitative analysis, ten images were recorded in the central part of each sample tbat was observed to remain unaffected by decarburization and oxidation even after 3000 cycles. Witb tbis number of images, the total number of particles analyzed on each sample was in between 6800 and 8500. Note that particles witb size Jess tban or equal to 5 square pixels, i.e. less tban about 2.5 µm2 in area at tbe magnifi
cation which was used, were not analyzed.
The same five samples were furtber eut to prepare a chip to be used for XCT analysis witb a Phoenix/GE Nanotom 180 instrument from the French FERMAT FR3089 federation. These samples were polished to tbe shape of matches - 0.7 x 0.7 x 10 mm3 in size suitable for in
sertion in a 1 mm in diameter capillary used as sample holder for high resolution XCT. For XCT recording, tbe sample was located about 5 mm away from tbe source while tbe detector (Hamamatsu type C7942SK-05 with a resolution of 2300 x 2300 pixels) was positioned at 240 -250 mm from tbe X-ray source. 1440 steps were used for a complete sample rotation and 5 images were summed up every 0.25'. Each image was recorded for 1 s. Typically, in these conditions, each scan lasts for about two and a half hours. A high voltage of 90 kV was used for tbe X-ray beam to fully pass through tbe sample. An intensity value of 100-150 µA, depending on tbe final sample size after polishing, was used for maximizing the phases peak shift on tbe grayscale histogram to enhance phase contras!. A voxel size of 1 µm3 was tbus obtained. A few standard
corrections included in tbe datos/x reconstruction program were then applied to tbe reconstructed volume, namely ring artefact reduction, geometry calibration and beam hardening correction. VGStudio max 2.1 program from Volume Graphie GmbH based in Germany was used for XCT analysis. Witb one acquisition for each sample, tbe total number of particles analyzed per sample was in between 3900 and 6300.
For 3D analysis, tbe images were systematically segmented using an automatic threshold value that was determined after computing the phase separation between tbe iron based matrix and tbe dark graphite particles, considering 1 % reduction of tbe automatic tbreshold value (see Supplementary Information Sl for furtber details). Alike the case of Light microscopy, separation of graphite from porosity by XCT is not an easy task based on tbe similarity of tbeir X-ray absorption coefficients and tbis was not attempted but particles as small as tbe voxel size could be determined.
Amongst the many parameters that have been proposed for 2D characterization of spheroidal graphite [20,21] we selected tbe shape factor or circularity, C, and the equivalent diameter, D2n, which are
M.A. Pegoraro, et aL
a)
Oven
p
Sample carrier
Oven
�::"""
c)
4
7
1
Mechanical
cylinder
Mechanical
cylinder
0
5
8
6
3
è è è è
Fan
Fig. 1. a) Schematic of the vertical cyclic oxidation bench: samples carrier in the oven at the highest position Oeft) and in front of the fan at the lowest position (right); b) picture of the samples carrier at the lowest position; c) samples location on the samples carrier.
900 60 800 _50 700
:.
C: 600.g
40 -500 "C 30 1- 400 300 :j 20 200u ,o
100 0 690- 710- 730- 750- 770- 790-0 100 200 300 400 500 600 710 730 750 770 790 810 t (s) T ('C)Fig. 2. Thermal cycles measured between O and 1000 cycles (marked as 1), 1000 and 2000 cycles (2) and between 2000 and 3000 cycles (3) (left). Histogram of the cumulated time spent in the range 690-810 ·c after 3000 cycles taking into account the evolution of the thermal cycles (right).
C = 4.,,-. Sw pl
Dw = 4. 5w p
(1) (2)
in which S20 and P are the area and the perimeter of the section of the
particle.
Contrary to nodularity, which is defined to characterize a whole sample, circularity has the interest of being defined for each particle. Its drawback is that it includes at the sarne lime information on the shape and roundness of the particles. The equivalent quantity in 3D is sphericity, 'P, which is the most commonly used pararneter [11,13,14,16]. It is defined as:
1Jf = 71:113. (6V)'i'
S,v (3)
in which V and S30 are the volume and the outer area of a particle. Both
C and 'P would be equal to 1 for a perfect circle and sphere, respec tively. For comparison purpose, the equivalent diarneter of the particles resulting from the 3D image analysis, D3v, is defined as:
D,v = 6,_11_
S,v
3. Results and discussion
(4)
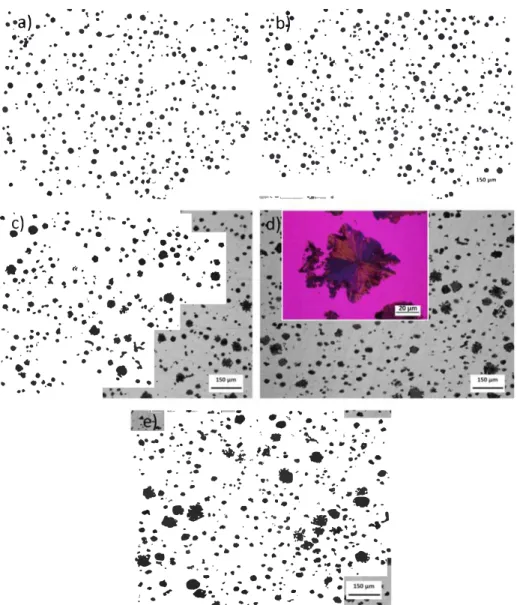
Fig. 3 presents a micrograph for each of the five samples. The as-cast microstructure (Fig. 3a) is typical of a slightly hyper-eutectic SGI with large spheroids that deposited first and small nodules formed during the eutectic reaction. The sample obtained after isothermal treatrnent (Fig. 3b) shows only some limited coalescence of the graphite pre cipitates, with large spheroids that are rather larger than in the as-cast state. After 1000 cycles (Fig. 3c), the microstructure shows marked coalescence but it is also noticed that the large spheroids present now
M.A. Pegoraro, et aL
. • - ·, =· .•
•
a)
•
•.: .• ·• •·
.
•
··
-
b
r
... --· •· •·•· •·•··
.. .
-
.
. . .
.
•. . . ..
.
.
.
.
.
. . •"
•.
_ ..
·
.... ·.
·'
•
.. ·.•..
.
,
• . • •.
.
.:-..
,. • :.-·. .
• !., •• • •.
.
..
••·.,
J-
.. • . -�: ,· . .. ·: •.•. �:. ·.:. •.·. . .. •. •.
.
� .... . •
.•
..
"
.
. .
. .
.
.
. . .·
.
.
...
.
�
..•
�
.
..
.
.
..
...
.. ...
'
.
.
. .
·•.• .•.. i./�,. ·•. •
.
. . . .
. •. •
.
.. .
.
...
,
.:
• ..•
.
,
•"
.•
...• ,
.
.. .
.
. ... .
.
. .
:
·
....
•.
-·
·••
.
.
.
.
..
.
;.
.
.
..
.
.
.
-.
';
.
.
.
.
.
.
.
:
.
• • •. •• •••• • - • •· ... \ "' •.. : . ,: ••. ' .... : ,.. . ·• 1'.
.
•.•
.
.
..
.. .
.
. ..
..
.. .
'•·
.
..
..
,..
...
..:
..
• : • •.·· .... ;·• •• ·.:.·.-.·.:.· ... : .·.-···:-•.• �.,.! -.�:. ��·--..:·· ••• :_· ,.!t·::::,:
: • ·:·
·
·
:
·
.
·-�-..
. ...
.
..
.
·. . -
: :-:
�
..
•.·•.,
·
...
·:. :
.:: •..
•
.·
:
..
•
...
• • • • ·• • ; .. • • • • • • . • ,J • • • • • • •• • • • •. .
..
..
•:"
.
-�.
.
.
�-
.
.• . .
. · .. :.
_..
,
'
.
.a·=· ...
.
..
:-
.
·
..
·
....
·.
.,,
. •:
-:
.
·
.
•·.
..
-
..
...
·
�
. ... .
..
. .
�
... ,
,
.
..
,
.
..
....
;
•.•
.
�
. .
.
·.
! • ... :.• •• ... . • ••
• e : •. • ·• • •• .�.,. .• • • • C ••. t 150.,im•
.
. .. •.' ,._.._,t·
-
�
--
-
-�
.
-··
.·)·
� •• ; ,: •• •.
.. ·
.·•
::._
.
••• ,,•r .•;
.
..
··
.
,
.
,
•
.
• ... •.
•-
.
..
• ·•:.
... .
.
.•.
.>·•
.
-�"�.
"·
. •·• .• ·' ' • ·. : I • •
.
.
• .,
...
-
·
•
.•
.
.
.
·
.
.
.
....
·•
•.
� •• :,,. .... " ••. ·
...
�-
• •·
.
.••• ...
< .. .
•• •, ·• : .... "•..
.
.
..
.
..
.
� • •• I.
:.
.
.
.
..
�
,••.
.
.
.
.
. .
,
·�
\.
. . . ,
. .
.. .
•...
.
.
..
.-
---
--
-
• .. c•• • ••
--
�
.
-
-
..,,
.
,.
• .. •
..
-�..
.
.
.
.
. .
.
...
-
·.
.
...
. .
.._..";.
,
.
'
�-
.
'•-�
.
..
·.:
.
.
.
..
-�
'
.
'·•
.-
..•
.
'"'
.
.
..
. • • .. . . •
·•
.
.ç.
,.
·
_,..
-
•
�
�
�
..'.
..
-�
: .
.
...
�-•.
..
.
.
-
.
.
·
--
.- .
.
c,..· . • • : �•:
·
:-
.
,
".
"
.,, . 4!· ·- ..
�;
.,.
•··
.. ... ...
�
·.
'�
�,, ..
•
-
,:
..
.
•
• •
·.-:
.i .,.,..
.
J
• •
..
.
.. ..•
·
:•
sll
.,
.
....
.
.
..
�
.
..
.
,:
..
�
,.
,,,
..
..
.
·
.
-:
... .. ..
,.
··-
'
.
....
.
.
.
•• &
•• "". -tt..
•.. _ . ..•
• •• • .
• • ... • ..• ••• • - .. •
- -· '"!' ' � a:.
:
.
-
. ..
.-
. .
..
;,
.
.
:·
.
.
�
•·
:.
...
. -,,.
.
..
-
..
·
..
·
-
.
Fig. 3. Micrographs of the as-cast (a) and isothermally held (b) samples, as well as of samples after 1000 (c), 2000 (d) and 3000 thermal cycles (e). Insert in (d) shows dendritic overgrowths imaged under polarized light.
an irregular outer shape. After 2000 and 3000 cycles (Fig. 3d and e) the large spheroids have grown further and are even more irregularly shaped. The insert in Fig. 3d illustrates that many of the protuberances that developed around the large graphite precipitates are dendrite-like after 2000 cycles. This suggested that the carbon dissolved in the matrix during the holding at the maximum temperature of the thermal cycles re-precipitated upon cooling in only a few locations, eventually leading to these dendrites after a high enough number of cycles [18]. The mi crograph in the insert of Fig. 3c was taken under polarized light which evidences that the dendritic protuberances were certainly twinned. Such a feature was observed on many of the protuberances of the 2000 sample and certainly explains the preferential growth along these de finite directions. More detailed investigation could possibly relate the initial formation of the twins with the internai structure of the original
spheroids.
Growth of the largest precipitates during coalescence is expected to lead to the disappearance of the smallest precipitates. This was not evidenced with the observation of the microstructures in Fig. 3. For checking this, the area fraction of graphite was measured on the 2D section of ail samples, giving the values (%) of 9.8(3), 11.0(1), 13.3(1), 15.1(2) and 16.3(3) for the as-cast, isothermal, 1000, 2000 and 3000 cycles samples, respectively, where the uncertainty on each last digit is given into brackets. Thus, this area fraction increases moderately with isothermal treatment but significantly with the number of cycles. This suggests that the coalescence process is accompanied by the formation of pores that cannot be distinguished from graphite with Light micro scopy as further discussed later. Therefore, graphite particles denoted as such in the following might also be porosities.
M.A. Pegoraro, et aL
Ref
70�---� lso 1000 cycles 2000 cycles 3000 cycles
60 50 Ê 40
-=
c"' 30 20 10 C(-) 10° C: 0� e
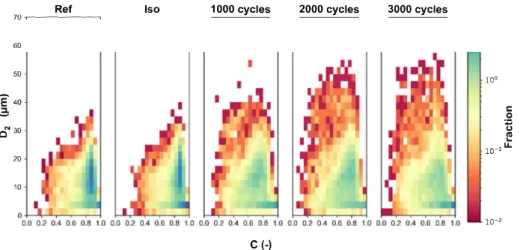
10-1 u.. 10-2Fig. 4. Plots of particle equivalent diameter D2n vs circularity C: comparison of as-cast sample (ReO with the sample isothermally heat-treated sample (Iso) and with
the samples cycled 1000, 2000 and 3000 limes.
•
4
Fig. 5. Optical micrographs of the isothermal sample (left) and after 3000 cycles (right).
To quantify the change in graphite shape, the circularity of the particles was plotted as a function of the particles equivalent diameter D20• Fig. 4 compares the plots for the as-cast (ReD, isothermally heat
treated (Iso) and thermally cycled materials with a color scale that in dicates the related number fraction. The plot for the as-cast material shows that most of the particles are quite round with a circularity higher than 0.7. Further, as expected from the observation of the mi crostructure in Fig. 3b, the distribution for the isothermally held sample shows very little difference with the as-cas! material. A high magnifi cation micrograph of this sample in Fig. Sa confirms that the contours of the graphite particles have remained smooth. After thermal cycling, the distributions are however significantly changed with the appear ance of irregular large graphite precipitates which are larger and larger as the number of cycles increases. If it is considered that these are the largest particles in the reference material that have grown under cy cling, i.e. those with D20 > 20 µm, then it is interesting to note that the
distribution of the remaining particles (green to blue in Fig. 4) does not change much. This is an indirect proof that small graphite particles that have been dissolved are replaced by pores keeping the size and shape of the original precipitates.
One feature of the graphs in Fig. 4 which is worth noticing is that the larges! particles have circularity spanning an extended range from 0.2 to 0.8 when a significant shift to small values with the number of cycles would have been expected from Fig. 3. This first suggests that protuberances do not develop ail around the large graphite particles but only in some definite directions. However, there is also a particular
feature of the growth process which is illustrated in Fig. Sb with a high magnification micrograph of a graphite precipitate after 3000 cycles. Il is seen that while protuberances are still growing, they tend to merge with neighboring ones by means of graphite arches. These arches finally give a more overall rounded appearance to the particles that may ex plain the large range of circularity values measured on images acquired at lower magnification.
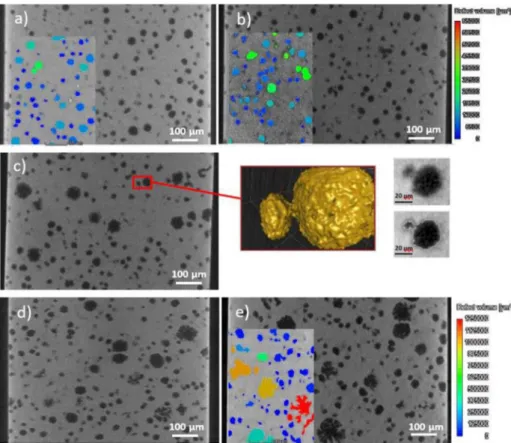
To complement the above 2D analysis, XCT was carried out on ail five samples as illustrated in Fig. 6 which shows a 2D image extracted from the 3D record for each sample. As already detailed from 2D Light optical micrographs, the graphite particles in the as-cast and isothermal samples are mostly round. On the contrary, large graphite particles increase in size and become more irregular with thermal cycling. This evolution is exemplified in the inserts in Fig. 6a, b and e, where par ticles have been sorted according to their volume, from blue for the smallest ones to red for the larges! ones. The particle in red in Fig. 6e is a clear example of how multiple protuberances in 2D are found inter connected when observed by XCT. Another example of interconnection is illustrated with the particle in yellow in Fig. 6c which further sug gests that growth of the large graphite particles may lead to the merging of neighboring particles.
Alike the case of Light microscopy, separation of graphite from porosity by XCT is hardly possible because of the similarity of their X ray absorption coefficients and was thus not attempted. Global mea surements were first considered, namely the fraction of particles and their number. Fig. 7 shows the 2D area fraction and the 3D volume
M.A. Pegoraro, et aL
Fig. 6. 2D views for the as-cast sarnple in (a), the isothermally heat-treated sarnple (b) and the sarnples after 1000 (c), 2000 (d) and 3000 thermal cycles (e). An example of 3D interconnectivity is also materialized with a selected particle in (c). Renderings extracted from the 3D data are given for three of the samples, as illustrations. 18 �---� 16 10
■,
,.
.
3000 cycles'
'
',,,
--....
�
::--..
,
-
-•-..
,
..
2000 --� ---cycles ,, ...',
.
'
.... ..,.
',,
...
\
..
1000',. cycles \ 1-.
·
,
•
..
.
lsothermal'f As cast 20 30 8+---�--�--�--�--�---�---< 6.3 6.4 6.5 6.6 6.7 6.8 Density (g. cm -3) 6.9 7.0Fig. 7. Relation between 2D area and 3D volume fractions of graphite and the corresponding experimental density values for the reference and isothermal
sarnples, and after 1000, 2000 and 3000 thermal cycles.
fraction of partides versus the density of the reference and cyded materials as measured on the XCT samples. There is a dose relation between the density decrease and the increase in the area and volume fractions of partides. A simple mass balance demonstrates that the change in density corresponds perfectly to the change in the fraction of partides assuming that pores are formed at constant graphite fraction, see supplementary material S2. Concerning the evolution of the number of partides, it was noted that the 2D data did not show a smooth evolution as this was the case of the 3D counts. 3D counts are certainly much more significant and demonstrate an average of 10 % decrease of the number of partides every 1000 cycles .
To get some more detailed insight of the evolution of the partides, their distribution was obtained by sorting them with respect to their volume. The analysis was performed in a region of ~ 0.5*0.5*0.5 mm3
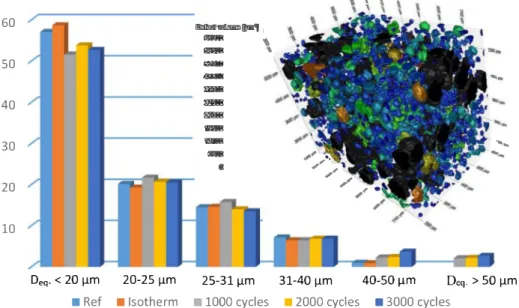
for each sample. 3D renderings are shown in supplementary material S3 while Fig. 8 presents the normalized size distributions. The upper limits of the first five classes used in Fig. 8 would correspond to an equivalent diameter Deq of ~ 20, 25, 31, 40 and 50 µm, respectively, if inclusions
were spherical. It is impressive that the distributions are ail quite si milar. The only effect of coalescence because of cyding seen on this figure is a slight decrease of the relative number of partides in the smallest dass and a corresponding increase in the two largest classes. Based on these observations, it seems that the largest partides engulf the smallest partides during cyding.
The actual possibility of such swallowing process is illustrated in
M.A. Pegoraro, et aL
60
--llilm!
,
\'
-
...
-
�
50
-
-
-40
ffli!8sae
-30
-
-•
20
10
�,
.
� ,·
.,
,
.,
., ,,
,
.
,,
..
_
...
..
...
..
D
eq• < 20 µm
20-25 µm
25-31 µm
31-40 µm
40-50 µm
D
eq. > 50 µm
■
Ref
■
lsotherm
■
1000 cycles
■
2000 cycles
■
3000 cycles
Fig. 8. Normalized count distribution of particles according to their volume V (or their equivalent diameter Deq. such as V = 4:rr:/3(Deq./2)3 when considering a
sphere): V < 4000 µm3 (Deq· < 20 µm), 4000 < V < 8000 µm3 (20 < Deq· < 25 µm), 8000 < V < 16,000 µm3 (25 < Deq· < 31 µm), 16,000 < V < 32,000 µm3
(31 < Deq- < 40 µm), 32,000 < V < 65,000 µm3 ( 40 < Deq- < 50 µm), and V > 65,000 µm3 (Deq > 50 µm). A 3D volume image obtained by XCT on a sample region
of interest of 0.6*0.44*0.45 mm3 after 3000 cycles is showing all different colored inclusion volumes (for instance, those bigger than 65,000 µm3 (D
eq• > 50 µm) in black). J
�
••
<J<:>
,G.
"OC'.J
.o o
·
Q
0 • • '..
6 .• •
..
.
.
Fig. 9. Superimposition of a portion of the rn.icrograph of Fig. 3a and of the particles contours of a portion of the micrograph of Fig. 3e.
and e. It is clearly seen that some of the graphite particles have become so large that their extension may encompass several of the initial pre cipitates. While the insert in Fig. 3c clearly showed that the protuber ances grow along directions which are defined at their basis, it is quite evident that the carbon flux from neighboring graphite particles will
sustain a preferential growth of the protuberances towards them. This will support the merging mechanism and affects the irregularity of the shape of the growing graphite particles.
When comparing the circularity variations obtained from 2D me tallographic observations with the sphericity variations based on XCT analysis, similar trends corne out. Circularity evolves significantly during cycling with a dramatic decrease in particular for large particles. While more than 75 % of the graphite particles in the as-cast SGI are circular (circularity higher than 0.77), only about 40 % remain circular after thermal cycling whatever the number of cycles is (1000, 2000 or 3000 cycles). For the normalized distribution of sphericity, while a wider proportion of particles are a bit distorted from an ideal sphere in the as-cast state ( -70 % of particles are in the 0.6-0.7 sphericity re gion) there is a strong Joss of spherical shape upon thermal cycling associated with the growth of dendritic protuberances and a particle size increase (see also S4 and SS).
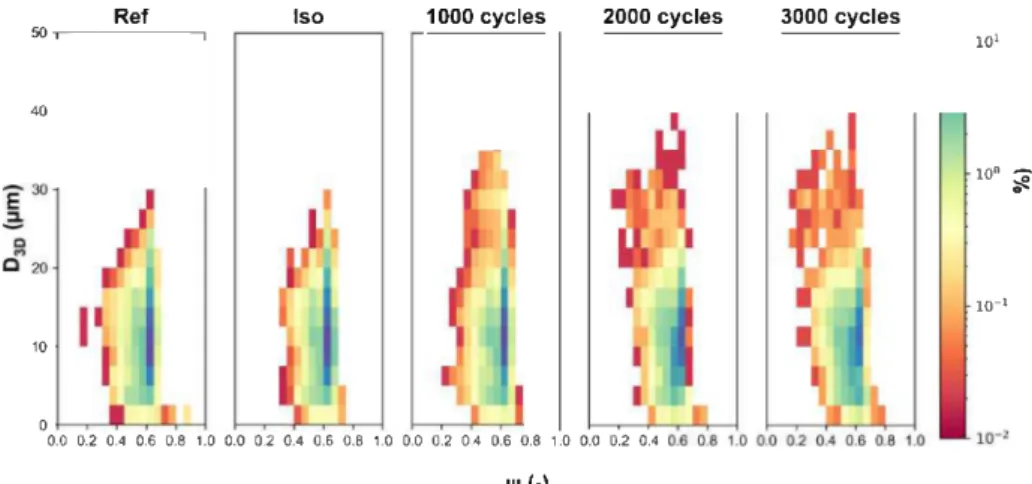
In order to stress the irregular shape of the particles, Fig. 10 shows the correlation between sphericity '-V and particle equivalent diameter D30 in the as-cast state, after isothermal holding and after 1000, 2000
and 3000 cycles. A,J was done in Fig. 4, the color code shows the nor malized number fraction of precipitates. The reference and isothermal samples show again very similar distributions with sphericity ranging from 0.3 to 0.65. With cycling, this range extends slightly towards lower values, but the most significant change is the increase in size of the large particles and particularly those with lower sphericity. As for
Fig. 4, it seems that the dense part of the distributions (colors green to blue) remains unchanged, being the same after cycling as in the as-cast sample. This suggests again that this part of the distribution cornes from the small graphite particles that have dissolved during thermal cycling and gave pores.
One further thing should be mentioned regarding Fig. 10 which is that the maximum values of D30 are about 35 - 40 µm when the max imum values of D20 in Fig. 4 and those of the Deq values in Fig. 8 were over 50 µm. This is due to the definition of the D30 (Eq. 4) and shows
M.A. Pegoraro, et aL
Ref
50 .---, lso 1000 cycles 2000 cycles 3000 cycles 101
40 10°
�
.
10-1 10 O 0.0 0.2 0.4 0.6 0.8 1.0 0.0 0.2 0.4 0.6 0.8 ,.o 0.0 0.2 0.4 0.6 0.8 1 .0 0.0 0.2 0.441 ( ·)
Fig. 10. Plots of sphericity 1.p versus particle equivalent diameter D3D: comparison of as-cast sarnple (Ref) with the sarnple isothennally heat-treated sample (Iso) and
the samples cycled 1000, 2000 and 3000 times.
,�
4105 0,,,�
3105 21055l
1 105 20 40 60 80 100 120 140 160 Equivalent diamter D., (µm)Fig. Il. Variation of the outer surface of the particles S30 with the corre
sponding Deq values for the reference and the three cycled samples. The dotted
line represents the change of the surface of a perfect sphere. Examples of 3D and 2D images obtained by XCT. Scale bar is 20 µm for ail 2D renderings.
that the S30 values are much larger than for spheres of the same vo
lume. In other words, the irregularity of the 3D outer shape of the large particles is much more pronounced than could be visualized with 2D images. This is evidenced by plotting the S30 values as a function of the
Deq values for the reference sample and the three different cycled
samples (Fig. 11). In this graph, thousands of points are superimposed at Deq values Jess than 40 µm and are located close to the dotted line
that represents the area Seq of perfect spheres. At higher values of Deq,
the outer area of the graphite particles increases and dramatically di verges from the Seq value. It is interesting to note that data for ail three
cycled samples strictly follow the same curve which is an evidence for a continuous coupled process of growth and coarsening ail along the 3000 cycles. This process is illustrated with the 3D views of isolated particles and a 2D section extracted from the XCT data. One may note that the dendritic protuberances illustrated with Fig. 3 are smoothed due to the fact that XCT resolution is slightly lower than that of optical microscopy. Also, the merging of growing graphite particles with neighboring particles can be easily imagined with the largest particles shown in Fig. 11.
Finally, metallography analysis providing highly resolved images of particles but limited to a planar view, and XCT data showed that some particles can actually expand over a more complex shape in heat cycled cast iron materials. Isolated particles of particular dimensions can vary
depending on the shape they adopt after long thermal cycling, due to particle growths and/or aggregation phenomena. XCT technique was able to give a large distribution of graphite nodules in the cast volume and evidence for the complex (trans-)formation of inter-connected graphite nodules that will directly influence the mechanical properties of a material.
4. Conclusion
Heat treatment and harsh conditions can strongly influence the physical properties of materials. Visualizing sample cuts or full inner volumes and systematically analyzing their microstructural behavior by 2D microscopy and 2D/3D tomography are essential in better under standing and controlling their mechanical features, for instance.
Thermal cycling of a high-silicon cast iron leads to a marked coa lescence of graphite particles in contrast with equivalent isothermal treatment. This coalescence is accompanied by a morphological in stability of the largest particles that is characterized by the develop ment of dendrite-like protuberances. Optical 2D analysis gave highly resolute sectional images down to a sub-micrometer scale of the ma terials and the 3D-XCT method was particularly useful to obtain a large number of sample layers in a non-destructive manner and to provide detailed particle sizes, connections and shape distributions over the whole volume of analysis. Hence, 2D and 3D analyses showed that, while an equivalent isothermal treatment keeps the initial shape of particles, more than a half of them Jose their circularity and sphericity after 3000 thermal cycles. Volume analysis shows that some graphite nodules can then be three times bigger than at the beginning ( - 40 µm
in diameter for the primary widest spheres) and the largest particles Jose their initial spherical shape to evolve into larger and more complex precipitates. 2D and 3D images show spectacular coalescence asso ciated with impressive dendritic instabilities over large graphite no dules. This detailed microstructural study evidences the unique trans formation of large graphite nodules into overgrown particles that exhibit dendritic features. This microstructure instability is expected to appear for thermal cycles with peak temperature above 700 °C. Such a microstructure evolution must be associated with a dramatic decrease of the mechanical properties of high-silicon cast irons which may ex plain why these alloys are not used above 700 - 720 °C.
M.A. Pegoraro, et aL
Declaration of Competing Interest
The authors declare that they have no known competing financial interests or persona! relationships that could have appeared to influ ence the work reported in this paper.
Acknowledgments
Azterlan (Bizkaia) kindly provided the material used in this study. Appendix A. Supplementary data
Supplementary material related to this article can be found, in the online version, at doi:https://doi.org/10.1016/j.mtcomm.2020. 101422.
References
[1] W. Fairhurst, K. R0hrig, High-silicon nodular irons, Foundry Trade J. 146 (1979) 657-681.
[2] L. Delin, R. Logan, G. Burger, G. Liao, D. McFarlan, B. Black, R. Williams, High Silicon Cast Iron with Mixed Graphite (MG) Shapes for Elevated Temperature Applications, SAE technical paper 2007-01-12.
[3] Classification and basic types of c.ast iron, ASM Handbook Vol. lA Cast Iron Science and Technology, ASM Int., 2017, pp. 12-27.
[4] M. Garn.y, Cast iron: compacted graphite, Encyclopedia of Iron, Steel and Their Alloys, (2015), pp. 718--734.
[5] J. Lacaze, D. Connetable, M. Castro Roman, Effects of impurities on graphite shape during solidification of spheroidal graphite cast ions, Materialia 8 (2019) 100471,
https:/ /doi.org/10.1016/j,mtla,2019,100471,
[6] B. Lux, M. Grages, The spatial structure of graphite in pure Fe-C-Si alloys, Pract. Metall, 5 (1968) 123-126,
[7] D. Stefanescu, L. Dinescu, S. Cracium, M. Popescu, Production of vermicular gra phite cast-irons by operative control and correction of graphite shape, Translation from the Proceedings of the 1979 World Foundry Congress Appeared in Fonderie
397 (1980) 117-120,
[8] A. Velichko, C. Holzapfel, F. Müklich, 3D characterization of graphite morphologies in cast iron, Adv. Eng. Mater. 9 (2007) 39-45.
[9] K. Salomonsson, A.E.W. Jarfors, Trans. Tech. Pub., Zurich, A. Di6szegi, V.L. Diaconu, A.E.W. Jarfors (Eds.), Three-dimensional microsnuctural character ization of cast iron alloys for numerical analyses, 925 2018, pp. 427-435. [10] C. Chuang, D. Singh, P. Kenesei, J. Aimer, J. Hryn, R. Huff, 3D quantitative analysis
of graphite morphology in high strength cast iron by high-energy X-ray tomo graphy, Scripta Mater. 106 (2015) 5-8.
[11] C. Chuang, D. Singh, P. Kenesei, J. Alnler, J. Hryn, R. Huff, Application of X-ray computed tomography for the characterization of graphite morphology in compact graphite cast iron, J. Miner. Mater. Charact. Eng. 141 (2018) 442--449. [12] K. Yamane, H. Yasuda, et al., Influence of Mg on solidification of hypereutectic cast
iron: X-ray radiography srudy, Metall. Mater. Trans. 46A (2015) 4937--4946. [13] M.K. Bjerre, In Situ Observations of Graphite Formation During Solidification of
Cast Iron, PhD Thesis DTU mechanical engineering, 2017.
[14] M.A. Azeem, M.K. Bjerre, R.C. Atwood, N. Tiedje, P.D. Lee, Synchrotron quantifi cation of graphite nodule evolution during the solidification of cast iron, Acta Mater. 155 (2018) 393--401.
[15] B. Mrzyglod, P. Matusiewicz, A. Tchorz, I. Olejarczyk-Wozenska, Quantitative analysis of ductile iron microstructure - a comparison of selected methods for as sessment, Arch. Foundry Eng. 13 (2013) 59-63.
[16] S. Lekakh, X. Zhang, et al., 3D characterization of snucture and micro-porosity in two cast irons with spheroidal graphite, J. Miner. Mater. Charact. Eng. (2019). [17] Yajun Yin, Zhixin Tu, et al., 3D quantitative analysis of graphite morphology in
ductile cast iron by X-ray microtomography, Metall. Mater. Trans. 48A (2017) 3794-3803,
[18] A. Ebel, M. Alves Pegoraro, B. Malard, C. Tenailleau, J. Lacaze, Coarsening and dendritic instability of spheroidal graphite in high silicon cast iron under thermal cycling in the ferritic domain, Scripta mater. 178 (2020) 86-89, https://doi.org/10. 1016/j.scriptamat.2019.11.001.
[19] R. Gonzâlez-Martinez, U. de la Torre, J. Lacaze, J. Sertucha, Effects of high silicon contents on graphite morphology and room temperature mechanical properties of as-cast ferritic ductile cast irons. Part I - microsnucture, Mater. Sei. Eng. A 712 (2018) 794-802,
[20] Jianming Li, Man On Lai, Quantitative analysis of the irregularity of graphite no dules in cast iron, J. Miner. Mater. Charact. Eng. 45 (2000) 83-88. [21] B.I. Imasogie, U. Wendt, Characterization of graphite particle shape in spheroidal
graphite iron using a computer-based image analyser, J. Miner. Mater. Charac. Eng. 3 (2004) 1-12,