HAL Id: hal-01982749
https://hal.inria.fr/hal-01982749
Submitted on 15 Jan 2019
HAL is a multi-disciplinary open access
archive for the deposit and dissemination of
sci-entific research documents, whether they are
pub-lished or not. The documents may come from
teaching and research institutions in France or
abroad, or from public or private research centers.
L’archive ouverte pluridisciplinaire HAL, est
destinée au dépôt et à la diffusion de documents
scientifiques de niveau recherche, publiés ou non,
émanant des établissements d’enseignement et de
recherche français ou étrangers, des laboratoires
publics ou privés.
ACQUA: A user friendly platform for lightweight
network monitoring and QoE forecasting
Othmane Belmoukadam, Thierry Spetebroot, Chadi Barakat
To cite this version:
Othmane Belmoukadam, Thierry Spetebroot, Chadi Barakat.
ACQUA: A user friendly
plat-form for lightweight network monitoring and QoE forecasting.
QoEManagement 2019
-3rd International Workshop on Quality of Experience Management, Feb 2019, Paris, France.
�10.1109/ICIN.2019.8685878�. �hal-01982749�
ACQUA: A user friendly platform for lightweight
network monitoring and QoE forecasting
Othmane Belmoukadam
∗, Thierry Spetebroot
∗, Chadi Barakat
∗∗Universit´e Cˆote d’Azur, Inria, France
Email: {FirstName.LastName}@inria.fr
Abstract—ACQUA, Application for prediCting QUality of Experience at Internet Access, is an Android application to measure mobile network access performance and to estimate how this performance affects main applications of interest to the end user from Quality of Experience (QoE) viewpoint. Every application supported in ACQUA is a function, or a model, built offline, that links the network-level and device-level measurements to expected Quality of Experience. Supervised machine learning techniques are used to establish such link. Thanks to a lightweight measurement strategy, ACQUA can perform measurements continuously and show to the user, in addition to QoE estimations, measurement results obtained both actively and passively. This way we we can provide insights over time on network performance as well as user-friendly QoE values that explain the state of the network. Finally, ACQUA provides a feedback channel for end users to express themselves about their real QoE, a feedback that we plan to use to assess the importance of the subjectivity of QoE in real life scenarios.
I. INTRODUCTION
Monitoring mobile networks, mainly cellular ones, has been the subject of a lot of research and a variety of tools in the recent period. Available tools cover a large spectrum of aspects such as network performance related issues (e.g., Speedtest [1] and MobiPerf [2]) and middlebox related issues (e.g., Netalyzr [3]). These tools shed light on important aspects of modern mobile networks and the way they perform and are administrated. Yet, these tools still focus on the network itself and deliver few information to the end user regarding his/her Quality of Experience (QoE) as perceived, or going to be perceived, when using the mobile network services and applications. By definition, QoE is a subjective measure determined by several subjective and objective factors. It models the user perception of the service delivered by the network for a specific application or as a whole. In this work, we are mainly concerned by the impact of the network access performance on the QoE (often expressed on a scale from 1 to 5, called Mean Opinion Score or MOS in brief).
The literature is rich with research-driven measurement tools specialized in some aspects of Quality of Experience such as YoMoApp for YouTube [4] and QoE Doctor [5] for device performance issues and their impact on the QoE. However, there is still a need for a general lightweight tool providing forecasts of end user Quality of Experience at the
This work is supported by the French National Research Agency under grant BottleNet no. ANR-15-CE25-0013, by Inria ADT ACQUA and Project Lab BetterNet. Regarding ethical issues, the work is validated by Inria review committee (COERLE) and by the French data protection authority (CNIL).
application level, together with periodic and extensive mea-surements of network access performance. On one side, this tool would help end users better understand the performance they are getting from their network access and how it relates to their expected QoE. On the other side, it would allow network operators and content providers to troubleshoot access network performance issues, and better design their systems so that Quality of Experience of their customers is optimized.
For this aim, we developed ACQUA, an android application based on network and device level measurements. ACQUA deploys machine learning models built offline in a controlled network environment, to map measured network Quality of Service (QoS) to estimated Quality of Experience for different applications of interest to the user. ACQUA is meant to be a cross-application QoE estimation tool. It is mainly concerned with access performance issues and implements techniques to measure this performance and interpret it in terms of QoE, thanks to models calibrated offline. The performance of the access is supposed to be measured towards servers that we deploy close to the end user to capture the access and only the access independently of any network core issues. Currently, and for the sake of proving the concept, we deploy these servers in our laboratory and make sure they are well connected to the well dimensioned French academic backbone network Renater. With this approach, we aim at making network measurements reused by different QoE models and allowing ACQUA to provide estimations of the QoE without running the applications themselves, hence reducing the over-head on the mobile. The way we build these models and their accuracy have been discussed in two of our recent papers for two popular applications, Skype [6] and YouTube [7].
ACQUA is meant to be lightweight and able to perform periodic measurements at a granularity up to one measurement session per minute (Sec. III). With existing tools, this is almost impossible given the data consumption implicated. ACQUA implements UDP active measurement techniques to probe the network faster and with fewer packets and is thus able to capture network performance (e.g., delay, bandwidth and loss rate) with tens of Kbytes per measurement session, without compromising measurement accuracy. To the best of our knowledge, ACQUA is the only tool able to perform periodic fine grained measurements of mobile access performance along with estimation of QoE for daily used applications.
As said above, the models of QoE in ACQUA are built offline with the help of controlled experimentation [6] [7]. The
network conditions are artificially tuned using network emula-tion tools, applicaemula-tions are played out, and the corresponding QoE is written down. Supervised Machine Learning is used to build models relating QoE to network performance. These models are then pushed into the mobiles via the ACQUA application. It is clear that QoE annotation is an important step in our approach. For this, we follow an expert model approach which consists in reusing existing models in the literature or in the standards to produce the QoE annotation. To be noted here that our models differ from existing models by the fact that ours (only) consider a rich set of network performance metrics as inputs (i.e., no application level QoS), and so they overpass the details of the transport and the application layer. Now, to assess how real perceived Quality of Experience differs from our estimation, and also to validate how well existing models for QoE annotation perform in real life scenarios, we solicit the end user in ACQUA for her/his real Quality of Experience. We also collect in parallel network and device level measurements performed at the moment of the feedback. We plan to use this crowdsourced data to understand the subjectivity of the QoE in real life scenarios and to evaluate the exact impact of the network performance on it.
In this paper, we describe our tool ACQUA and the key ideas behind it. We first go via the state of the art and briefly overview the related work to ACQUA. In the section that follows, we explain our platform and dig into some technical issues we faced during the development of ACQUA, and then present validation results for the network active measurement techniques deployed by our tool. Later, and as a first step towards using ACQUA data for QoE troubleshooting, we present descriptive and inferential statistics and point to passive metrics collected inside the mobile that might be related to QoE degradation. Before concluding, we present some limitations of our platform and our plans for future work.
II. RELATEDWORK
In this section, we summarize the related work to ACQUA on the two aspects of QoE modeling and mobile sensing. A. QoE modeling
When addressing Quality of Experience, modern standards (e.g., ITU) focus on protocols or general class of applications and not on specific Internet services. Among these, most target application level metrics, such as the number of interruptions or the number of bitrate switches during a video playback [8], [9] or the signal degradation within VoIP services [10]. For what concerns the network aspects and how they affect the user Quality of Experience, standards give general recommen-dations (e.g., consider only one parameter or define minimum thresholds to have service). While being suitable for predicting users’ QoE, those expert models developed in the standards are too generic when addressing network inputs or too specific when addressing application-level QoS metrics (i.e., inputs cannot be reused for different services).
On the research side, different approaches exist that target specific services or aspects of QoE. Among them, QoE
Doc-tor [5] addresses device performance issues and their impact on the QoE, while Hoßfeld et al. studies how Youtube QoE is affected by application level measurements [11]. YoMoApp [4], a video streaming crowdsourcing application, targets the collection of Youtube’s QoS metrics and users’ feedback.
Popular mobile applications do not embed Quality of Ex-perience feedback related to the network conditions, with the exception of some applications from major service providers (e.g., Facebook Messenger, Skype, Viber) where a meter is provided while using the application (i.e., no prediction of QoE). Only Meteor [12] matches our goal of linking network measurements to multiple service QoE, while RTR-NetTest [13] provides user-friendly meters per each network QoS metric. These tools are still either greedy at the network measurement level or approximate in terms of QoE estimation.
TABLE I
COMPARISON OF NETWORK SENSING TOOLS
Mobile Light QoE
Speedtest 3 7 7 MobiPerf 3 7 7 Sensorly 3 7 7 RTR-NetTest 3 7 ∼ Meteor 3 7 3 iPerf 7 ∼ 7 ACQUA 3 3 3 B. Network sensing
Measuring cellular networks from a crowdsourcing per-spective is subject to several constraints. Since this approach relies on users’ smartphones, we must take into account the limitations of the mobile OS, the battery consumption and not to over-use the mobile data plane while performing measurements. Generally, popular applications in this domain, e.g., [1], [12], [14], [13], [2], use a similar methodology to estimate the network conditions: ICMP ping for delay and loss measurements and TCP-based downloads/uploads for bandwidth measurements. While being very effective and precise, these techniques, especially the TCP based one, con-sume tens of megabytes per measurement session. Thus, these applications usually leave to the user the task of triggering manually each measurement and so, do not propose a periodic measurement plane. Among all the approaches we found in the state of the art, only Sensorly [14] seems to be fully tailored for continuous mobile network sensing by allowing users to perform network measurements in the background. While being adapted to this use case, Sensorly uses TCP based speed tests to estimate the bandwidth and therefore consumes a considerable amount of data when not in passive mode.
While not being officially supported on mobile devices, iPerf [15] can be used on smartphones via third party ap-plications (e.g., [16]). Being aimed for a technical audience, iPerf allows to perform several types of measurements. The
possibility to run UDP-based measurements is of particular interest since UDP-based measurements are lighter than TCP-based ones. Still, the UDP-TCP-based measurements in iPerf cannot be as light as the ones we propose in ACQUA because of the additional signaling overhead (more details in Sec. IV).
As a conclusion, and as stated in Table I, we can see that existing mobile applications specialized in network monitoring do not generally offer QoE insights but rather technical ones (i.e., network QoS metrics). Moreover, none are suited to perform frequent measurements and track connection quality over time without heavily affecting the user’s data budget.
III. PLATFORM
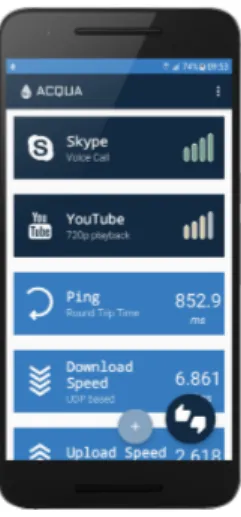
ACQUA is a user-centric platform whose main part is a mobile application (currently available for Android devices directly on Google Play Store [17] or via the project website project.inria.fr/acqua/) that senses the network and provide an estimated QoE together with statistics on network access performance. The User Interface of ACQUA (see Fig. 1) is meant to be user-friendly; it is adapted to general users not familiar with the network domain, but also to expert ones. This is achieved by presenting the Quality of Experience of popular applications (dark blue tabs), as meters that summarize the network conditions. Other light blue tabs show statistics on network Quality of Service, i.e., the output of our measurement system (more details in Sec. III-A); these latter tabs target an audience familiar with network technology.
Fig. 1. Main interface of ACQUA (Android application)
Meters estimating Quality of Experience are presented in bars, similarly to cellular signal strength indicator. The objec-tive is to make them understandable by a large audience. QoE values are defined by the expert models we use and correspond to Mean Opinion Score (MOS) values ranging from 1 to 5 (plus ”?” when undefined). One can interpret them as:
1) (worst) No connection, the application should not work; 2) Barely usable, unreliable behavior;
3) Major issues, e.g., long delays; 4) Minor issues, e.g., tolerable delays;
5) (best) Normal behavior, the application should work as expected.
We also provide a feedback form where the end user can submit her/his feedback following the same definition of QoE. We plan to use this feedback to test and improve our models by confronting them to real life scenarios.
A. Sensing the network
ACQUA measures the network periodically with a fre-quency that can go up to one session per minute. In each session, we collect both passive and active measurements. The active measurement module, developed as a standalone expendable Java module, consists of two measurement tasks:
• ICMP ping, that allows to estimate:
– RTT, Round Trip Time (identified in the UI as ping); – Download / Upload loss rate, percentage of packet
losses;
– Download / Upload jitter, variability of the delay. • UDP burst, that allows to estimate:
– Download / Upload UDP throughput.
Both tasks perform end-to-end measurements towards our edge servers. As said before, our long term objective is to deploy those servers (i.e., landmarks) close to the users so as to capture the access performance in a faithful way. For now, and during the proof of concept phase of ACQUA, we deploy them in our laboratory and make sure they are well dimensioned and well connected to the Internet. On the measurement overhead side, excluding IP, ICMP and UDP headers, the ping task consumes 400 bytes (i.e., 100 probes of 4 bytes each) and the burst task consumes 70 Kbytes (i.e., 5 separate traces of 10 probes of 1400 bytes each). While a single burst trace could be used, we send multiple ones per session to smooth the results of our measurements and reduce the bias effect. The overall data consumption per session is therefore no more than 71 Kbytes, far less than what TCP based tools consume.
At the end of the active measurements phase, passive measurements and other meta-data are collected using the Android API. We make sure not to compromise the privacy of end users by not collecting sensitive information as the IP address and the GPS position. Table II summarizes data collected out of one measurement session:
Active Measurements Passive Measurements RTT User ID
Download loss rate Signal strength Upload loss rate Mobile Operator Download jitter Radio technology Upload jitter Network cell (CID,LAC) Download throughput WIFI (SSID)
Upload throughput Roaming status TABLE II
DATA COLLECTED OUT OF MEASUREMENT SESSION
B. From network performance to QoE
The advantage of using Quality of Experience as a KPI is twofold. First, it allows to summarize the network conditions as a single meter. Second, this meter is easy to understand by even non specialized audience. Instead of targeting a single
application and its characteristics as input, we focus only on the network state as input (i.e., delay, throughput, jitter and loss rate). Our general framework can thus be reused for any number of applications (or application’s specific features, e.g., different video streaming qualities). So far ACQUA has two QoE models that we briefly describe next. The preparation of other models for other applications is ongoing.
1) YouTube video streaming: ACQUA uses a model in the form of a decision tree, calibrated offline with controlled experiments, to link network level measurements (e.g., delay, throughput and loss rate) to a QoE level defined as a function of the application level metrics of overall stalling time and initial join time. Indeed, YouTube QoE is known to decrease fast with the join time and the duration of stalls. Explicit functions exist in the literature to capture this dependence, further details in [7]. We stream thousands of videos in variable network conditions, then for each streaming session, we measure the join time and the duration of stalls, which together give us an estimation of the QoE for this session on a scale from 1 to 5. Later, Supervised Machine Learning is used to build the decision tree that links the network conditions to the QoE level, thus yielding the model used in ACQUA.
2) Skype voice call: We collect data from a controlled environment where Skype calls are initiated through a prepared gateway. Network conditions are artificially changed and their impact on the quality of the call is noted based on the Skype QoE meter embedded in the Skype application (which models in somehow the average feedback of the Skype users for the same network conditions as estimated by Skype). We then use the resulting dataset to train a QoE model in the form of decision tree and we embed it in ACQUA [6].
C. Power consumption and other features
Battery consumption of ACQUA has also been investigated. We ran ACQUA with default and greediest configuration (one measurement session per minute) on fully charged devices (different brands) for different time periods (e.g., 12 and 24 hours). Android feedback on battery consumption by ACQUA recorded less than 7% and 15% for 12 and 24 hours usage respectively. This consumption seems reasonable given the high frequency of measurements, and can be clearly reduced by increasing the inter measurement session period. We aim at lowering battery consumption in future releases by using new Android tools such as work manager and job schedulers. In terms of other features of the project, ACQUA also presents time series and personalized statistics to the end user. These can be accessed through tabs and stats menu. Moreover, ACQUA has a public web interface with updated maps compiled by aggregating users’ data. With no GPS info on ACQUA, we used a crowdsourced dataset1 to get the approximate position of each network cell.
IV. ACQUAMEASUREMENTS VALIDATION
In this section, we focus on the validation of our UDP based bandwidth measurement method. In particular, we compare it
1http://cellidfinder.com
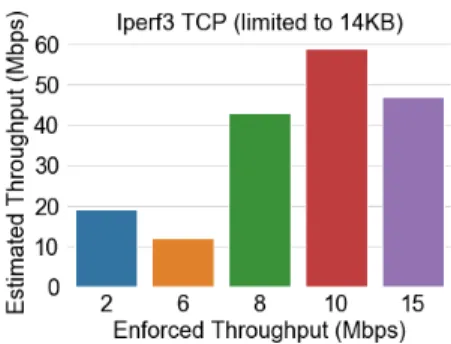
to the reference tool iPerf3 [15]. Indeed, ACQUA uses UDP instead of TCP to estimate network available capacity. This choice is made to ensure continuous network sensing with low data consumption. In fact, TCP measurements require long traffic traces to derive accurate bandwidth measurements, otherwise with small traces (i.e., few Kilobytes as targeted in ACQUA), they tend to provide noisy estimates mainly because of the slow start phase, the closed loop of TCP, and the buffering at the receiver. To further study how TCP handles small sized traces, we performed a test with iPerf3 in TCP mode while fixing the size of the trace to 14KB (i.e., same as used in ACQUA for one train of UDP packets) and we artificially changed the network capacity. In Fig. 2, we can observe how TCP overestimates the network capacity when set to consume as ACQUA. We believe this happens when a consistent part of the stream gets buffered by the receiver and delivered as one large block to the application.
Fig. 2. iPerf3 (TCP mode, limited to 14KB, single stream)
Next, we compare our measurement method with a similar concept from iPerf3 based on UDP. While ACQUA being able to track the enforced bandwidth, Fig. 3 shows that iPerf3 tends to underestimate available bandwidth when using same burst size. This is mainly caused by the initialization delay in iPerf3 between the start of the session and the first probe sent, which biases the results of measurements based on small traces. Another interesting point to note is that iPerf3 is not designed to work with very small UDP traces too; it is not possible to reliably send the exact amount of data requested since the receiver notifies the sender when to interrupt the burst (i.e., when all the requested probes have been received). During this notification time probes will be sent by the sender and therefore will exceed the expected budget. Given those results, it is clear that, while not being technically novel in the field of network measurements in general, using UDP in ACQUA (i.e., small traces) is a solid and relevant way for continuous mobile measurements with low data consumption.
V. QOETROUBLESHOOTING WITHACQUA In this section, we present first results using the ACQUA dataset (1 million records starting September 20172) for the sake of network and QoE troubleshooting. We use descriptive 2One month dataset regularly updated made available at
Fig. 3. ACQUA vs iPerf3 (UDP mode, limited to 14KB, single stream)
and inferential statistics to understand the occurrence of bad estimated QoE and point to local factors causing such phe-nomena. While only introducing first troubleshooting results, the ultimate goal is explained in Sec. VII. Further details on this initial study can be found in [18].
For space constraints, we only show results related to the estimated QoE of YouTube streaming. Without losing generality, we transform the QoE multi-class problem (ranked 1 to 5) into a binary problem easy to handle:
• Classes from 1 to 3 represent the Bad QoE class (0). • Classes 4 and 5 represent the Good QoE class (1).
A. Radio Access Technology
Fig. 4 illustrates the span of Bad and Good YouTube QoE over the different radio access technologies as recorded by ACQUA. In 2G, the proportion of bad QoE is more than 80% and decreases to 45% with 3G and even less around 5% with 4G and WiFi. ACQUA dataset reflects the fact that radio technology drastically impacts video streaming quality.
Fig. 4. Bad/Good QoE span per radio access technology
B. Signal Strength
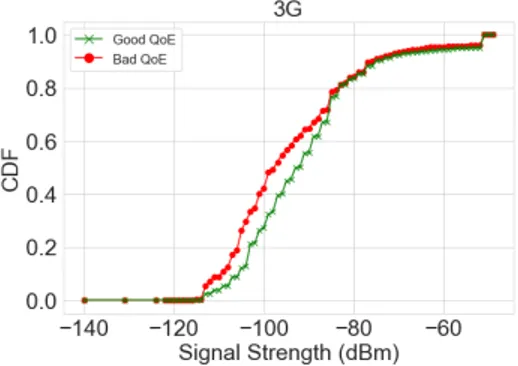
We use the Kolmogorov Smirnov test to measure the distance between the empirical distributions of signal strength for Bad and Good QoE samples. The test confirms that both distributions are statistically different for 4G, 3G and WiFi (e.g., Fig 5 for 3G). Signal strength is thus a second factor responsible for estimated QoE degradation at the access.
Fig. 5. Bad/Good QoE signal strength (dBm) distribution for 3G
C. Mobility
The passive measurements collected by ACQUA include the serving cell id as well as the timestamp of the measurements. We use this information to build our mobility meter around the number of cell changes per time window and study the relationship between mobility and Bad QoE occurrence. We believe our approach is novel in studying mobility in the ab-sence of GPS information. We consider a 10 min time window; a larger window would bias our estimation by diluting the effect of mobility, and a smaller window would not allow to catch the transition between cells. Fig. 6 shows average YouTube QoE versus mobility rate. Overall we observe that mobility rate is inversely proportional to average QoE. Still, our study shows that some technologies are more impacted than others by the mobility of end users.
Fig. 6. Average QoE per Mobility rate
D. Hint on congestion
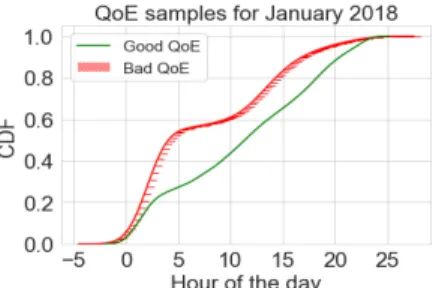
We continue looking for other factors that can be passively collected inside the mobile and that point to network conges-tion from estimated QoE viewpoint. With ACQUA recording the time of measurements, and as time is an indication of network load, we study the relationship between QoE and different time metrics (e.g., Hour and Weekday). For example, and as pointed in Fig. 7, we were able to identify time intervals with bursts of Bad QoE during night and afternoon on each day, whereas Good QoE does not show the same behavior. Time of the day can thus help to interpret network problems.
Fig. 7. Bad/Good QoE CDF over Day hours in January 2018
VI. LIMITATIONS
1) Lightweight measurements: While being effective, our bandwidth measurement method has some limitations. First, we noticed that high-speed bursts of a few packets cannot be handled correctly by Android due to buffering at the receiver’s end. With our current trace size, we can reliably estimate a throughput of up to 20 Mbps. Over this value, our measurement plane starts to lose precision. We believe this limit still allows us to fulfill our goal of QoE estimation for most of services nowadays whose bandwidth requirements are usually lower than this limit. Another limitation come from the fact that UDP traffic might go blocked or rate limited by middleboxes deployed inside the network. To counter this, our future plans include the addition of TCP based measurements launched by the user on a manual basis.
2) QoE models: Due to the generality of our framework, our QoE models are less effective than tailored models target-ing starget-ingle applications. In fact, we do not require the access to application QoS metrics but only use network QoS metrics as inputs to our models. This slightly reduces the accuracy of our models, but most importantly permits us to perform a cross-application prediction of the QoE without the need to run the applications themselves in the mobiles.
VII. CONCLUSION AND FUTURE WORK
We presented ACQUA, a user-centric lightweight platform tailored to continuously sense mobile networks. ACQUA improves the transparency of networks by proposing simple meters to end users about their estimated QoE, while still providing a rich set of technical details. ACQUA also solicits users for their real QoE. Even with a small number of users (100+ downloads), we managed to collect over 1 million measurement records. We summarized the main ideas behind ACQUA and motivated its measurement strategy based on UDP. We also presented first results concerning a set of features that can be collected locally and passively in the mobile and that show correlation with bad network experience. ACQUA currently embeds two QoE models related to YouTube streaming and Skype calls. The work will continue towards covering other applications of interest to the user. We also count on users’ feedback to enhance our models based on standards, by confronting them to real life scenarios. We would like to assess how QoE in reality differs from what is predicted by standards and controlled research work.
Following the sneak peek in Sec. V, we plan to extend the set of features that can correlate with bad network experience (e.g., Android version, battery level, cell load). We will seek a multilayer classifier able to predict in the limit of possible the bad estimated QoE for different applications, so as to shed light on its root cause in today mobile networks.
As conclusion, we aim to fill the gap left by conventional crowd-sourcing apps, such as OpenSignal [19] and Sensorly [14], that provide coverage maps of QoS metrics without QoE consideration. Our platform will allow us to study network patterns among users and tackle mobile network troubleshoot-ing challenges from a different perspective. Such information can allow all stakeholders, including end users, operators, and regulators to have a greater visibility into the mobile network performance w.r.t the targeted Internet applications.
REFERENCES
[1] “Ookla. speedtest.net.” 2018, http://www.speedtest.net/.
[2] J. Huang, C. Chen, Y. Pei, Z. Wang, Z. Qian, F. Qian, B. Tiwana, Q. Xu, Z. Mao, M. Zhang et al., “Mobiperf: Mobile network measurement system,” 2011.
[3] C. Kreibich, N. Weaver, B. Nechaev, and V. Paxson, “Netalyzr: illumi-nating the edge network,” in Proceedings of the 10th ACM SIGCOMM conference on Internet measurement, 2010.
[4] F. Wamser, M. Seufert, P. Casas, R. Irmer, P. Tran-Gia, and R. Schatz, “Yomoapp: A tool for analyzing qoe of youtube http adaptive streaming in mobile networks,” in European Conference on Networks and Com-munications (EuCNC), 2015.
[5] Q. A. Chen, H. Luo, S. Rosen, Z. M. Mao, K. Iyer, J. Hui, K. Sontineni, and K. Lau, “Qoe doctor: Diagnosing mobile app qoe with automated ui control and cross-layer analysis,” in Internet Measurement Conference, 2014.
[6] T. Spetebroot, S. Afra, N. Aguilera, D. Saucez, and C. Barakat, “From network-level measurements to expected quality of experience: The skype use case,” in IEEE International Workshop on Measurements Networking (M N), 2015.
[7] M. J. Khokhar, N. A. Saber, T. Spetebroot, and C. Barakat, “On active sampling of controlled experiments for qoe modeling,” in Proceedings of the Workshop on QoE-based Analysis and Management of Data Communication Networks, 2017.
[8] W. Robitza, S. G¨oring, A. Raake, D. Lindegren, G. Heikkil¨a, J. Gustafs-son, P. List, B. Feiten, U. W¨ustenhagen, M.-N. Garcia, K. Yamagishi, and S. Broom, “HTTP Adaptive Streaming QoE Estimation with ITU-T Rec. P.1203 Open Databases and Software,” in 9th ACM Multimedia Systems Conference, 2018.
[9] A. Raake, M.-N. Garcia, W. Robitza, P. List, S. Gring, and B. Feiten, “A bitstream-based, scalable video-quality model for HTTP adaptive streaming: ITU-T P.1203.1,” in 9th International Conference on Quality of Multimedia Experience (QoMEX), 2017.
[10] “ITU-T P.862 - Perceptual evaluation of speech quality (PESQ): An objective method for end-to-end speech quality assessment of narrow-band telephone networks and speech codecs,” 2001.
[11] T. Hoßfeld, M. Seufert, M. Hirth, T. Zinner, P. Tran-Gia, and R. Schatz, “Quantification of youtube qoe via crowdsourcing,” in IEEE Interna-tional Symposium on Multimedia, 2011.
[12] “Meteor: Free internet speed & app performance test,” 2018, https://meteor.opensignal.com/.
[13] “Rtr-nettest,” 2018, https://www.netztest.at/en/.
[14] “Sensorly - unbiased, real-world mobile coverage,” 2018, https://www.sensorly.com/.
[15] “iperf - the tcp, udp and sctp network bandwidth measurement tool,” 2018, https://iperf.fr/.
[16] “Magic iperf including iperf3,” 2018, goo.gl/BHprDH.
[17] “Acqua (beta) - available on google play store,” 2018, https://play.google.com/store/apps/details?id=fr.inria.sophia.diana.acqua. [18] O. Belmoukadam and C. Barakat, “Data driven approach for net-work troubleshooting and qoe monitoring,” Master thesis, 2018. https://v1.overleaf.com/read/pfszfnbrvsyk.