HAL Id: halshs-00966336
https://halshs.archives-ouvertes.fr/halshs-00966336
Preprint submitted on 26 Mar 2014
HAL is a multi-disciplinary open access archive for the deposit and dissemination of sci-entific research documents, whether they are pub-lished or not. The documents may come from teaching and research institutions in France or abroad, or from public or private research centers.
L’archive ouverte pluridisciplinaire HAL, est destinée au dépôt et à la diffusion de documents scientifiques de niveau recherche, publiés ou non, émanant des établissements d’enseignement et de recherche français ou étrangers, des laboratoires publics ou privés.
Do Remittances Affect Poverty and Inequality ?
Evidence From Mali
Flore Gubert, Thomas Lassourd, Sandrine Mesplé-Somps
To cite this version:
Flore Gubert, Thomas Lassourd, Sandrine Mesplé-Somps. Do Remittances Affect Poverty and In-equality ? Evidence From Mali. 2010. �halshs-00966336�
Do Remittances Affect Poverty and Inequality ?
Evidence From Mali
Flore GUBERT
IRD DIAL
Paris School of Economics
Thomas LASSOURD
DIFID Sandrine MESPLE-SOMPS IRD DIAL
May 2010
G-MonD
Working Paper n°13
Do remittances affect poverty and inequality? Evidence from Mali
*Flore Gubert† Thomas Lassourd‡ Sandrine Mesplé-Somps§
Mai 2010
Using a 2006 household survey in Mali, we compare current poverty rates and inequality levels with counterfactual ones in the absence of migration and remittances. With proper hypotheses on migrants and a selection model, we are able to impute a counterfactual income for households currently receiving remittances. We show that remittances reduce poverty rates by 5% to 11% and the Gini coefficient by about 5%. Households in the bottom quintiles are more dependent on remittances, which are less substitutable by additional workforce.
Classification JEL: F24, O15, O55.
*
We thank Denis Cogneau and Sylvie Lambert for their relevant comments on a previous version of this paper and for suggesting some of the simulations that are run in the paper. We also thank Christophe Müller and other participants at the first GDRI DREEM Conference and at the World Bank’s second international Conference on Migration and Development.
†
IRD, UMR 225 DIAL and Paris School of Economics, 4 rue d’Enghien, 75 010 Paris, [email protected]. ‡
DIFID, [email protected].
Introduction
While neither migration nor migrants' remittances to friends or relatives in their origin country are recent phenomena, the latter has become a subject of increasing interest in the past few years. Official flows of migrants' remittances to developing countries have doubled between 2002 and 2007 and, according to the World Bank, amounted to $305 billion in 2008. They represent a sizeable share of financial inflows to less developed countries, with an amount about twice as high as that of foreign aid and nearly two-thirds of foreign direct investment. This increase in recorded remittances not only results from the growth in the number of migrants, but also from better data collection and a shift from the informal to the formal sector in the remitting business. This in turn is the consequence of improved technologies (e.g. cell phone payments) to transfer small amounts of money, reduced transaction costs, and a political concern about informal capital flows and money laundering after the terrorist attacks of 2001. Still, the World Bank evaluates informal remittances to be at least 50% of the official figures, with a great heterogeneity across countries. According to Freund and Spatafora [2005], informal flows amount to 35-75% of official remittances to developing countries with Eastern Europe, East Asia and Sub-Saharan African countries being in the upper side of the brackets, and East Asia and the Pacific in the lower side. Generally speaking, the formal sector, led by Money Transfer Operators, such as Western Union or MoneyGram, and local banks, is much more developed in Latin America and East Asia than in Africa. This comes as no surprise, as the largest recipients of remittances are located in these regions. In absolute terms, China, India, Mexico and the Philippines are the countries receiving the largest amounts of remittances (between $17 and $27 billion, while in relative terms, Tajikistan, Moldova, Tonga, the Kyrgyz Republic, Honduras, Lesotho, Guyana rank at the top of the list (with remittances representing more than 20% of GDP). The latter are very small countries, much more geographically diverse and their dependence on remittances comes from historical particularities, especially relationships with a large neighbouring country or geographic isolation.
Given the size of remittances, it is worth looking at their impact on the economies of sending countries. In the migration process, they are considered a welfare gain, since they are part of migrants' extra revenue compared to what they would have earned had they stayed at home. However, their net effect is much more complex: they may have both macroeconomic and microeconomic effects.
Macroeconomic effects concern those countries that are large enough receivers (between 4% and 31% of GDP, according to the World Bank) so that their exchange rate, domestic interest rate or balance of payment might be impacted. Like all large sources of foreign currencies (natural resources, top exporting sectors), remittances could lead to a phenomenon similar to the “Dutch Disease”' effect, with an appreciation of the domestic currency and a subsequent loss in competitiveness. Amuedo-Dorantes and Pozo [2004] point in that direction. Using data on 13 Latin American countries, they find that a doubling of workers' remittances would lead to a 22% real exchange rate appreciation. Their results are confirmed by Lopez, Molina and Bussolo [2007] at a global level, and Bourdet and Falk [2006], who attribute the 14% increase in the real exchange rate of Cape Verde in the past decade to the doubling of remittances. However, since remittances tend to be stable over a long period of time, evenly distributed across the population and spent on non-tradable goods, evidence from most countries seem to dismiss this negative effect. In particular, it has been argued by Rajan and Subramanian [2005] that remittances, contrary to other financial flows to developing countries such as international
development assistance, have no adverse effect on growth through the real exchange rate. They explain it by the endogeneity of remittances: migrants stop remitting (at least in cash) when the domestic exchange rate is overvalued. Moreover, as remittance inflows are usually assimilated to export revenues, they improve credit ratings by banks and rating agencies, so that recipient countries have a larger and cheaper access to credit (World Bank, Global Economic Prospects [2006]). Finally, when remittances are counter-cyclical, such as after a natural disaster in the recipient country, they help alleviating the macroeconomic cost of a shock to the economy. Yang [2005], using 30 years of meteorological data and an instrumental variable strategy, finds an insurance effect of financial flows, among which remittances are among the most reactive ones, raising within a year of a natural disaster. The author estimates that the increase in remittances cover 13% of the households' decrease in earnings within the first year after the hurricane and almost 28% within four years, against 26% and 21% for international aid and foreign direct investment respectively. Mishra [2005] finds that a 1% decrease in GDP leads to a 3% increase in remittances after two years in 13 Caribbean countries using data from 1980 to 2002.
Yet remittances are essentially small transfers of money targeted to individual households, so they are more suited to a microeconomic analysis. At this micro level, they might impact both the receiving household's income, therefore the welfare of its members, and its consumption/investment behaviour. For instance, Adams et al. [2008] finds that remittance income in Ghana is treated as any other source of income, after controlling for systematic differences between recipient and non-recipient households. Remittances have nevertheless been found to raise productivity in Mexican rural households, probably through increased investment (Lopez-Feldman and Taylor, [2007]), and to help families overcome capital constraints and invest in livestock production in Burkina Faso (Wouterse and Taylor, [2006]). There is also evidence that remittances may act as an insurance device, flowing in case of an adverse income shock in the household or the community. Clarke and Wallsten [2003] show such an effect in the case of a hurricane in Jamaica: each dollar of physical damages is partly compensated by 25 cents of additional remittances. This could lead to the existence of moral hazard and reduced work incentives in households that can rely on transfers, as suggested by Azam and Gubert [2005]: using data collected in the Kayes area (Western Mali), they show that rural households receiving money from migrant workers tend to be less productive on average, as they know that any adverse shock on their locally-generated income will be compensated by those abroad.
In what follows, we investigate the poverty and inequality impact of remittances in Mali. The choice of this country is justified by its long tradition of both short-distance and long-distance migration within the West African region and outside the African continent in countries as diverse as France or the United States. Using a survey conducted in 2006 on a nationally representative sample of 4,494 households, we compare the current levels of poverty and inequality in this country with the levels of poverty and inequality that would prevail in a scenario without migration and without remittances. While we adopt a methodology that is comparable to that used by previous authors (see, e.g., Barham and Boucher [1998]), we innovate in the way we compute counterfactual scenarii. Overall, we find that remittances reduce poverty rates by 5% to 11% and the Gini coefficient by about 5%. Our results also suggest that households in the bottom quintiles are more dependent on remittances, which are less substitutable by additional workforce.
The paper is organized as follows: Part 1 briefly reviews the literature investigating the poverty and inequality impact of remittances. Part 2 presents our empirical strategy. Part 3 describes the data and provides stylized facts and summary statistics on remittances in Mali. Part 4 then
presents the results, robustness checks and discusses the limits of our empirical work. Part 5 concludes.
1 Remittances, Poverty and Inequality: An Overview
Remittances are initially a consequence of increased migrants' earnings and their will to share this extra revenue with friends and relatives or to invest in their country of origin, sometimes with the intention to return at some point in the future. Depending on the characteristics of migrants and the recipient households, remittances can substantially modify the income distribution. Intuitively, the poorer and less educated the migrants, the more equalizing the impact of remittances. This effect could be strengthened by the fact that low-skilled migrants could remit more, at least relatively to their income, for three main reasons: i) they tend to migrate alone, so they have close relatives (even a nuclear family) in the home country; ii) they spend on average less time in the host country, when a longer stay and progressive integration has been found to have a negative effect on the amount of remittances; iii) their relatives being poorer, they have more incentives and group pressure to remit. Empirical evidence on this debated issue is still inconclusive, however. Faini [2007] and Niimi et al [2008] use cross-country macroeconomic data and find a significantly negative impact of the share of migrants with tertiary education on the total amount of remittances received by country, whereas Bollard
et al. [2009] use microdata and find that more educated migrants do remit significantly more
than less educated migrants. Therefore the composition of the migrant population in terms of skills, education, social and cultural background is a key determinant of the impact of remittances on income and income distribution in the home country.
At the macro-level, there is evidence of a negative correlation between poverty on the one hand, and migration and remittances on the other hand. This is for instance the result obtained by Adams [2003] using simple cross-country regressions. Causality has yet to be shown, however, since migration costs represent a powerful barrier against the migration of the poorest. As a result, there tends to be more migrants from lower-middle income countries, coming from the lower-middle part of the income distribution, since those populations are the ones who can both afford the cost of migration and have the most to gain from it.
Using country case studies and taking proper account of the endogeneity of migration, either through instrumental variable techniques or panel data, are the only ways to determine the impact of remittances on poverty or inequality in a rigorous fashion. By contrast, a naive way to evaluate the net impact of remittances would be to measure poverty rates and inequality index after subtracting transfers from households' income. This tells us what would happen if remittances were to stop, with the current stock of migrants living abroad taken as given. It is obviously too simplistic; the two alternative scenarii would actually be the following ones: either people migrate and remit (or not), either they do not migrate. In the latter case, they would still be living in their home countries, which imply a minima participating in the labour force and consuming. Therefore, when trying to assess the impact of remittances, one needs to compare the current scenario with a counterfactual one that simulates the state of the economy if the current migrants were living in the country. This is the methodology that has been adopted since Adams [1989], based on national household surveys. Using Egyptian data, Adams [1989] estimates a household income function for non-migrant households based on aggregate factors of production, and uses the estimated coefficients to compute the income of migrant households under a no-migration scenario. By so doing, however, he assumes that migrants are randomly selected from the population, when numerous evidence point towards a
self-selection mechanism according to individual (education, motivation), household (income, relationships, occupation) and community (geographic location, ethnic networks) characteristics. Rodriguez [1998] goes a bit further: he assumes that all differences between households with and without migrants are observable or can be reduced to a constant term and simply estimates coefficients for the households' earnings equation, including a dummy for the presence of migrants, and applies them to the no-migration scenario. These coefficients are nevertheless likely to be biased, because it is implicitly assumed that there is no difference in the productivity of factors (physical and human capital) between both types of household. This is why Barham and Boucher [1998], followed in particular by Lachaud [1999], Adams [2006] and Acosta et al. [2007], adapt this idea to a model with (double) selection. Using a Heckman two-step estimator, they correct the earnings equation of non-migrant households by a term that takes into account the observable and unobservable characteristics that may be correlated with the decision to migrate. When possible, they also include a term that takes into account the probability to participate in the labour force. This makes sense as there could be a labour supply effect within and between households; for example, women in the absence of their husbands could substitute for them in their traditional occupations. The better the information on remitters, the finer the counterfactual. One potential issue is that most surveys only collect information on the amount of household income coming from foreign transfers. This implies making strong assumptions on the number of migrants from a given household and their characteristics, and could therefore weaken the results. The usual option is to assume that every household receiving migrants' remittances has one migrant abroad. Another potential issue is that while building the counterfactual scenario, general equilibrium effects are necessarily ignored, because it is almost impossible to determine all the consequences on the labour market, the demand side for consumption, credit, etc, of the migrant population. For instance, there might be multiplier effects of remittances, as those found in Mexico by Durand et al. [1996]: each dollar of remittance sent from the US to Mexico increased Mexican GDP by $2.90, possibly through an increase in demand that benefits the whole economy. This type of effect is obviously not taken into account when assessing the impact of remittances with the method detailed above. Indeed, such counterfactuals are not realistic; they are merely useful as a partial focus on substitution between remittances and local earnings within the household. Once a counterfactual has been computed, there only remains to compare poverty indices or inequality measures between the current scenario and the counterfactual one. Such estimates usually find that remittances decrease poverty, mainly through increased mean income, while measures on inequality are inconclusive, some pointing in one direction or another, depending on the country under concern. We could still argue that, even though remitters are usually not the poorest of their communities, they still belong to the world poor, so that any increase in their income is welcome. An alternative way to look at the impact of remittances on poverty is to use an exogenous shock on remittances, as in Yang and Martinez [2006]. The authors take advantage of the sudden appreciation of various foreign currencies against the Filipino peso after the 1997 Asian financial crisis to estimate the causal impact of the shock on remittances, household income, and poverty among Filipino origin households. They find that in migrants’ origin households, a 10% improvement in the exchange rate leads to a 0.6 percentage point decline in the poverty rate. However, this poverty-reducing impact is proven in an economic downturn: migrants could just be insuring their families in a difficult situation or making the most of a favourable interest rate to invest at home; two behaviours which would not apply in normal times.
2 Empirical Strategy
In order to test the impact of remittances on poverty rates in Mali, we follow the recent literature and compare the current situation with a counterfactual scenario that describes as precisely as possible the state of the economy if the remitters had not migrated at all.1 To this end, we impute a counterfactual income for remittances-recipient households, based on the following reduced-form specification for the determinants of income:
(1)
where Yi is a measure of household non-remittances income, Hi and Xi are vectors of household
and household head characteristics respectively, and i is unobserved heterogeneity in income
generation. In other words, this non-remittances income equation is a household production function with Hi containing factors of production such as physical assets and human capital
measured at the household level and Xi a set of control variables associated to the age, marital
status, sex and occupation of the household head, as well as regional dummies. We believe this specification to be realistic in the Malian context since a majority of households derive their income from collective work. Nevertheless, this production function ought to be different for rural and urban households, so we run separate regressions for each category. We assume a Cobb-Douglas form for the production function. We will interpret it differently for rural and urban households as the former produce an output (estimated by consumption expenditures) from collective work on land and the latter produce it either from a common source of income using all the labour force in the household, or more likely so, from the aggregation of different sources of income.
Two issues need to be addressed before turning to the presentation of the data and the regression results. The first one relates to the computation of the counterfactual income. If detailed data on the number of migrants and their characteristics (sex, occupation, education, experience, past and current wages, countries of destination, etc.) within each household were available, an alternative to the above specification would be to build a counterfactual scenario in which migrants would be imputed the productivity of non-migrant individuals with similar characteristics. In the absence of such information, however, we need to make various assumptions about the number and the demographics of migrants. In this respect, we follow the literature and assume that remittances are sent by either one or two adults with completed primary schooling (5 years of education). In the counterfactual scenario without migration, household income will thus be divided by household size plus one (or two) individual to get per capita income.2
The second issue relates to selectivity. If migrants were randomly selected across households in the country, i.e. if i were independently identically distributed, then we would just have to run
an OLS regression of equation (1) on non-migrant households and use the estimated coefficients , and to compute the counterfactual non-remittances income of migrant households. However, there is strong evidence that both migrants and migrant households are self-selected in the population, so that i is not i.i.d. and OLS coefficients are
1
. Since not all migrants remit and some households receive remittances without having any migrant, migrant households and remittances-recipient households should not be treated equivalently. However, the household survey that is used in the empirical part of the paper does not provide information on migration per se. It only records remittances received from abroad. For ease of simplification, the terms “remittances-recipient households” and “migrant households” are thus used indifferently in the remainder of the paper.
2
We also allowed the migrants' characteristics to vary between urban and rural areas, assuming that those migrants originating from urban areas were much more educated on average than those coming from rural ones. Results were mostly unchanged but are available upon request.
inconsistent. Indeed, when migrants tend to come from more dynamic and productive households, using the simple OLS estimates of equation (1) underestimate the counterfactual income of these households (and so overestimate the migration effect), as they would use their factors of production more productively whether or not they migrated.
To control for this possibility, we closely follow Barham and Boucher [1998], although we innovate in the way we deal with the residuals. In a first step, we model the non-remittances selection rule using the following probit specification:
∗ (2)
where:
1 ∗ 0 0 ∗ 0
As it is a non-selection equation, M equals one when the household does not receive remittances, zero otherwise. This amounts to saying that migration is a treatment status, which yields two different outcomes: if a household receives remittances, it is considered as a “migrant household” with a production function generating an income Y1; else its production
function has different coefficients and generates an income Y0. More formally:
∗ 0 ∗ 0
This enables us to take into account the selection on observable characteristics Hi, Xi and Zi, Zi
being variables that are correlated with the probability to migrate but not with household income, as well as on unobservables contained in i. This first step gives us the probability to
be a non-remittance receiver, or ∗ 0 Φ . From
this probability, we compute the (non-remittances) selection inverse Mill's ratio:
Φ
And we compute as well the (remittances) selection inverse Mill's ratio:
1 Φ
We then add these terms in the earnings equations of both migrant and non-migrant households:
| , ; ∗ 0 (3)
| , ; ∗ 0 (4)
Following Heckman, we estimate a parametric model, and we impose a joint normality distribution of the error terms:
↝ 0 0 0 , ∑ with ∑ , , , , , , 1 , ,
We now have consistent estimates since controlling for i allows the remaining to have the
usual i.i.d. properties. The actual existence of selection in our data is then easily testable through a Wald Test, in which the null hypothesis is : 0.
We finally use the efficient coefficients , and to impute the counterfactual income of remittances-recipient households. However, this counterfactual income has an artificially small variance, since it is computed from observable household characteristics only. One way to deal with this problem is to use the same technique as Barham and Boucher [1998] or Acosta et al. [2007], i.e. to add to the predicted income a random error component drawn from a distribution with the same mean and variance as the estimated error ̂ . In order to avoid the results to be dependent on a particular draw, the authors replicate the estimation 1000 times, each time computing a counterfactual income for remittances-recipient households and the subsequent poverty and inequality levels. They then report the median draw of all estimates, as well as the 95% confidence interval bounds.
In what follows, we adopt a slightly different strategy to deal with the error term in order to exploit all the available information. We know that much of the selection of migrant households expressed in their production function cannot be explained by observable household characteristics, and is contained in the residuals . We can obtain estimates ̂ from the corrected equation (4). What we would like to do is to use the information contained in ̂ when imputing the counterfactual income of migrant households. That is, we would like to draw an
∗ which would not have the same properties as the estimated ̂ from equation (3) but that
would keep the information in ̂ .
Since we imposed the joint normality of residuals, there exists a simple relationship between them. For instance: , where ↝ 0, 1 , . Ideally, if we were able to estimate the correlation between and , it would be straightforward to get the desired
∗. However, what the Heckit estimations yield are and , the correlations between and
on the one hand, and and on the other. So, from the estimated ̂ , we obtain a measure of ̂, through : where ↝ 0, 1 .
To make sure that these households were selected into migration, we impose ̂ to be such that
∗ 0 for the concerned households, by redrawing v from its normal distribution as many
times as needed. We have therefore fully taken into account the unobservable determinants of receiving remittances for a household. In the counterfactual scenario, these households are not going to receive remittances anymore but they should keep their unobservable characteristics in their production function. With the same procedure, we obtain the desired ∗:
∗ ∗
Finally, we have all the elements needed to compute the counterfactual income of remittances-recipient households:
∗| , ; ∗ 0 ∗ (5)
Because our results are still dependent on particular draws of v and v', we repeat the process 100 times, computing counterfactual incomes, poverty rates and Gini coefficients every time, in order to get robust values and confidence intervals at the 5% level.
For comparison purpose, our results will be presented together with those that we would have obtained had we adopted either the naïve methodology or that of Barham and Boucher.3
3 Data and Summary Statistics
3.1 Dataset
We use data from the “Enquête Légère Intégrée auprès des Ménages” (ELIM), a nationally representative household budget survey that was conducted in Mali between June and December 2006. This survey collected detailed information on consumption, income including transfers and remittances, credit, savings, gifts, assets, household members' characteristics as well as subjective opinions on welfare and politics for 4,494 households (40,810 individuals). 3.2 Remittances in Mali
Using the year-wise amount of remittances received from abroad as declared by the respondents of the ELIM 2006 survey and the appropriate extrapolation weights, total remittances are evaluated at FCFA 90 billion for year 2005-2006 (3.7% of GDP). At the euro-dollar exchange rate that was prevailing at that time, this suggests that total remittances in dollar terms amounted to 217 million, a figure that is very close to the one provided by the IMF’s Balance of Payment Yearbook.
The distribution of remittances by region is shown by Figure 1. Only remittances from abroad are accounted for. As the main source of Malian migrants to France, the Kayes area is accordingly the main recipient of remittances from abroad: almost half of all remittance flows to Mali goes to households residing in this region. Mopti and Bamako also stand out as two large receivers.
Figure 1: Distribution of remittances received from abroad by region, Mali 2006.
3 We know from previous evidence that migration-cum-remittances has an impact on the labour supply and earnings outcomes of those left behind. Ideally, our estimated model should thus be a model of double-selection, where the two selection rules model the choice of migration together with the choice of labour force participation by non-migrants. However, given the lack of data on labour suply, we could not estimate such a model.
Source: ELIM 2006, authors’ computations.
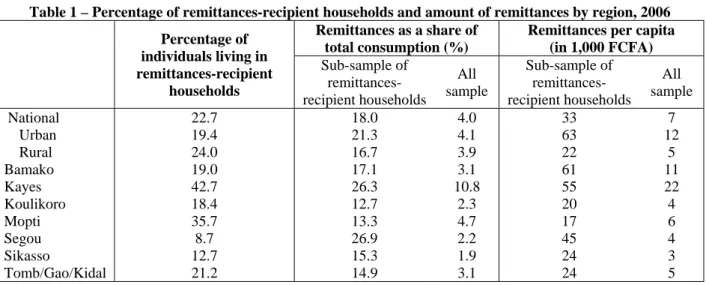
The particular situation of Kayes also stands out in terms of the number of remittances-recipient households, and in terms of the share of remittances in household consumption (Table 1): almost 43% of people living in the Kayes area receive remittances, about twice the national average. In addition, remittances sent to this region represent 26% of remittances-recipient households’ consumption that is to say almost 11% of all households’ consumption (respectively 18% and 4% at the national level). The case of Mopti is also worth discussing. With around 36% of inhabitants living in remittances-recipient households, the region is also strongly involved in international migration. However, the destination of international migrants from this region being mostly within the African continent, households receive much less on average as a share of their consumption than those of Kayes.
Bamako 16% Kayes 41% Koulikoro 7% Mopti 16% Segou 8% Sikasso 7% Tombouctou/ Gao/Kidal 5%
Table 1 – Percentage of remittances-recipient households and amount of remittances by region, 2006 Percentage of individuals living in remittances-recipient households Remittances as a share of total consumption (%)
Remittances per capita (in 1,000 FCFA) Sub-sample of remittances-recipient households All sample Sub-sample of remittances-recipient households All sample National 22.7 18.0 4.0 33 7 Urban 19.4 21.3 4.1 63 12 Rural 24.0 16.7 3.9 22 5 Bamako 19.0 17.1 3.1 61 11 Kayes 42.7 26.3 10.8 55 22 Koulikoro 18.4 12.7 2.3 20 4 Mopti 35.7 13.3 4.7 17 6 Segou 8.7 26.9 2.2 45 4 Sikasso 12.7 15.3 1.9 24 3 Tomb/Gao/Kidal 21.2 14.9 3.1 24 5
Source: ELIM 2006, authors’ computations.
More generally speaking, the percentage of individuals relying on remittance income is higher in rural areas, but the amount they get as a share of their consumption is smaller. This can partly result from differences in the cost of living, or in the skill level of migrants: migrants from urban areas may have higher skills indeed than migrants from rural areas, get higher wages in the host country and may thus be able to remit more. This is straightforward in our database, from which we can impute that 83% of high school or university graduates live in urban areas. Social pressure may be another explanation: migrants from rural areas may have pressure to remit to more people in their extended community, so they may have to divide what they save to remit into more but smaller pieces. Having less constraints to give outside their families, migrants from urban areas may be able to remit more, but to less households.
The main insight from Table 1 is that the country is not really dependent on remittances, which barely amount to 4% of total household consumption, and about the same share of official GDP. We are far from the situation of Tajikistan (36% of GDP), Haiti (22%) or even Gambia (13%). However, as remittances are directed to only 20% of households and very unequally distributed, some households may be heavily impacted by this income flow from abroad. For instance, remittances represent on average 18% of remittances-recipient households’ consumption at the level of the country, 26% in Kayes, and as much as 40% for urban households in Segou. This is somewhat less than what Lachaud [1999] finds for Burkina Faso, though that was before the crisis in Côte d’Ivoire, when there were thousands of West African migrants working in the dynamic agricultural export sector. Still, it is likely that without this source of income, remittances-recipient households would have to reduce their consumption drastically and could eventually fall into poverty.
It is now of interest to look at the distribution of remittances by quintile of per capita consumption to have an idea of their importance in the income distribution. In absolute terms, the upper quintile gets a disproportionately high share of remittances, almost half of the total flows (Figure 2). In relative terms, though, remittances to the fifth quintile only account for 4.7% of remittances-recipient households’ consumption expenditures, which is only slightly more than the average (Table 2). This figure varies between 2.8% and 4.7% across quintiles, so that remittances do not seem to discriminate poorer households or to have a decisive impact on income distribution.
Figure 2: Proportion of remittances by quintile of consumption per capita, Mali 2006.
Source: ELIM 2006, authors’ computations.
Table 2: Mean share of remittances in total consumption by quintile of consumption per capita (%), 2006.
Quintile Q1 Q2 Q3 Q4 Q5 Total
Mean share of remittances in total consumption (%) 3.0 2.8 4.6 3.7 4.7 4.0
Source: ELIM 2006, authors’ computations.
Last, it is interesting to compare our findings with figures computed from the “Enquête
Malienne de Conjoncture Economique et Sociale” (EMCES), a survey conducted in Mali on a
nationally representative sample of households twelve years or so before ELIM 2006 (see Gubert [2000]). At the country level, the percentage of remittances-recipient households has increased from 16.7% to 19.4%, with important regional differences. In Kayes for instance, it went up from 28.1% to 38.6%; in Mopti, from 18.6% to 28.9% and in Bamako from 5.6% to 16%. This last result confirms an increasing trend of urban emigration. The share of remittances in total household consumption (for recipient households only) has also markedly increased in all regions but Kayes, where it was already close to 25% in 1994. It doubled in Mopti or Sikasso and more than tripled in Segou.4
3.3 Variable Description and Summary Statistics
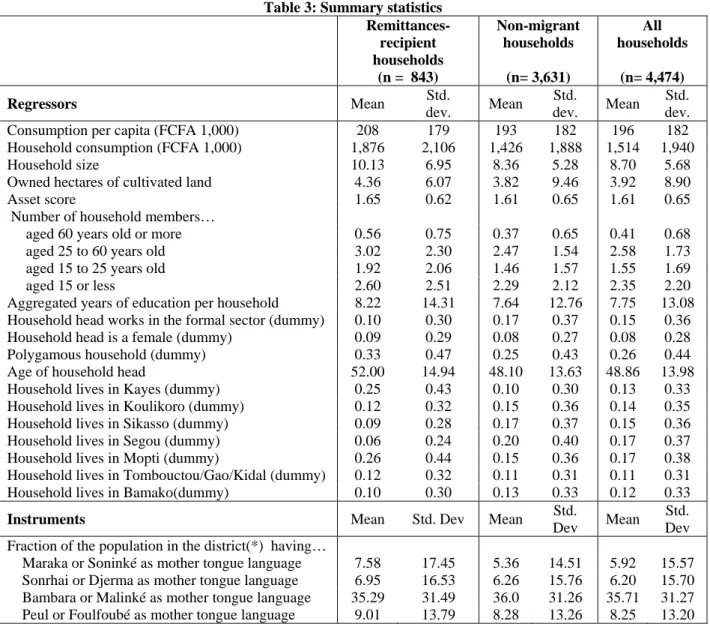
Names and definitions of the variables used in the regressions are reported in Table 3, together with summary statistics computed on the sub-sample of remittances-recipient (or migrant) households (column 1), on the sub-sample of non-migrant households (column 2) and on the whole sample (last column). 20 observations were dropped due to the lack of data on consumption expenditures.
4
These increases are likely to be underestimated since EMCES 1994 collected no data on self-consumed production. As a result, the consumption aggregate computed from this survey is underestimated, leading to an artificially high share of remittances in total household consumption for this year.
Q 1 6% Q 2 9% Q 3 15% Q 4 21% Q 5 49%
While we have both data on consumption and income, consumption (including home-produced goods) is generally found to be a more reliable indicator than income (Deaton [1997]). This explains why the consumption impact of remittances will be the focus of our analysis.5 The consumption aggregate is computed using detailed lists of goods consumed by each household and valued at prices provided by the respondents. Such a recording may lead to issues of misreporting but no national consistent price system could serve as an alternative. The advantage of this method is that it takes regional price differences into account in households' real income. Note that in what follows, the terms “consumption” and “income” will be used interchangeably.
The regressors of equation (1) can be grouped into two categories, with factors of production such as physical assets and human capital on the one hand and control variables relating to the household head and to place of residence on the other hand. In the former group, the “asset” variable is an asset score, ranging from 1 to 3.34. It is computed using the weight of seven assets, namely car, motorcycle, bike, boat, computer, phone and sewing machine, derived from a principal component analysis. The minimum of land ownership was set at 0.01 instead of 0 for the consistency of the log, without loss of generality. We disaggregated household size by age group to have an idea of the typical household in Mali: it is usually very large, with an average of nearly 9 members, and young, with half of the members having less than 25 years old. This disaggregation is also aimed at accounting for differences in productivity levels between household members. Our measure of human capital is the total number of years of education completed by all household members aged 15 to 60. Turning to the control variables, we set the Sikasso region as the default category, and merged the three regions of Tombouctou, Gao and Kidal, which are under-represented in the survey sample and have similar geographic, demographic and economic characteristics, under a single dummy.
Summary statistics by migratory status show that remittances-recipient households are on average larger in all age groups and richer whatever the chosen indicator: they consume more, have more assets and cultivate and own more land. Migrant households are also more often female-headed, more often polygamous, and their head is less likely to work in the formal sector.
Let us now turn to a description of the variables affecting migration and/or the receipt of remittances. The vector of variables Z is essential for the identification of our model. If the variables in equation (1) and (2) were indeed the same, there would be an issue of collinearity when measuring | ∗ 0 and the model would be unidentified. Selecting correct
instruments for migration is a tough problem in the whole literature on migration. A common option when dealing with ethnic-based networks of migrants is to use some measures of ethnic affiliation or geographic concentration, such as in Adams et al. [2008] or Lachaud [1999]. This is particularly relevant in the case of Mali, where migrants are influenced by ethnic networks in their migration decision and destination, in particular the Soninke in France (see Azam and Gubert [2005]). We thus computed from the 1998 Population Census the share of each of the four main ethnic groups by “district” (arrondissement) and use these variables as instruments for the probability of receiving remittances. The implicit assumption here is that these variables measured in 1998 are correlated with the probability to receive remittances in 2006 but not with observed household consumption in 2006.
5
Another reason for using consumption instead of income is that the poverty line that will be used in the paper to separate poor from non-poor households is based on consumption data.
Table 3: Summary statistics Remittances-recipient households (n = 843) Non-migrant households (n= 3,631) All households (n= 4,474) Regressors Mean Std. dev. Mean Std. dev. Mean Std. dev.
Consumption per capita (FCFA 1,000) 208 179 193 182 196 182
Household consumption (FCFA 1,000) 1,876 2,106 1,426 1,888 1,514 1,940
Household size 10.13 6.95 8.36 5.28 8.70 5.68
Owned hectares of cultivated land 4.36 6.07 3.82 9.46 3.92 8.90
Asset score 1.65 0.62 1.61 0.65 1.61 0.65
Number of household members…
aged 60 years old or more 0.56 0.75 0.37 0.65 0.41 0.68
aged 25 to 60 years old 3.02 2.30 2.47 1.54 2.58 1.73
aged 15 to 25 years old 1.92 2.06 1.46 1.57 1.55 1.69
aged 15 or less 2.60 2.51 2.29 2.12 2.35 2.20
Aggregated years of education per household 8.22 14.31 7.64 12.76 7.75 13.08
Household head works in the formal sector (dummy) 0.10 0.30 0.17 0.37 0.15 0.36
Household head is a female (dummy) 0.09 0.29 0.08 0.27 0.08 0.28
Polygamous household (dummy) 0.33 0.47 0.25 0.43 0.26 0.44
Age of household head 52.00 14.94 48.10 13.63 48.86 13.98
Household lives in Kayes (dummy) 0.25 0.43 0.10 0.30 0.13 0.33
Household lives in Koulikoro (dummy) 0.12 0.32 0.15 0.36 0.14 0.35
Household lives in Sikasso (dummy) 0.09 0.28 0.17 0.37 0.15 0.36
Household lives in Segou (dummy) 0.06 0.24 0.20 0.40 0.17 0.37
Household lives in Mopti (dummy) 0.26 0.44 0.15 0.36 0.17 0.38
Household lives in Tombouctou/Gao/Kidal (dummy) 0.12 0.32 0.11 0.31 0.11 0.31
Household lives in Bamako(dummy) 0.10 0.30 0.13 0.33 0.12 0.33
Instruments Mean Std. Dev Mean Std.
Dev Mean
Std. Dev Fraction of the population in the district(*) having…
Maraka or Soninké as mother tongue language 7.58 17.45 5.36 14.51 5.92 15.57
Sonrhai or Djerma as mother tongue language 6.95 16.53 6.26 15.76 6.20 15.70
Bambara or Malinké as mother tongue language 35.29 31.49 36.0 31.26 35.71 31.27
Peul or Foulfoubé as mother tongue language 9.01 13.79 8.28 13.26 8.25 13.20
Source: ELIM 2006, RGP 1998, authors’ computations. (*) Households in the sample are located in 214 districts.
in the sample.
4 Results
4.1 Heckman two-step estimates
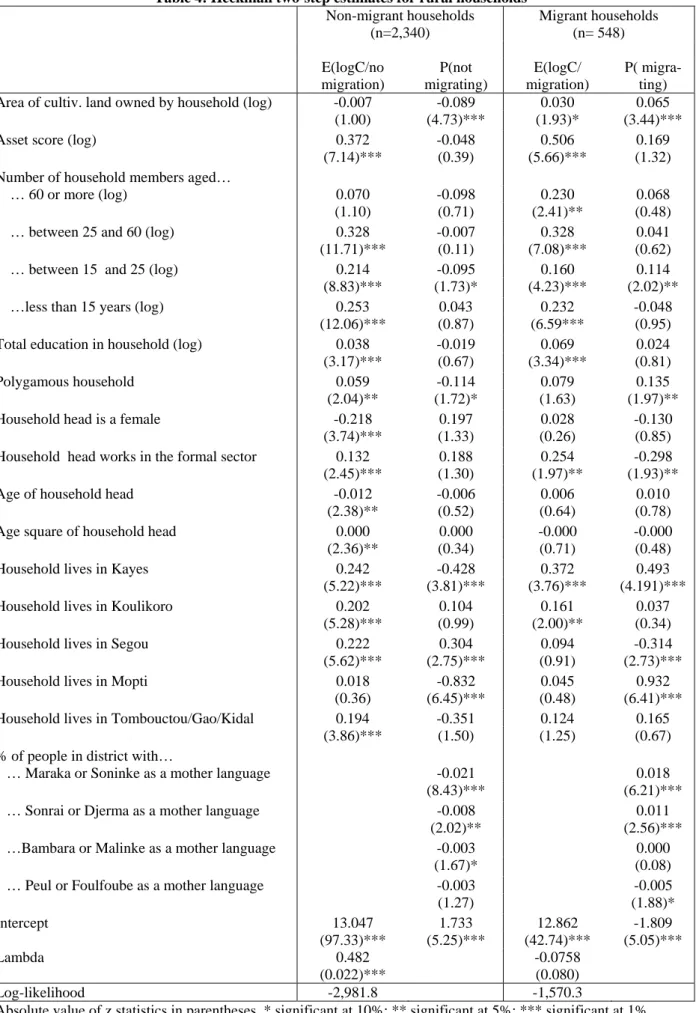
Econometric estimates of equations (3) and (4) are contained in Tables 4 and 5 for rural and urban households respectively.
Looking first at our selection equation, regression results confirm the validity of our instruments: most of the ethnic concentration variables for rural and urban samples are indeed statistically significant at the 1% or 5% level. The concentration of Maraka and Soninke by district in 1998 is positively correlated to the probability of migrating and/or receiving remittances for both rural and urban households, as well as the concentration of Sonrai and Djerma, who are natives of the Mopti region but for rural households only. Turning to the other regressors, many variables that belong to vectors H and X are not significant, though we have to use them for identification purposes. Nevertheless, those which are significant confirm intuitive interpretations. Coefficients of the variables relating to household wealth, for instance, such as the asset score and the quantity of land owned and cultivated by the household are positive and
significant in the migration selection equation for both urban and rural samples. This suggests that migration is costly and favoured by initial wealth, and some would-be migrants may be financially constrained. By contrast, the probability of migrating and/or receiving remittances is lower when the household head works in the formal sector. This makes sense as far as working in the formal sector implies a higher status and wage, less volatility in earnings, additional opportunities for other household members, and so less incentives to migrate. In urban areas, female-headed households are more likely to receive remittances than male-headed ones, which we can interpret as mothers and wives' reliance on migrants' abroad. In both rural and urban areas, polygamy is correlated with the probability of receiving remittances. Two reasons may explain this last result. First, polygamous household have logically more members, so it is less costly for them to send some members away, and it achieves higher efficiency in terms of diversification. Second, it could be that migrant households are richer, and consequently more likely to count many dependents. Finally, regional dummies are found to have strong effects on the probability to migrate and/or receive remittances. In particular, rural households residing in Kayes and Mopti are much more likely to receive remittances. This suggests that all else equal, there is a strong propensity to migrate from these regions, due to past migration experience and well-developed networks of migrants abroad, especially in France and other African countries. By contrast, rural households residing in Segou are less likely to migrate and/or receive remittances. In the case of urban households, the most prone to migrate seem to be those households residing in Mopti and Tombouctou.
Let us now turn to the results of the consumption equations. Evidence of a selection on non-observables among non-migrant households is provided by the test on , the coefficient of the inverse Mill's ratio (the “lambda”). For non-migrant households, the selection control variable is indeed significant, suggesting a positive correlation between the error terms of the (non)migration selection equation on the one hand and the error terms of the consumption equation on the other hand. The rest of the coefficients have the expected signs. In particular, household demographic variables are found to be positively correlated with aggregate consumption, similarly as our measure for education and the dummy taking value 1 if the household head is employed in the formal sector. By contrast, female-headed households are found to consume significantly less. Surprisingly enough, the quantity of land cultivated and owned by the household is not or barely significant in the regression run on the rural sample. We believe that the data on land ownership is not accurate, firstly because land ownership in rural Sahelian countries is not well defined, blurred by community rights and other extra-juridical traditions; secondly because farmers themselves have little idea of how much land they use. Finally, the age and age square of the household head are not significant in the urban sample, despite being a popular control in the literature.
4.2 Poverty and Inequality Impact
This section takes the next step in constructing the poverty headcounts and Gini coefficients for household consumption by imputing household consumption in the no-migration counterfactual. In what follows, we model three counterfactual scenarii to migration and remittances:
Counterfactual 1 or “naïve”: we simply subtract remittances from total consumption for remittances-recipient households;
Counterfactual 2: we impute the consumption of remittances-recipient households using the same methodology as the one adopted by Barham and Boucher [1998] and Acosta et al. [2007];
Counterfactual 3: we impute the consumption of remittances-recipient households using the same methodology as the one adopted by Barham and Boucher [1998], but innovating in the way we deal with residuals.
Every remittances-recipient household is further assumed to have one adult migrant abroad with five years of completed years of education. Whatever the no-migration counterfactual scenario, household consumption is thus divided by household size plus one individual to get per capita consumption. The assumption on the number of migrants per remittances-recipient household may be considered to be a strong and conservative one as the World Bank estimated at 1,213,042 the number of Malians living abroad in 2006. Assuming one migrant per remittances-recipient household amounts to 274,871 migrants at the level of the country. For this reason, our estimates should be considered as lower-bond estimates.6
Tables 6 and 7 report simulations of the effects of remittances and migration on poverty and inequality levels. Table 6 presents poverty rates using the Malian official poverty line which is based on the cost-of-basic-needs method. This method consists in computing a food poverty line that is defined as the level of expenditures necessary to achieve an intake requirement of 2,450 calories per person per day. This poverty line is then scaled up to include a non-food component, by determining the average level of total expenditure of those people whose food expenditures are just equal to the food poverty line. This method has been applied for each region and area of Mali in order to control for regional differences in prices and consumption patterns, resulting in 18 distinct poverty lines.7 Table 7 shows estimates of the Gini coefficient together with mean consumption per capita by quintile.
6
We also run the simulations assuming that remittances-recipient households have two migrants instead of one, but our results remained basically unchanged.
7
Even if Delarue et al. [2008] criticized the way this poverty line has been calculated, which strongly overestimates poverty rates in the Sikasso region, we decided to use this poverty line to be able to compare our results with official Malian poverty indicators.
Table 4: Heckman two-step estimates for rural households Non-migrant households (n=2,340) Migrant households (n= 548) E(logC/no migration) P(not migrating) E(logC/ migration) P( migra-ting)
Area of cultiv. land owned by household (log) -0.007 -0.089 0.030 0.065
(1.00) (4.73)*** (1.93)* (3.44)***
Asset score (log) 0.372 -0.048 0.506 0.169
(7.14)*** (0.39) (5.66)*** (1.32)
Number of household members aged…
… 60 or more (log) 0.070 -0.098 0.230 0.068
(1.10) (0.71) (2.41)** (0.48)
… between 25 and 60 (log) 0.328 -0.007 0.328 0.041
(11.71)*** (0.11) (7.08)*** (0.62)
… between 15 and 25 (log) 0.214 -0.095 0.160 0.114
(8.83)*** (1.73)* (4.23)*** (2.02)**
…less than 15 years (log) 0.253 0.043 0.232 -0.048
(12.06)*** (0.87) (6.59*** (0.95)
Total education in household (log) 0.038 -0.019 0.069 0.024
(3.17)*** (0.67) (3.34)*** (0.81)
Polygamous household 0.059 -0.114 0.079 0.135
(2.04)** (1.72)* (1.63) (1.97)**
Household head is a female -0.218 0.197 0.028 -0.130
(3.74)*** (1.33) (0.26) (0.85)
Household head works in the formal sector 0.132 0.188 0.254 -0.298
(2.45)*** (1.30) (1.97)** (1.93)**
Age of household head -0.012 -0.006 0.006 0.010
(2.38)** (0.52) (0.64) (0.78)
Age square of household head 0.000 0.000 -0.000 -0.000
(2.36)** (0.34) (0.71) (0.48)
Household lives in Kayes 0.242 -0.428 0.372 0.493
(5.22)*** (3.81)*** (3.76)*** (4.191)***
Household lives in Koulikoro 0.202 0.104 0.161 0.037
(5.28)*** (0.99) (2.00)** (0.34)
Household lives in Segou 0.222 0.304 0.094 -0.314
(5.62)*** (2.75)*** (0.91) (2.73)***
Household lives in Mopti 0.018 -0.832 0.045 0.932
(0.36) (6.45)*** (0.48) (6.41)***
Household lives in Tombouctou/Gao/Kidal 0.194 -0.351 0.124 0.165
(3.86)*** (1.50) (1.25) (0.67)
% of people in district with…
… Maraka or Soninke as a mother language -0.021 0.018
(8.43)*** (6.21)***
… Sonrai or Djerma as a mother language -0.008 0.011
(2.02)** (2.56)***
…Bambara or Malinke as a mother language -0.003 0.000
(1.67)* (0.08)
… Peul or Foulfoube as a mother language -0.003 -0.005
(1.27) (1.88)* Intercept 13.047 1.733 12.862 -1.809 (97.33)*** (5.25)*** (42.74)*** (5.05)*** Lambda 0.482 (0.022)*** -0.0758 (0.080) Log-likelihood -2,981.8 -1,570.3
Table 5: Heckman two-step estimates for urban households Non-migrant households (n=1,290) Migrant households (n=286) E(logC/no migration) P(not migrating) E(logC/ migration) P( migra-ting)
Asset score (log) 0.613 -0.365 0.767 0.414
(9.90)*** (2.16)** (5.65)*** (2.46)**
Number of household members aged…
… 60 or more (log) 0.109 -0.130 -0.037 0.161
(1.19) (0.64) (0.25) (0.77)
… between 25 and 60 (log) 0.271 -0.088 0.328 0.097
(7.66)*** (1.02) (5.25)*** (1.13)
… between 15 and 25 (log) 0.110 -0.054 0.281 0.074
(3.71)*** (0.71) (4.85)*** (0.98)
…less than 15 years (log) 0.222 -0.038 0.169 0.065
(8.67)*** (0.57) (3.24)*** (0.98)
Total education in household (log) 0.111 -0.017 0.022 -0.013
(7.78)*** (0.44) (0.76) (0.33)
Polygamous household 0.079 -0.019 0.073 0.025
(1.93)* (0.19) (0.92) (0.24)
Household head is a female -0.063 -0.163 -0.089 0.222
(1.28) (1.37) (0.94) (1.84)*
Household head works in the formal sector 0.056 0.222 0.054 -0.220
(1.71)* (2.46)** (0.65) (2.38)**
Age of household head 0.010 0.003 -0.017 -0.007
(1.44) (0.17) (1.11) (0.38)
Age square of household head -0.000 -0.000 0.000 0.000
(1.13) (0.73) (1.07) (0.97)
Household lives in Kayes 0.129 -0.191 0.385 0.304
(1.94)* (0.89) (2.37)** (1.38)
Household lives in Koulikoro 0.021 -0.039 0.363 0.041
(0.37) (0.21) (2.51)** (0.22)
Household lives in Segou -0.064 0.017 0.004 -0.082
(1.21) (0.10) (0.03) (0.48)
Household lives in Mopti 0.090 -0.462 0.131 0.589
(1.44) (1.81)* (0.86) (2.12)**
Household lives in Tombouctou/Gao/Kidal 0.054
(0.94) -0.831 (2.10)** 0.167 (1.08) 0.905 (2.07)**
Household lives in Bamako 0.186 0.036 0.460 -0.036
(3.67)*** (0.21) (3.44)*** (0.21)
% of people in district with…
… Maraka or Soninke as a mother language -0.043 0.038
(5.22)*** (4.30)***
… Sonrai or Djerma as a mother language 0.001 -0.000
(0.18) (0.07)
…Bambara or Malinke as a mother language -0.012 0.014
(2.23)** (2.25)**
… Peul or Foulfoube as a mother language -0.016 0.013
(2.18)** (1.63) Intercept 12.633 2.478 13.632 -2.505 (70.29)*** (4.51)*** (28.91)*** (4.20)*** Lambda 0.361 (0.0469)*** -0.141 (0.130) Log-likelihood -1,549.2 -887.8
Table 6: Poverty impact of remittances Observed Counterfactual 1 “naïve” Counterfactual 2 Barham and Boucher Counterfactual 3 Barham and Boucher “modified” Poverty rate (%) National 46.4 [43.6 - 49.3] 51.4 [48.7 – 54.1] 51.2 [50.4 – 51.8] 48.8 [47.9 – 49.7] Urban 27.3 [23.1 – 31.5] 32.2 [27.7 – 36.8] 30.7 [29.6 – 32.0] 30.0 [28.9 – 31.2] Rural 55.3 [51.4 – 59.3] 60.4 [56.9 – 63.9] 60.7 [59.4 – 61.7] 57.7 [56.5 – 59.0] Bamako 12.4 [7.4 – 17.4] 16.2 [10.6 – 21.8] 15.0 [12.7 – 16.9] 15.7 [13.6 – 18.0] Kayes 40.6 [33.7 – 47.5] 53.4 [47.4 – 59.4] 54.0 [51.2 – 57.0] 43.3 [41.0 – 45.9] Koulikoro 40.5 [34.7 – 46.2] 43.7 [39.0 – 49.4] 43.2 [41.4 – 44.8] 42.2 [40.4 – 43.6] Mopti 45.6 [35.6 – 55.7] 53.4 [44.4 – 62.3] 55.4 [51.3 – 58.2] 52.0 [48.8 – 55.5] Segou 49.2 [44.2 – 54.1] 51.1 [45.8 – 56.4] 50.0 [48.7 – 51.2] 49.3 [48.5 – 50.5] Sikasso 81.8 [76.6 – 87.1] 83.0 [77.8 – 88.2] 82.2 [81.1 – 83.1] 81.5 [80.5 – 82.5]
Tombouctou Gao Kidal 22.8
[17.0 – 28.5] 28.2 [21.8 – 34.6] 25.7 [23.6 – 28.1] 26.6 [24.7 – 29.1] Share of poor (%)
Thousands of additional poor
National 100 617 592 296 Urban 18.6 190 132 105 Rural 81.4 430 454 202 Bamako 2.7 48 32 41 Kayes 11.8 212 222 45 Koulikoro 13.1 59 50 31 Mopti 19.2 187 235 154 Segou 16.9 37 16 2 Sikasso 33.2 28 9 -7
Tombouctou Gao Kidal 3.1 50 27 35
Results in Table 6 show that poverty would be significantly more severe whatever the simulation and whatever the region under concern. In Mali as a whole, the increase would range from 2.4 to 5 percentage points depending on the simulation, with large regional disparities. Interestingly enough, there are significant differences between our first, second and third counterfactuals. Not surprisingly, the naïve counterfactual gives the most optimistic impact of remittances on poverty: around 620,000 individuals are found to escape from poverty thanks to remittances. Once the migrants’ potential earnings in Mali is accounted for, the estimated impact is less strong with the number of additional poor falling from either 620,000 to 590,000 or 620,000 to 300,000 depending on the way the income generated by return migrants is estimated. Overall, the decrease in poverty indicators is higher when we adopt exactly the same methodology as the one used by Barham and Boucher than when we modify it so as to make use of all the information contained in the residuals. This suggests that counterfactual 2 over-estimates the poverty-impact of remittances by not fully taking into account the remittances-recipient households’ unobservable characteristics.
In relative terms, the poverty increase would be higher in urban areas (+10%) than in rural areas (+4%). These results are in line with those found by Lachaud (1999) in Burkina Faso.8 According to our third estimate, the increase in poverty without migration would be particularly severe in the regions of Bamako (+27%), Tombouctou-Gao-Kidal (+17%) and Mopti (+14%). In the region of Kayes, the poverty impact of migration is less significant (7%). This unexpected result suggests that remittances-recipient households in this region are not the poorest ones as these households have unobservable characteristics (probably because of the long tradition of migration) that make them more productive on average than remittances-recipient households residing in other regions of the country.
We thus have substantial evidence that remittances play a poverty-reducing role, which we can interpret in the following way: on average, the net consumption gain from migration for those who stay is the sum of what the migrant remits, what he would have consumed had he decided to stay, minus what he would have earned had he not migrated. This is indeed a gain, as it is positive.
The next question is the following one: are households differently affected across the income distribution? In Table 7, the population is split into five groups according to their counterfactual per capita consumption. In counterfactual 3, migration and remittances are found to have a clear equalizing effect: the lower the quintile, the higher the gain in average consumption through remittances. The upper quintile is actually losing in average consumption through migration. In other words, poorer households are found to receive more from their migrant workers than what these workers would have earned had they stayed in Mali. The reverse happens for those households located in the upper part of the income distribution. This last result is confirmed by our computation of the Gini coefficients. As shown by the third part of table 7 indeed, the no-migration counterfactuals produce Gini coefficients that are slightly higher than the Gini for the observed income distribution with migration and remittances, even though differences are not statistically significant at the 5% level. This suggests that migration and remittances have an equalizing impact on income distribution. This result is in accordance with Acosta et al. [2007] who find that remittances reduce inequality in Haiti, Guatemala, Nicaragua and Peru.
8 Lachaud’s estimated changes are nevertheless much higher on average (+39% in urban areas and +17% in rural areas). This might be due to his adoption of Barham and Boucher’s methodology.
Table 7: Inequality impact of remittances Observed Counterfactual 1 “naïve” Counterfactual 2 Barham and Boucher Counterfactual 3 Barham and Boucher “modified” Consumption per capita (1,000 FCFA)
Mean 174 162 163 [161 – 164] 175 [172 – 180] Quintile Q1 66 63 62 [60 – 63] 61 [60 – 63] Q2 109 104 103 [103 – 104] 104 [103 – 105] Q3 151 141 144 [143 – 146] 147 [145 – 148] Q4 214 200 206 [204 – 209] 212 [210 – 214] Q5 446 407 421 [417 – 428] 462 [452 – 486] Variation (%) National mean -6,9% -6,3% 0,6% Q1 -4,5% -6,1% -7,6% Q2 -4,6% -5,5% -4,6% Q3 -6,6% -4,6% -2,6% Q4 -6,5% -3,7% -0,9% Q5 -8,7% -5,6% 3,6% Gini index National 37.6 [36.2 – 41.0] 38.1 [36.1 – 40.8] 37.8 [37.4 – 38.2] 39.3 [38.5 – 40.5] Urban 33.9 [30.9 – 39.8] 34.4 [31.3 – 38.4] 33.4 [32.9 – 34.0] 36.2 [35.3 – 37.7] Rural 33.5 [31.1 – 36.1] 34.2 [32.5 – 36.6] 34.0 [33.4 – 34.5] 36.3 [35.3 – 37.7] 4.3 Limits
Our results may suffer from several limits that are now briefly discussed.
First, our counterfactual imputed income for remittances-recipient households could be underestimated if those households proved to be much more productive than others. Econometrically, it means that the coefficients , and that we imputed to remittances-recipient households in the no-remittance scenario are too small, even after controlling for a selection on unobservables. As suggested by the estimated coefficients of the income equations (Tables 3 and 4), there is actually some evidence of significant differences in factor productivity between migrant and non-migrant households. So in the counterfactual scenarii 2 and 3, while these households are supposed to lose at most the current share of remittances in their income, since additional members should bring additional revenues, they might be losing more by being imputed wrong coefficients. This intuition is confirmed when looking at the average amount of factors of production of household receiving remittances versus others, in Table 3. The formers have better endowments, implying that they make a more productive use of their endowments. However, we cannot exclude the possibility that what we considered as self-selection into migration is in fact a consequence of migration. In other words, households
receiving remittances are more productive because they have been receiving remittances for several years, therefore have been able to invest in physical and human capital, raising both their wealth and productivity above that of other households. In this case, our selection model is not exactly the good one, but it does not mean that migrants are randomly selected either, just that our selection effect includes characteristics that are consequences and not causes of migration.
Second, we have made various assumptions on remitters to build the counterfactual. However, it is not clear-cut whether we should count one, two or more remitters per household, and whether we should only take remitters into account in the counterfactual instead of the whole migrant population. As a matter of fact, families know that the probability of receiving remittances when sending a member abroad is not one, and this must be part of their migration decision. Following this line of reasoning, it would make sense to consider the 1.2 million Malian emigrants in order to build a more realistic counterfactual. Unfortunately, the way we should allocate them between households is hard to tell.
Third, while we only considered selection in the migration choice, it is likely that labour force participants are non-randomly selected as well. If this were indeed the case, this would require the inclusion of two selection criteria in our specification as in Barham and Boucher [1998]: the migration choice and the labour force decision. The presence or absence of one or two adult males in a household is indeed likely to affect the labour force participation decision of other members, especially women. The functioning of the Malian labour market and the nature of the information contained in the survey make it impossible, however, to have a correct measure of labour force decision, which is why we leave it aside.
Last, another issue is the validity of building such a counterfactual instead of a general equilibrium model. The higher the number of migrants imputed to households, the more heroic the “everything else equal” assumption, as increasing artificially a country's population by 2.5% to 10% ought to have big effects on the labour market, education and returns to education, total demand and supply, imports and credit. In this perspective, we should simulate a whole economy, or include by a loop the general equilibrium effects of a microeconomic change, as in Heckman, Lochner and Taber [1998]. This however could not be done with our data set.
5 Conclusion
Running a standard Heckman two-step estimation to control for selection on both observable and unobservable characteristics of remittances-recipient households in Mali, we have computed a counterfactual income for these households, in a scenario under which migrants had not migrated and would be still living with their families, earning their living and consuming within the household. Since we have very little information on migrants, we have assumed that there was one migrant with primary level of education per household. This assumption is a conservative one, so that our results are likely to be lower-bond estimates.
Our results show that remittances significantly decrease the number of poor in Mali, especially in regions where the dependence on remittance income is the highest such as in the Mopti region. They also show that inequality is reduced thanks to migrants’ transfers. However, the poverty and inequality impact of remittances depends on the assumptions we made to compute our counterfactual scenario. In particular, the estimated impact is bigger when we adopt Bahram and Boucher’s methodology than when we make use of all the information contained
in the residuals. In this latter case, we find that migration and remittances are not always beneficial, particularly for households belonging to the upper quintile.
Of course, these are static results, restricted to remittances. We do not take into account the fact that some migrants may remit more in the medium run, when their skills improve in the host country, and their wages with them. We do not account either for the human capital accumulation that could be beneficial to Mali if the migrants decided to return.
Policy implications are twofold. First, fast and secure money transfers from migrants should be facilitated, in order to increase remittances to Sub-Saharan Africa to levels comparable to Latin America or South Asia. Second, in order to address Mali's high level of poverty, government and development agencies should take steps to target social transfers and development projects to areas where emigration and remittances from abroad are less prevalent. Yet, the sensitivity of the poverty and inequality outcomes to the choice of method calls for further research. To this end, specific database are required, namely panel database, following both households and migrants over the years, with all the needed characteristics on migrants: age, sex, marital status, education, work experience, former and current wages, country(ies) of destination, intent to return, etc. As a "second-best optimum", cross-sectional household surveys should at least include a detailed migration module recording both past and current migrations.
References
ACOSTA P., CALDERON C., FAJNZYLBER P., LOPEZ H. [2007], « What is the Impact of
International Remittances on Poverty and Inequality in Latin America », World Development, 36(1), pp.89-114
ADAMS R. H. Jr. [1989], « Worker Remittances and Inequality in Rural Egypt », Economic
Development and Cultural Change, 38(1), pp. 45-71.
ADAMS R. H. Jr. [2006] « Remittances and Poverty in Ghana », World Bank Policy Research Working Paper 3838, February.
ADAMS R. H. Jr., PAGE J. [2003], « International Migration, Remittances and Poverty in Developing Countries », Working paper n° 3179, World Bank, December.
ADAMS R. H. Jr., CUECUECHA A., PAGE J. [2008], « Remittances, Consumption and Investment
in Ghana », Policy Research Working Paper n° 4515, 47 p.
AMUEDO-DORANTES C.,POZO S., [2004], « Workers' Remittances and the Real Exchange Rate:
A Paradox of Gifts », World Development, 32(8), pp.1407-1417.
AZAM J.-P., GUBERT F. [2005], « Those in Kayes. The Impact of Remittances on Their
Recipients in Africa », Revue Economique, 56, pp. 1331-1358.
BARHAM B., BOUCHER S. [1998], « Migration, remittances, and inequality: estimating the net
effects of migration on income distribution », Journal of Development Economics, 55(2), pp. 307-331.
BOLLARD A., MCKENZIE D., MORTEN M., RAPOPORT H. [2009], “ Remittances and the Brain
presented to the 2nd International Conference on Migration and Development, Washington DC, September 10-11, 2009.
BOURDET Y, FALCK H. [2006] « Emigrants Remittances and Dutch Disease in Cape Verde »,
International Economic Journal, 20(3), pp.267-284.
CLARKE G.R.G., WALLSTEN S. [2003], « Do Remittances Act Like Insurance? Evidence From a Natural Disaster in Jamaica », mimeo.
DEATON, A. [1997], The Analysis of Household Surveys: A Microeconometric Approach to
Development Policy, Johns Hopkins University Press, World Bank, August.
DELARUE J., MESPLE-SOMPS S., NAUDET J-D., ROBILLIARD A-S. [2008], « The Sikasso
Paradox : Does Cotton Reduce Poverty ? », paper presented at PEGnet conference 2008 « Assessing Development Impact - Learning from Experience », Accra (Ghana), 11-12 september 2008.
DURAND J., PARRADO E. A., MASSEY D. S. [1996], « Migradollars and Development: A
Reconsideration of the Mexican Case », International Migration Review, 30(2), pp. 423-444. FAINI R. [2007] « Remittances and the Brain Drain: Do more skilled migrants remit more? »,
World Bank Economic Review, 21(2): 177-91.
FREUND C., SPATAFORA N. [2005], « Remittances: transaction costs, determinants, and
informal flows », Policy Research Working Paper Series 3704, The World Bank.
GUBERT F. [2000], « Migration et gestion collective des risques. L’exemple de la région de Kayes (Mali) », Thèse de Doctorat, Université Clermont-Ferrand I, CERDI.
GUBERT F. [2002], « Do Migrants Insure Those Who Stay Behind? Evidence from Kayes Area
(Western Mali) », Oxford Development Studies, 30(3).
HECKMAN J. [1979] « Sample Selection Bias as a Specification Error », Econometrica 47.
HECKMAN J., LOCHNER L., TABER C. [1998], « General-Equilibrium Treatment Effects: A
Study of Tuition Policy », American Economic Review, 88(2), pp.381-86.
LACHAUD J-P. [1999], « Envoi de fonds, inégalité et pauvreté au Burkina Faso », Documents de
travail 40, Centre d'Economie du Développement de l'Université Montesquieu Bordeaux IV. LOPEZ H., MOLINA L., BUSSOLO M. [2007], « Remittances and the real exchange rate », World
Bank Policy Research Working Paper 4213.
KATSELI L. T., LUCAS R.E.B., XENOGIANI T. [2006], « Effects of migration on sending countries: what do we know? », OECD Working Paper No. 250.
MISHRA P. [2005], « Macroeconomic Impact of Remittances in the Caribbean », Unpublished


![Table 6: Poverty impact of remittances Observed Counterfactual 1 “naïve” Counterfactual 2 Barham and Boucher Counterfactual 3 Barham and Boucher “modified” Poverty rate (%) National 46.4 [43.6 - 49.3] 51.4 [48.7 – 54.1] 51.2 [50.4 – 51.8]](https://thumb-eu.123doks.com/thumbv2/123doknet/12914233.372756/21.892.92.791.108.773/poverty-remittances-observed-counterfactual-counterfactual-boucher-counterfactual-national.webp)

