HAL Id: hal-02814504
https://hal.inrae.fr/hal-02814504
Submitted on 6 Jun 2020HAL is a multi-disciplinary open access archive for the deposit and dissemination of sci-entific research documents, whether they are pub-lished or not. The documents may come from teaching and research institutions in France or abroad, or from public or private research centers.
L’archive ouverte pluridisciplinaire HAL, est destinée au dépôt et à la diffusion de documents scientifiques de niveau recherche, publiés ou non, émanant des établissements d’enseignement et de recherche français ou étrangers, des laboratoires publics ou privés.
Description of agricultural land market functioning in
partner countries
Laure Latruffe, Chantal Le Mouël
To cite this version:
Laure Latruffe, Chantal Le Mouël. Description of agricultural land market functioning in partner countries. [Contract] 2006. �hal-02814504�
Description of agricultural land market functioning in partner countries
Laure LATRUFFE and Chantal LE MOUEL
Partner 6
INRA-ESR, RENNES FRANCE
Deliverable 9 of the IDEMA project. The research is supported by the European Community’s Sixth Framework Programme (SSPE-CT-2003-502171).
Description of agricultural land market functioning in partner countries
Acknowledgements
This deliverable has been made possible with the help of the partner countries, in particular: - Tomáš Doucha, Ladislav Jelínek, Tomaš Medonos, Václav Voltr and Eliška Vrbová in
VUZE;
- Kathrin Happe and Hauke Schnicke in IAMO;
- Oliver Balkhausen and Christoph Steinmeier in Göttingen University; - Roberto Esposti and Antonnello Lobianco in UNIAN;
- Agne Ciapaite and Egle Stonkute in LAEI;
- Katarína Bradáčová and Štefan Buday in VUEPP; - Sone Ekman and Malin Pettersson in SLI;
1. Introduction ... 5
2. Agricultural structure... 5
2.1. Current agricultural structure ... 6
a) Agriculture in the economy... 6
b) Land use ... 6 c) Agricultural production... 8 d) Farm structures... 11 e) Subsistence farming ... 16 f) Performances ... 16 g) Summary ... 17
2.2. Evolution of the agricultural structure in the past decade... 18
a) Agriculture in the economy... 18
b) Land use ... 21
c) Agricultural production... 24
d) Farm structures... 24
e) Performances... 27
f) Summary... 27
3. Agricultural land market environment: Institutional and legal aspects... 28
3.1. Definition and administration of property rights... 29
a) Land registration and cadastre ... 29
b) Land valuation ... 30
c) Current state of land restitution in the 3 new Member States ... 34
3.2. Other key elements of the institutional and legal structures ... 40
a) Inheritance legal rules ... 40
b) Pre-emptive rights... 44
c) Legal restrictions on land ownership ... 47
d) Legal restrictions on agricultural land use ... 47
e) Characteristics of agricultural land rental contracts... 50
f) The role of the SAFERs in France... 53
4. Land market activity... 54
4.1. Agricultural land sale market ... 54
a) Current situation... 54
b) Evolution... 60
4.2. Agricultural land rental market ... 64
a) Current situation... 64
b) Evolution... 68
4.3. Non-agricultural land market ... 69
4.4. Summary ... 69
5. Potential imperfections on factor markets... 71
5.1. Land markets ... 71
5.3. Credit markets ... 77
5.4. Summary ... 83
6. Conclusion... 84
References ... 86
Appendix 1: Detailed statistics about Section 2 “Agricultural structure”... 87
Appendix 2: Detailed statistics about Section 4 “Land market activity”... 91
Appendix 3: Detailed statistics about Section 5 “Potential imperfections on factor markets ”... 131
1. Introduction
As part of the IDEMA project, workpackage 8 (Land market in current and new Member States) is aimed at drawing a land market review to support modelling work carried out in workpackage 4 (AgriPoliS model improvement and adaptation to regional characteristics) and workpackage 9 (Improvements of existing ESIM sectoral model and country specific GE models).
Workpackage 8 includes two steps: i) a land market review whose aim is to assess broadly the way land markets are operating and allow the confirmation or rejection of basic assumptions of regional as well as sectoral and general equilibrium models; this was provided by the deliverable D02: “Agricultural land markets: main issues in the recent literature”; ii) a compilation of land market information (legal aspects and basic statistics) for the involved partner countries which will serve as an empirical background for the modelling work (specification and calibration) carried out in workpackages 4 and 9; this is the object of the present deliverable D09.
A questionnaire was sent to each partner, regarding several areas: agricultural structure, institutional and legal aspects, agricultural land market activity, overview and extent of factor market imperfections. In each area the information requested involved general qualitative information and specific quantitative data. This deliverable consists in the compilation of all information, qualitative and quantitative, provided by the partners. There are 8 countries concerned, including in the European Union (EU)-15, France, Germany, Italy, Sweden and the United Kingdom (UK), and 3 New Member States (NMS), the Czech Republic, Lithuania and Slovakia. The deliverable is structured as follows. Section 2 describes the agricultural structure in each country, currently and its evolution. In Section 3 information relating to institutional and legal aspects is provided. Section 4 consists in statistics regarding land market activity, presently and over the past decade. Factor market imperfections in each country are summarised in Section 5. Finally Section 6 concludes.
2. Agricultural structure
An overview of the evolution of the agricultural structure in each country is necessary to give some background information. Firstly the current structure is reviewed (figures from
2003 with few exceptions that are mentioned), then the evolution over the past decade (1993-2003) is described.
2.1. Current agricultural structure
a) Agriculture in the economy
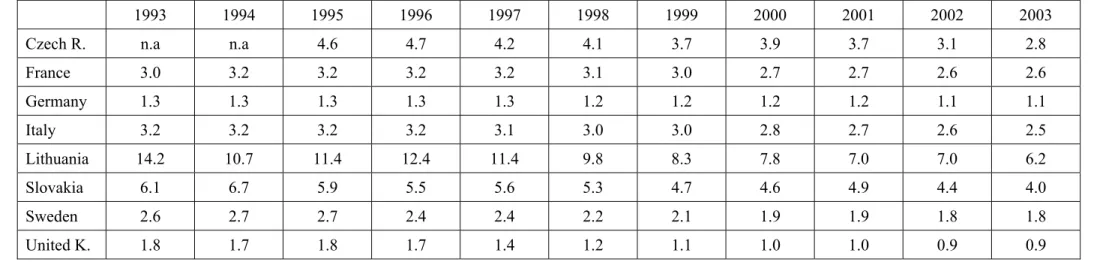
Table 1 shows the importance of agriculture in each partner country in 2003, in terms of its contribution to the Gross Domestic Product (GDP), to the total employment and to the total area. Lithuania and Slovakia are the two countries where the share of agriculture in the GDP is still relatively high, respectively 6.2 and 4 percent. By contrast, the UK and Germany present the lowest shares, respectively 0.9 and 1.1 percent. The same countries are at the extremity of the ranking when it comes to farm labour: 17.8 percent of the total employment is on farms in Lithuania while the figure is 0.9 percent for the UK; the other countries presenting figures between 2 and 5 percent. The share of utilised agricultural area (UAA) in the total area is similar for all countries (between 40 percent for Lithuania and 64 percent for the UK) except for Sweden where the figure is less than 8 percent.
Table 1: Agriculture in the economy in 2003 in all countries
Share of agriculture in GDP (%)
Share of farm labour in total employment (%) Share of UAA in total area (%) Czech Republic 2.8 4.5 47.5 France 2.6 4.1 54.5 Germany 1.1 2.4 48.7 Italy 2.5 4.4 51.1 Lithuania 6.2 17.8 40.4 Slovakia 4.0 4.4 46.5 Sweden 1.8 2.3 7.6 United Kingdom 0.9 0.9 66.9 Source: Eurostat b) Land use
Table 2 presents the total area of each country in 2003, and the distribution in terms of land use. As mentioned earlier, with the exception of Sweden, whose UAA accounts for less than 8
percent of the total area, all countries have an UAA between 40 (Lithuania) and 64 (UK) percent of their total area. In opposite, Sweden presents the largest share of area used for forest activities (54 percent).
Table 2: Land use in 2003 in all countries
Total area (ths ha) UAA in total area (%)
Forest area in total area (%)
Other uses of total area (%) Czech Republic 7,886.5 47.5 34.1 10.5 France 54,908.7 54.5 28.4 17.1 Germany 35,703.1 48.7 30.9 20.4 Italy 30,133.6 51.1 34.9 13.9 Lithuania 6,530.0 40.4 32.0 27.6 Slovakia 4,903.4 46.5 41.6 11.9 Sweden 4,509.5 7.6 54.4 38.0 United Kingdom 24,410.1 66.0 10.3 22.8 Source: Eurostat.
Note: Forest area in 2000 in Germany, in 1998 in the UK.
Table 3 details the use of land for agricultural activities in 2003. The UK is the only country where the share of UAA devoted to permanent pasture exceeded the share devoted to cereal, oilseed and protein crops (COP) (61 against 24 percent of the UAA). This reflects the numerous extensive livestock farms in Scotland and Wales. Italy and Lithuania had equal shares for both activities, while the other countries presented a larger share of UAA devoted to COP.
Vegetables, vineyard and fruits, and flowers and plants are only marginal activities in terms of land use, except in Italy where vineyard and fruits (in particular olive trees) account for 17.6 percent of the UAA. The largest share of set-aside area is found in Sweden (9 percent of the UAA) and the smallest in Slovakia (0.2 percent).
There is a clear relationship between the quality of the land, the use it is devoted to, the potential return from this land and its value and market price. Hence, the structure of agricultural land use may provide some indications as regards the price of agricultural land in
each partner country.1 For instance, the higher share of UAA devoted to vineyard and fruits in Italy (and to a much lesser extent in France) is likely to raise the average price of agricultural land in this country. At reverse, the higher share of set-aside land in Sweden suggests that returns from farming are probably rather low on a significant share of agricultural land in this country, which is likely to contribute to reduce the Swedish average price of agricultural land.
c) Agricultural production
The agricultural production structure in the countries in 2003 is presented in Table 4, in particular the share of each output in the total agricultural production value. Crop output clearly accounts for the main part of the value of agricultural production in France, Italy and Lithuania, while livestock output is prevailing in the value of agricultural production in Slovakia and the UK. The other countries present similar contributions from crop and livestock outputs.
Within the crop outputs, cereals are the main contributors to the production value for all countries, except for Italy where vegetables, horticulture, vineyard and fruits are prevailing. Vineyard and fruits in France, and vegetables and horticulture in Lithuania and in the UK, contribute equally with cereals. As regard to the share of specific livestock outputs to the agricultural production value, there are three groups of countries: 1) the Czech Republic, Germany, Lithuania and Sweden mainly produce dairy outputs in terms of value; 2) France, Italy and the UK mainly produce dairy and beef outputs; 3) Slovakia also presents a large share of dairy outputs, but as well as outputs from pork production.
1 Obviously, the use of the land is only one factor amongst many others that may have an influence on land price.
Hence, the structure of agricultural land use can provide only rough indications on the compared levels of average prices of agricultural land in partner countries.
Table 3: Agricultural land use in 2003 in all countries
Land area devoted to (%): Czech R. France Germany Italy Lithuania Slovakia Sweden United K.
COP (including:) * Cereals Oilseeds Protein crops 52.1 39.7 11.5 0.9 38.1 30.3 6.3 1.6 49.2 40.2 7.8 1.2 30.0 27.5 2.0 0.4 37.8 34.2 2.8 0.8 46.1 35.8 9.5 0.7 39.6 36.6 2.0 0.9 24.0 19.0 3.6 1.5 Forage (including:) Maize forage Other forage crops Temporary pasture 14.0 5.8 2.2 6.0 15.7 5.4 1.5 8.9 9.3 6.9 1.3 1.1 13.4 1.9 5.5 6.0 8.4 0.5 5.5 2.4 11.7 4.4 5.6 1.7 30.8 0.1 1.2 29.5** 8.2 0.7 0.0 7.5 Permanent pasture 23.8 33.7 29.2 29.0 38.4 35.5 15.5 60.6 Vegetables (including:) Potatoes Other 1.3 1.0 0.3 1.3 0.5 0.8 2.4 1.7 0.7 3.5 0.5 3.0 4.1 3.3 0.8 1.8 1.1 0.7 1.6 1.0 0.6 1.7 0.9 0.8 Vineyard and fruit (including:)
Vineyard Fruit 0.9 0.3 0.6 3.7 2.9 0.8 1.2 0.6 0.6 17.6 5.7 11.9 1.3 0.0 1.3 1.3 0.6 0.8 0.1 0.0 0.1 0.2 0.0 0.2
Flowers and plants 0.03 0.07 0.04 0.06 0.01 0.01 0.02 0.09
Set-aside 4.8 4.5 5.5 4.2 6.1 0.2 8.8 3.9
Source: Eurostat.
Table 4: Agricultural production structure in 2003 in all countries
Czech R. France Germany Italy Lithuania Slovakia Sweden United K.
Total value of agricultural production (millions euros)
2,877.5 62,446.3 40,211.8 43,028.4 1,197.8 1,492.2 4,553.1 22,751.7 Share of crop output (%) (including:)
Cereals
Industrials crops Forage crops
Vegetables and horticulture Vineyard and fruits
Other 47.9 20.5 11.5 5.7 7.2 2.6 0.3 57.2 15.4 6.1 8.6 11.7 14.8 0.5 49.6 17.3 6.6 8.6 11.6 4.9 0.7 63.5 10.1 2.5 4.2 20.2 24.7 1.2 58.3 20.7 6.6 9.7 19.0 0.4 1.9 42.2 17.5 7.5 3.4 9.3 3.3 1.3 46.5 18.1 4.2 12.7 10.6 0.9 0.2 39.5 14.8 6.8 1.1 14.8 1.8 0.2 Share of livestock output (%) (including:)
Bovine Milk and dairy Pork
Poultry and eggs Other 50.6 5.4 21.1 14.5 9.4 0.2 38.1 13.0 12.1 4.3 6.1 2.6 46.9 7.9 20.6 12.2 4.5 1.7 33.3 8.6 10.0 5.6 6.2 2.9 40.9 3.7 17.9 10.2 6.8 2.2 53.5 7.5 16.2 15.4 10.3 4.1 50.8 10.8 23.9 7.9 4.5 3.7 56.4 16.8 16.3 4.3 10.4 8.6 Source: Eurostat
d) Farm structures
Farm structures are detailed in Tables 5 and 6. The total number of farms and general statistics for all farms in 2003 in all countries are presented in Table 5. Despite not being the country with the largest UAA in hectares, Italy has the greatest number of farms, more than three times the following country (France). Hence farms are on average very small in Italy, as confirmed by the average farm area (9.3 ha). This can be explained by the large part of vegetable and fruit farms in this country. The largest farms on average are found in the Czech Republic (114 ha), due to the existence of very large corporate farms (see later). The smallest farms on average are in Italy and Lithuania. For the majority of countries there is no big difference between the average total farm area and the average UAA. The exception is Sweden, where half of the total area of the farms on average is used for other activities than agriculture (mainly forest).
The statistics about labour use show that farms in Italy, Lithuania and the UK use the least labour on average, while farms in the Czech Republic use the most. However, this statistic might capture the average farm size. When labour use is measured per hectare of land, labour use is equivalent in all countries except for Italy which presents the greatest use. Vine and fruit productions are indeed relatively labour intensive activities.
Table 6 gives further details about the farm structure for individual farms and other legal forms. In all countries individual farms are the prevailing form. The share of these farms in the total farm number is greater than 92 percent for all countries, except in France where it is much less (78 percent). A large number of farms in France are partnerships.
However, despite their predominance in the number of farms, individual farms do not farm the majority of land, as the other farms have a much larger average UAA, in particular in the Czech Republic and Slovakia (930 and 1,100 ha).
Table 5: Number of farms and average statistics for all farms in 2003 in all countries Number of farms Total farm area (ha) Average UAA (ha) Average labour per farm (AWU/year) Average labour per ha (AWU/year) Czech Rep. 45,770 113.8 79.3 3.6 0.046 France 614,000 48.2 45.3 1.5 0.033 Germany 412,300 45.7 41.2 1.7 0.041 Italy 1,963,820 9.3 6.7 0.8 0.113 Lithuania 272,110 10.4 9.2 0.8 0.089 Slovakia 71,740 47.9 29.8 1.6 0.055 Sweden 67,890 99.6 46.1 1.0 0.023 United K. 280,630 60.3 57.4 1.3 0.022 Source: Eurostat
Table 6: Share of farms and average area for individual farms and other forms in 2003
Share in number of all farms (%)
Average total farm area (ha)
Average UAA (ha) Czech Rep. Individual farms
Other forms 93.9 6.1 26.1 1,461.2 24.0 931.5 France Individual farms
Other forms 78.3 21.7 33.6 101.0 31.0 96.9 Germany Individual farms
Other forms 94.3 5.7 34.2 234.6 30.1 223.2 Italy Individual farms
Other forms 99.3 0.7 7.4 285.8 5.9 113.4 Lithuania Individual farms
Other forms 99.8 0.2 9.3 497.5 8.1 468.4 Slovakia Individual farms
Other forms 97.7 2.3 4.7 1,870.8 4.5 1,098.2 Sweden Individual farms
Other forms 92.7 7.3 91.9 215.7 40.5 116.8 United K. Individual farms
Other forms 96.4 3.6 55.2 234.2 52.7 217.3 Source: Eurostat
Graphs 1 to 8 show the farm distribution for each country in 2003, according to several size intervals. Exact figures are given in Table A4 in Appendix. In all countries the majority of farms are larger than 100 ha. However, in France, Germany, Sweden and the UK a large share of farms are also within the interval 50-100 ha. In Italy and Lithuania farms are relatively spread between all intervals. But in Slovakia and the Czech Republic very few farms are in the intervals less than 100 ha. In all countries, while individual farms appear in every intervals, other legal forms are present mainly (or almost exclusively for the NMS) in the largest interval.
Graph 1: Distribution of farms according to their UAA in 2003 in the Czech Republic 0 10 20 30 40 50 60 70 80 90 100 1-2 ha 2-5 ha 5-10 ha 10-20 ha 20-30 ha 30-50 ha 50-100 ha > 100 ha UAA intervals Share (%) all farms individual farms other forms
Graph 2: Distribution of farms according to their UAA in 2003 in France
0 10 20 30 40 50 60 70 80 90 100 1-2 ha 2-5 ha 5-10 ha 10-20 ha 20-30 ha 30-50 ha 50-100 ha > 100 ha UAA intervals Share (%) all farms individual farms other forms
Graph 3: Distribution of farms according to their UAA in 2003 in Germany
0 10 20 30 40 50 60 70 80 90 100 1-2 ha 2-5 ha 5-10 ha 10-20 ha 20-30 ha 30-50 ha 50-100 ha > 100 ha UAA intervals Share (%) all farms individual farms other forms
Graph 4: Distribution of farms according to their UAA in 2003 in Italy
0 10 20 30 40 50 60 70 80 90 100 1-2 ha 2-5 ha 5-10 ha 10-20 ha 20-30 ha 30-50 ha 50-100 ha > 100 ha UAA intervals Share (%) all farms individual farms other forms
Graph 5: Distribution of farms according to their UAA in 2003 in Lithuania 0 10 20 30 40 50 60 70 80 90 100 1-2 ha 2-5 ha 5-10 ha 10-20 ha 20-30 ha 30-50 ha 50-100 ha > 100 ha UAA intervals Share (%) all farms individual farms other forms
Graph 6: Distribution of farms according to their UAA in 2003 in Slovakia
0 10 20 30 40 50 60 70 80 90 100 1-2 ha 2-5 ha 5-10 ha 10-20 ha 20-30 ha 30-50 ha 50-100 ha > 100 ha UAA intervals Share (%) all farms individual farms other forms
Graph 7: Distribution of farms according to their UAA in 2003 in Sweden
0 10 20 30 40 50 60 70 80 90 100 1-2 ha 2-5 ha 5-10 ha 10-20 ha 20-30 ha 30-50 ha 50-100 ha > 100 ha UAA intervals Share (%) all farms individual farms other forms
Graph 8: Distribution of farms according to their UAA in 2003 in the United Kingdom
0 10 20 30 40 50 60 70 80 90 100 1-2 ha 2-5 ha 5-10 ha 10-20 ha 20-30 ha 30-50 ha 50-100 ha > 100 ha UAA intervals Share (%) all farms individual farms other forms
e) Subsistence farming
Subsistence farming is a concept widely applied to transitional countries, where lots of farms produce mainly for their own needs.
In 2000, in the Czech Republic, among the 53,500 individual farms there were 18,000 farms (33.6%) identified as semi-subsistence farms by the Agrocensus. Households in this country are classified as semi-subsistence farms if they are not registered as professional farms, they have at least 1 ha of agricultural land and they meet at least one of the following criteria: at least 0.15 ha of intensive crops (vineyard, intensive orchard, field vegetables, horticulture), or at least 0.03 ha of greenhouses, or at least 1 head of beef cattle, or at least 2 heads of pigs, or at least 4 heads of sheep or goats, or at least 50 heads of poultry, or at least 100 heads of rabbits or fur animals.
Statistics Lithuania numbered 96,613 subsistence farms in 2003 in this country, that is to say 34.4% of the farms. Farms are classified as subsistence if they have at least 1 ha of agricultural land and produce only for their own consumption. Such farms are accounted for in figures reported in Tables 5 and 6.
In Slovakia the 2003 Farm Structural Survey identified 63,528 subsistence farms. The number in 2001 was almost similar. This amounts to 88.6% of the 71,737 Slovak farms. Farms are categorised as subsistence if they have the minimum size of operations for being considered as a farm, but are not officially registered as such. These subsistence farms are accounted for in the Eurostat figures used in Tables 5 and 6, as these figures come from the Structural Survey on the whole population. When the subsistence farms are not taken into account, the number of individual (commercial) farms is 6,550 and their average UAA is 42 ha, which makes the average UAA of all commercial farms (individual and corporate) 272 ha (Slovak Statistical Office, Green Report).
f) Performances
As shown by Table 7 in terms of cereal and wheat yields France, Germany and, higher than all them, the UK recorded the best performance in 2003. These countries were also among the best performers in terms of milk yield, but far behind Sweden. Countries were quite close in terms of beef and pork slaughter weights, with the exception of Lithuania exhibiting a very low slaughter weight for beef and Italy where the slaughter weight for pork is much higher
than in other countries. 2 As for chicken yield, France seems to be the best performer but for many countries data are unavailable. Overall France and the UK seem to be the best performers and Lithuania the worst.
Table 7: Farm performances in 2003; averages in all countries
Crop yield (tonne/ha)
Milk yield (kg/cow/year)
Meat slaughter weight (kg/head)
All cereals Wheat Milk Beef Pork Poultry
Czech Rep. 3.9 4.1 5,781.1 289.2 * 94.0 n.a.
France 6.1 6.2 6,064.7 308.9 88.1 1.91 Germany 5.8 6.5 6,578.2 267.7 93.4 n.a. Italy 4.3 2.7 5,619.5 286.2 117.0 1.65 Lithuania 3.0 3.6 3,991.7 130.8 72.0 1.60 Slovakia 3.1 3.0 5,180.3 251.9 95.0 n.a. Sweden 4.7 5.6 8,058.0 289.0 87.0 1.35 United K. 7.0 7.7 6,194.2 * 307.6 76.4 n.a. Source: Eurostat. n.a.: not available. *: figure from 2000
g) Summary
The Czech Republic is mainly characterised by the existence of very large (corporate) farms, which rent most of their land. The country produces crop and livestock output nearly in the same proportion. Among livestock production, dairy outputs account for the largest share. France counts a large proportion of partnership farms. The main production is crop. French farmers are among the best performers of the eight countries, in terms of crop and meat yields.
Germany has one of the lowest contributions of agriculture to GDP. The country produces mainly livestock output, and particularly dairy outputs. German farmers have a good crop performance.
Italy presents a very large number of very small individual farms, labour intensive, producing vine and fruits.
2 Average meat slaughter weights are poor indicators of performances since they may even well reveal
differences in habits or traditions characterising the various countries (e.g., the length of chicken fattening may be different from one country to another leading to different average slaughter weights). Growth or feed conversion indices would have been much better indicators. Unfortunately such indices were not available for most of partner countries.
Lithuania has the largest contribution of agriculture to GDP and total employment. Crop is the main production but performances in crop as well as livestock products are quite poor.
Slovakia also presents a large contribution of agriculture to GDP. The country counts very large (corporate) farms, producing mainly livestock outputs, in particular pork.
Sweden has the smallest UAA, with a large share of the country being used by forest. Dairy production using temporary pastures is predominant. Half of the farms’ area is used for non-agricultural activities. The country presents the larger share of UAA put into set-aside.
The UK has the lowest contribution of agriculture to GDP and total employment. Livestock output (dairy and beef) remains important in the total agricultural production value. These enterprises use a large area of permanent pasture. UK farms are among the best performers of the 8 countries.
2.2. Evolution of the agricultural structure in the past decade
The evolution of the agricultural structure is investigated from 1993, or more recently when full statistics are not available. Evolutions are presented on graphs to ease the understanding. Some detailed figures are given in Appendix.
a) Agriculture in the economy
As shown by Graph 9 (and Table A1 in Appendix), in the past decade the share of agriculture in GDP decreased slowly in EU-15 countries, while the decrease was more pronounced in the three NMS, in particular in Lithuania, whose share dropped from 14 to 6 percent. On Graph 10 the evolution of farm labour in total employment is pictured (based on Table A2 in Appendix). The observed trend of the evolution of farm labour in total employment is similar to the one of the share of agriculture in GDP: slightly decreasing for EU-15 countries and a more pronounced decrease for NMS, except for Lithuania where the available 4-year statistics do not allow to draw a conclusion.
Graph 11 (and Table A3 in Appendix) shows that the share of UAA in total area is relatively stable for all EU-15 countries, with a very slight continuous decrease. By contrast, the NMS experienced a major decline in the share in 2000 (-10 percent in the Czech Republic and Slovakia, -15 percent in Lithuania). This suggests that in all partner countries, some agricultural land is normally converted to non-agricultural uses. This conversion seems to be
rather limited in the old Member States, and could correspond to agricultural land acquired by the state or local authorities in the framework of development planning schemes or environmental protection planning schemes. Conversion of agricultural land to non-agricultural uses appears as relatively more important in the NMS, especially in recent years. This could indicate that legal restrictions on agricultural land use are less strict in the NMS so that it is easier for a land owner to convert his/her land to non-agricultural uses (cf. Section 3).3
3 However, one must be very cautious regarding this evolution of the share of UAA in NMS. The decrease in the
share of UAA can be observed only in recent years. Hence it is too early to conclude that this share is experiencing a decreasing trend. Furthermore this decrease could even result from changes in the way statistics are reported. For instance, the decrease observed in Slovakia between 2000 and 2001 could result from a change implemented by statistical offices in the way UAA is measured: until 2000, the Slovak UAA was measured on the basis of land registry sources while since 2001 UAA is measured on the basis of the general farm census. A similar situation with similar consequences can be advocated for the Czech Republic: before 2002 total agricultural land was measured on the basis of cadastral registers; since 2002, UAA is measured on the basis of LPIS (Land Parcel Identification System); this implies a significant change in the definition of the agricultural land area statistical series.
Sources: Eurostat
Graph 9: Evolution of the share of agriculture in GDP in all countries
0 2 4 6 8 10 12 14 16 1993 1994 1995 1996 1997 1998 1999 2000 2001 2002 2003 % Czech Republic France Germany Italy Lithuania Slovakia Sweden United Kingdom
Graph 10: Evolution of the share of farm labour in total employment in all countries
0 5 10 15 20 25 1993 1994 1995 1996 1997 1998 1999 2000 2001 2002 2003 % Czech Republic France Germany Italy Lithuania Slovakia Sweden United Kingdom
Graph 11: Evolution of the share of UAA in total area in all countries
0 10 20 30 40 50 60 70 1993 1994 1995 1996 1997 1998 1999 2000 2001 2002 2003 % Czech Republic France Germany Italy Lithuania Slovakia Sweden United Kingdom
b) Land use
Graphs 12 to 19 present the evolution of the shares of land used for COP, forage, permanent, pasture and set-aside for each country. Except for the UK where all land shares are pretty stable, all countries experienced an increase in the share of land used for COP. In Lithuania this increase was very sharp between 2000 and 2001, and contrasted with a dramatic decrease in the share used for forage at the same period. Although the positive trend is smooth in Germany over most of the period, it is broken in 1995 by a sudden drop, but the trend is back to normal as soon as 1996. This drop might be due to a decrease in sunflower/rapeseed area at this period, following a bad harvest year in 1994.
Graph 12: Evolution of agricultural land use in the Czech Republic 0 5 10 15 20 25 30 35 40 45 50 55 60 1993 1994 1995 1996 1997 1998 1999 2000 2001 2002 2003 shares in UAA (%) COP forage permanent pasture set-aside
Graph 13: Evolution of agricultural land use in France
0 5 10 15 20 25 30 35 40 45 1993 1994 1995 1996 1997 1998 1999 2000 2001 2002 2003 shares in UAA (%) COP forage permanent pasture set-aside
Graph 14: Evolution of agricultural land use in Germany
0 5 10 15 20 25 30 35 40 45 50 55 1993 1994 1995 1996 1997 1998 1999 2000 2001 2002 2003 shares in UAA (%) COP forage permanent pasture set-aside
Graph 15: Evolution of agricultural land use in Italy
0 5 10 15 20 25 30 35 1993 1994 1995 1996 1997 1998 1999 2000 2001 2002 2003 shares in UAA (%) COP forage permanent pasture set-aside
Graph 16: Evolution of agricultural land use in Lithuania 0 5 10 15 20 25 30 35 40 45 1993 1994 1995 1996 1997 1998 1999 2000 2001 2002 2003 shares in UAA (%) COP forage permanent pasture set-aside
Graph 17: Evolution of agricultural land use in Slovakia
0 5 10 15 20 25 30 35 40 45 50 1993 1994 1995 1996 1997 1998 1999 2000 2001 2002 2003 shares in UAA (%) COP forage permanent pasture set-aside
Graph 18: Evolution of agricultural land use in Sweden
0 5 10 15 20 25 30 35 40 45 50 1993 1994 1995 1996 1997 1998 1999 2000 2001 2002 2003 shares in UAA (%) COP forage permanent pasture set-aside
Graph 19: Evolution of agricultural land use in the United Kingdom
0 10 20 30 40 50 60 70 1993 1994 1995 1996 1997 1998 1999 2000 2001 2002 2003 shares in UAA (%) COP forage permanent pasture set-aside
c) Agricultural production
The shares of crop and livestock output in value of total agricultural output have been relatively stable in all countries over the past decade.
d) Farm structures
The evolution of the farm structures is presented only for the EU-15 countries. Too many changes in the definitions and the record of statistics have been made in the NMS to give a clear picture.
As shown by Graph 20 the number of farms has slightly decreased in France, Germany and Sweden, and sharply decreased in Italy from 1995. It has slightly increased in the UK, though this may in part be due to definitional changes in the UK statistics which took place in 2000 (up to this date minor holdings, i.e. less than 6 ha were excluded from the statistics, but included from this date onwards). Graph 21 shows that the share of individual farms in all farms has decreased in Germany and in Sweden (more slightly), and also particularly in France.
Graph 20: Evolution of the number of farms in all countries
0 500 000 1 000 000 1 500 000 2 000 000 2 500 000 1993 1995 1997 2000 2003 Czech Republic France Germany Italy Lithuania Slovakia Sweden United Kingdom
Graph 22 shows that France, Germany and Sweden experienced the same increasing trend in the average UAA per farm, while in Italy the average UAA has remained fairly stable and in the UK the average UAA has decreased. Comparing the legal forms reveals that from 1997 onwards, the average UAA of individual farms decreased in France and the UK, but increased in Germany and Sweden, while it was stable in Italy (Graph 23). As for the other legal type farms, their average UAA decreased in Germany, but remained stable in the other EU-15 countries (Graph 24).
Graph 21: Evolution of the share of individual farms in the total number of farms in all countries
75 80 85 90 95 100 1993 1995 1997 2000 2003 sh are ( % ) Czech Republic France Germany Italy Lithuania Slovakia Sweden United Kingdom
Graph 22: Evolution of the average UAA per farm in all countries 0 20 40 60 80 100 1993 1995 1997 2000 2003
average UAA (ha)
Czech Republic France Germany Italy Lithuania Slovakia Sweden United Kingdom
Graph 23: Evolution of the average UAA per individual farm in all countries
0 10 20 30 40 50 60 70 80 1993 1995 1997 2000 2003
average UAA (ha)
Czech Republic France Germany Italy Lithuania Slovakia Sweden United Kingdom
Graph 24: Evolution of the average UAA per farm with other legal form in all countries
0 100 200 300 400 500 600 700 800 900 1 000 1 100 1 200 1993 1995 1997 2000 2003
average UAA (ha)
Czech Republic France Germany Italy Lithuania Slovakia Sweden United Kingdom
Overall, Graphs 20 to 22 indicate that farm structures are evolving similarly in France, Germany and Sweden: the number of farms is decreasing continuously while the average UAA size of remaining farms is normally raising; the proportion of individual farms in the total number of farms is decreasing (this last trend is particularly important in France where the individual legal form is increasingly loosing importance to the benefit of partnership forms. This evolution may be related to the increasing share of rented land in the French agricultural sector, cf. Section 4). The same Graphs suggest reverse trends in the UK, with a slightly increasing number of farms, a decreasing average UAA size and a raising share of individual farms. The situation in Italy is specific and somewhat surprising: while the number of farms has decreased sharply over the last decade, the average UAA size of farms has remained fairly stable during the same period.
e) Performances
In all countries crop yields have remained relatively stable (despite yearly fluctuations) and milk yields have increased. As for meat slaughter weights, they are fairly stable in all countries, except for a peak in 2001 for poultry meat in France.
f) Summary
In all 8 countries the share of agriculture in GDP, of farm labour in total employment and of UAA in total area have decreased over the past decade. The observed decrease was slight in EU-15 countries and more pronounced in NMS.
In all 8 countries, the land used for COP production has increased over the past decade.
Farm structures have evolved similarly in France, Germany and Sweden: the number of farms has decreased continuously while the average UAA size of farms has risen; the proportion of individual farms in the total number of farms has decreased.
The UK has experienced reverse trends over the past decade: a slightly increasing number of farms, a decreasing average UAA size and a raising share of individual farms, though this may in part be due to some definitional changes which were introduced in this country in 2000.
3. Agricultural land market environment: Institutional and legal aspects
The objective of this section is to describe the institutional and legal framework within which agricultural land markets operate in the partner countries. Entering into the details of national laws and provisions regarding all aspects of agricultural land ownership, management, transmission and transaction in all countries was not possible practically and out of the scope of workpackage 8. Hence it was decided to focus this part of the questionnaire sent to partners on the institutional and legal elements that are recognised as key factors regarding the functioning of land sale and lease markets.
In the following, we split these key institutional and legal elements into two broad categories. Agricultural land markets operate through participants trading (selling/renting out or buying/renting in) plots of land. The first category of institutional and legal elements involves those which are necessary for such market operations to take place while the second category relates to those which may impact the number of transactions or the level of activity on agricultural land markets.
Regarding the first category, it is widely recognised that a necessary condition for functioning land markets is that property rights are clearly defined, guaranteed and soundly administrated (e.g., Dale and Baldwin, 2000). Definition and administration of land property rights directly refers to land registration and cadastre on the one hand and land valuation on the other hand. Hence, the first paragraph synthesises information provided by partners regarding both these aspects.
The second category is more heterogeneous since it comprises all institutional and legal elements that potentially affect both the number of market participants and/or the incentives to trade (sell/rent out or buy/rent in) agricultural land in each country. This involves many factors among which, principally: inheritance legal rules, the existence of pre-emptive rights, the existence of legal restrictions on land ownership, the existence of legal restrictions on agricultural land use and the characteristics of agricultural land rental contracts.4 The second paragraph thus gives an overview of information gathered from partners regarding all these aspects.
4 Obviously, the availability of capital and credit is also an important factor as regards to the level of activity on
agricultural land markets. Hence, institutional and legal elements relating to credit (in particular mortgage legislation) could be considered as well in this second category. The same applies to the national systems of taxation and fees attached to agricultural land transactions. However, such elements may also be considered as sources of imperfections on, respectively, credit and land markets. Thus, these aspects are examined as part of
3.1. Definition and administration of property rights
A basic description of how the legal relationship between land plots and their owners is officially documented in partner countries is provided first. Then, the land valuation procedures in force in each country are detailed. Finally a special attention is paid to the current state of the land restitution process in the 3 considered NMS.
a) Land registration and cadastre
As shown by synthesis Table 8, all 8 partner countries have legally clearly defined and guaranteed property rights. All countries have implemented similar systems of official recording in order to support and manage property right titles. In the 8 countries cadastral maps have been established that provide field boundary data and, most often, information on the quality or use of land (e.g., land class or land “administrative values”), which are used as a basis for taxation purposes. Then, each cadastral unit is recorded in land registers together with information about the ownership structure.
In all countries, official recording is carried out by the state administration. In some countries both the cadastral maps and land registers are integrated into one register and managed by a single authority (e.g., France, Germany and the 3 NMS), while in others land registers and cadastral maps are maintained by separate authorities (e.g., Sweden and UK). However, in all countries, there are close relationships between cadastral services and land registration services and increased integration of cadastral maps and land registers.
One must notice here that although the 3 NMS have implemented similar institutions and systems of land registration than the 4 EU-15 Member States, they face specific problems, mainly due to the incompleteness of the land restitution process on the one hand and to the removal of field boundaries during the communist period, on the other hand. Therefore, in all 3 NMS, there is still agricultural land without owner and thus unclear property rights do remain (see below the point on land restitution process). In addition, the Czech Republic and Lithuania have not completed there cadastral maps yet, since a number of cadastral units still have no clear boundaries.
Table 8: Registration and administration of property rights in partner countries
France Germany Italy Sweden UK Czech
Rep.
Lithuania Slovakia
Property rights clearly defined Sound legal land registration Cadastral maps Institution in charge of: - land registers - cadastral maps Specific problems Yes Yes Yes Cadastre Cadastre None Yes Yes Yes Grund-buchämter Kataster-ämter None Yes Yes Yes Agenzia del Territorio Cadastre None Yes Yes Yes Inskrivnin gsmyndig heten Lant-mäteriet None Yes Yes Yes Land registry Ordnan-ce survey None Yes Yes Yes Czech Office for Surveying, Mapping and Cadastre Missing owners Missing boundaries Yes Yes Yes Valstybés Imoné Registru Centras Missing owners Missing boundaries Yes Yes Yes Urad Geodezi, Kartogra-fie a Katastra Missing owners b) Land valuation
While land registration aims at defining physically land property rights, land valuation has at its main objective to assign a monetary value to these property rights. Hence, practically land valuation procedures establish a connection between land property rights and the capital value of the corresponding asset.
There are two main distinct ways used to estimate the capital value of a land plot. The first one is productivity (or income)-based. In that case, the valuation procedure consists in calculating the potential productivity of each land plot in order to derive its income potential. Usually, this implies to establish an official system of classification of land quality, where land classes (from very good soils to very bad soils) are determined according to soil characteristics and agronomic conditions. Then, in a second stage, a productivity score is estimated for each land class. Finally both these information allow for calculating the potential productivity of each land plot, which is used as the basis for estimating its income
potential. The second valuation method is market-based. It consists in evaluating the fair market value of each land plot on the basis of relevant observed buying/selling prices.
In Western European countries, the first method was historically designed and implemented mainly for land taxation purposes. In Central and Eastern European countries, the first method was also used during the communist period. Obviously, the main purpose there was not to value land plots but rather to estimate their potential productivity as a basis for land allocation purposes. Hence, synthesis Table 9 shows that 6 partner countries have inherited the first valuation procedure which, most often, is still in force: the 3 EU-15 Member States applying land tax systems (France, Germany and Italy) and the 3 NMS.
In theory, if all markets were functioning perfectly and if the income potential of each land plot was assessed and discounted correctly, both methods should arrive at similar values. In practice this is rarely the case. In the 3 EU-15 Member States, the productivity-based land valuation procedures were designed several decades ago and, most often, no significant updating has been undertaken recently. In the same time, if the present value of income stream is probably a key determinant of agricultural land buying/selling prices, other factors such as access, utilities, distance to a city, etc. are increasingly significant determinants of agricultural land market prices. Furthermore, changing CAP measures (in particular direct payments and quota assignment) are often not considered in productivity-based valuation procedures. While it is widely recognised that such policy changes actually have an impact on land buying/selling prices. Hence, productivity-based land values have progressively become “virtual” values totally disconnected from fair market values in the 3 old Member States (this is the case for instance of cadastral values –valeur locative cadastrale- in France, book values –Buchwert- in Germany and cadastral values in Italy), while they are usually lower than market values in the 3 NMS cf. Appendix 2).
As a result, in the 6 previously mentioned partner countries, at least, two values of agricultural land do exist, the first one issued from the productivity-based valuation procedure (that we will refer to as the “administrative” price), the second one from the market-based procedure. In all 6 countries (except Lithuania), the “administrative” price is still used as a basis for taxation purposes. In the 3 EU-15 Member States however, the value of land referred to for transaction, mortgage or compensation purposes (in case of expropriation for example) is the fair market value. In the 3 NMS, due to underdeveloped activity of agricultural land markets (see Section 4 below), there is very few information available on land buying/selling prices. Therefore, land market price recording has not developed yet and market-based valuation is
only at its initial stage. Consequently “administrative” prices remain widely used for both administrative and commercial purposes.
In Sweden and the UK, where there is no tax on agricultural land, the land valuation is market-based only.
Table 9: Land valuation in partner countries
Land valuation process
productivity-based market-based
Institution in charge of land valuation
France - Valeur locative cadastrale
- Disconnected and lower from market prices (no significant update since the 60’s)
- Used for land taxation purposes
-Yes - Land sale prices recorded systematically - valeurs locatives cadastrales: Ministry of finance
- market values: cadastre and notaries
Germany - Einheitswert (basis for book values: Buchwert)1
- Disconnected and lower from market prices (no significant update since the 60’s)
- Used for land taxation purposes
-Yes - Land sale prices recorded
- market values:
Agricultural office (Amt für Landwirtschaft) and local committee of experts
(Gutachterausschuss) - administrative prices (for Eastern Germany only): calculated and published annually by Ministry of Finance Italy - Cadastral value
- Disconnected and lower from market prices - Used for land taxation purposes2
-Yes3 - cadastral values:
ISTAT
- market values : INEA
Sweden No -Yes - Information on land transaction recorded systematically Inskrivnings-myndigheten (land registry) UK No -Yes - Land sale prices recorded systematically (but delays in notifications) Valuation Office Agency
Land valuation may be needed for compulsory purchase decisions or other asset valuation purposes. State-employed Regional District Valuers carry out this function Czech
Rep.
- Administrative price (calculated from the “Bonited Soil Ecological Unit” (BPEJ) scheme and computational formulaes of BPEJ’s productivity values)
- Usually lower than market prices - Used for land taxation purposes
- Not yet but gradually developing4
-Administrative prices calculated and published annually by the Ministry of Finance
Lithuania - Normative price (calculated from a productivity point system - soil classification system –
location coefficient system) - Usually lower than market prices - Used for taxation purposes
- Yes
-Average land market value for 413 value zones (calculated from market prices)
- Normative prices: Centre of Registers - Average land market values: Centre of Registers
Slovakia - Administrative price (calculated from “soil-quality ecological unit” scheme and
computational formulaes of annual rent level) - Usually lower than market prices
- Used for land taxation purposes
- Not yet but gradually developping5
- Administrative prices: experts from agricultural research institutions and lay assessors
1. There is also the earning-capacity value (Ertragswert), which is used for inheritance purposes.
2 Also used for legal/administrative matters are the so-called “Agricultural average values”, estimated by a commission on a sub-regional level (these are productivity-based values, which are most often different from market values).
3 INEA (National institute of Agricultural Economics) records land market prices through annual interviews to land traders.
4 Since 1993, a sample survey of buying/selling prices of agricultural land has been put in place by VUZE (Research Institute of Agricultural Economics, Prague, partner 7 of IDEMA).
5 Monitoring and evaluation of agricultural land sale prices for selected representative areas has been put in place by VUEPP (Research Institute of Agricultural and Food Economics, Bratislava, partner 9 of IDEMA) and the Research Institute of Geodesy and Cartography (Urad Geodezi a Kartografie, Bratislava) in co-operation with the cadastral administration offices of the six selected surveyed areas.
c) Current state of land restitution in the 3 new Member States
Because it was a political priority and an economic necessity, the land restitution process in the Czech Republic, Lithuania and Slovakia has received high support during the whole transition period and has progressed a lot. As a result, it is currently in its last stages in all 3 countries.
However, the Czech Republic, Lithuania and Slovakia still face some problems that contribute to delay the definitive completion of land restitution. Problems are similar in the 3 countries and relate to the 3 following aspects:
i) Missing owners: there is still agricultural land without owner, and this ultimate share of unclear property rights is very difficult to deal with.
ii) Missing parcels: because field boundaries were frequently removed during the communist period, the restitution process required to recover the right boundaries of plots in order to get a precise physical definition of the corresponding property. Unfortunately it has not been always possible to recover these right boundaries.
iii) Very important fragmentation of agricultural land and of agricultural land ownership that has resulted from the restitution process.
Table 10 below reports data that aim to give an idea of the extent of these problems as far as agricultural land is concerned in each country. As suggested by Table 10, the land restitution process in all 3 countries is still not definitely completed since they all exhibit a remaining share of agricultural land without owner. The problem of missing owners is not very important in the Czech Republic with only 2% of agricultural land without owner. It is more
significant in Lithuania (13% of agricultural land without owner) and particularly in Slovakia where nearly one quarter of agricultural land is still without owner.
There are various reasons explaining this remaining share of agricultural land without owners. In the Czech Republic, though they could not dispose of their ownership rights, citizens remained owners of their land during the communist period. Hence, after the Velvet Revolution, land was restored to former owners. However, at that time some of these owners could have died without heirs, or could have emigrated and could not been recovered. It is also the case that because of unclear inheritance procedures, heirs of former owners have been lost and cannot be recovered, or some plots have been forgotten so that they are still recorded as owned by died owners.5 Lithuania also face similar problems of lost owners however, the main obstacle to the completion of the restitution process is the option, given to former owners and their heirs, to choose the site of restitution. Until now, the date for claiming the desired land parcel has been prolonged for several times. Furthermore, there may be too many claims focusing on few sites with high economic potential. Therefore, it is likely that the restitution process for the last claims will take a long time because it is still no clear for which area the claimants will decide.
5 At this stage, one may also mention the specific problem in the Czech Republic regarding the area close to the
German borders (Sudety). In this area, a restitution and consolidation process was implemented after the 2nd
World War. But, this process remained uncompleted with a significant proportion of incomplete, unclear or false records in cadastral registers. This situation is progressively solved but the process to recover owners, heirs, plots and the property relationships between individuals and plots is difficult and very long.
Table 10: Current state of land restitution and remaining problems in the 3 new Member States
Czech Rep. Lithuania Slovakia
Missing Owners
- Total agricultural land area (1,000 ha) - State agricultural land area (1,000 ha) - Agricultural land area with private owner (1,000 ha)
- Agricultural land area without owner (1,000 ha) 4,269 690 (16%) 3,500 (82%) 80 (2%) 3,960 1000 (25%) 2460 (62%) 500 (13%) 2,236 116 (5%) 1,605 (72%) 515 (23%) Missing parcels
- extent of missing boundaries (% share of area with lacking boundaries)
70% 1-92% 2 n.a. n.a.
Fragmentation
- Number of registered land plots (million) - Average size of a plot (ha)
- Number of agricultural land owners (million)
- Number of owners per registered land plot - Average size area per owner (ha)
6.5 0.66 3-3.5 2-4 1.2-1.4 0.54 4 0.40 0.7 5.7 12.5 0.45 2 12-15 1.1 1 Some parcels have clear boundaries in cadastral maps but these boundaries are not physically present on corresponding parcels. Such parcels are recorded on new updated digital or digitalised cadastral maps. One estimate that such cadastral maps cover about 30% of area. In most cases these parcels are not physically accessible because they are part of land blocks and therefore owners of these parcels are strictly limited with withdrawing from current landusers. The 70% remaining area cover parcels that are recorded in old cadastral maps that were valid until 1951 (when mandatory recording in cadastre was stopped) and partly updated. Such parcels are not fully described physically, nor are the related ownership relationships.
2 Finally, it can be considered that only parcels after land consolidation process have clear boundaries both in cadastral maps and physically in terrain and at the same time are fully physically accessible. These parcels make about 8 % of total agricultural area.
Source: Czech Republic, data for 2003 provided by Czech partners; Lithuania, data for 2003 from National Land Service under the Ministry of Agriculture; Slovakia, Report Slovak Land Fund (2002) and World Bank (2002) cited in Bandlerova and Marisova (2003).
In both the Czech Republic and Slovakia, agricultural land without owner is managed by Land Funds that were created in the course of the restitution process. Czech and Slovak Land Funds are also in charge of the State-owned agricultural land. Usually, the land under the supervision of Land Funds is leased out. In both countries however, Land Funds have been authorised to start selling the State-owned agricultural land. In the Czech Republic for instance, nearly 121,000 ha of State-owned agricultural land have been transferred (117,000 ha sold and 4,000 ha transferred free of charge to municipalities and public universities) over the period 1999-2003, including roughly 72,000 ha for the only year 2003. According to
experts, if this recent trend is maintained, it can be expected that the sell-off of State-owned agricultural land will be nearly completed by 2009 (Nemec, 2005). Slovakia has started more recently to sell State-owned agricultural land. A new “Act on state owned land privatisation” was planned to enter into force on January 2005, with the objective of selling all current State-owned agricultural land over 3 years, primarily to Slovak farmers. Regarding agricultural land without owner, some provisions are in force in Slovakia stating that from the 1st of September 2005, farmland with unknown owner registered in the real estate cadastre for at least one year will be transferred to state ownership and managed as State-owned land by the Slovak Land Fund (Hudecova and Csókásová, 2004).
The situation is different in Lithuania where agricultural land without owner and State-owned agricultural land are administered by 10 County Administrations and 60 Municipalities/Cities. According to legislation, land without owner may be leased out while State-owned land can be leased out or sold. The lease decisions are proposed by municipalities and have to be approved by County Administrations. The revenue from lease accrues to municipalities’ budgets. Sale is organised by County Administrations and the revenue from sale is transferred to these County Administrations (except in cases of sales for non-agricultural use, where the sale payment is thus divided between the municipality and the County). As pointed out by the final report of the Twinning Light Project Lithuania-Germany (Daugaliene and Kauers, 2004), this rather complex organisation may raise some difficulties and result in a lengthy and costly process of privatisation of State-owned agricultural land. As an example, this final report mentions the potential conflict of interest between municipalities and County Administrations due to the division of revenue between lease and sales (and between sales for agricultural and non-agricultural uses): even if sale is giving the priority, municipalities will remain interested in generating revenue by land lease. As far as agricultural land without owner is concerned, already mentioned is the option to choose the site of restitution given to former owners and their heirs. This option and even more the absence of a strict deadline for claiming the desired land parcel not only is clearly an obstacle to the completion of the restitution process but also contributes to freeze all decisions regarding land without owner since the amount of land and the specific parcels that will finally remain without owner are still unknown.
Table 10 also illustrates the extent of agricultural land and land ownership fragmentation that has resulted from the restitution process in all 3 NMS. One may notice that land fragmentation itself is not necessarily an impediment to the development of competitive farm
structures. Actually, the key factor here is not the number of plots and their average size, but the way these plots are or can be spatially organised. To this regard, the degree of land ownership fragmentation is an important element, the way land sale and lease markets are operating as well. One can easily imagine that the conjunction of land and land ownership fragmentation (numerous small plots owned by numerous land owners) contributes to make the spatial organisation of plots complex. In addition, even if land sale and lease markets are operating well, land ownership fragmentation makes it more difficult land selling or leasing transactions that would allow spatial re-organisation of plots and farms to reach sizes that are suitable for competitive production. Obviously, poorly functioning land sale and lease markets make it even more difficult such a spatial re-organisation and farm size adjustment. Table 10 suggests that agricultural land and land ownership fragmentation is not as important in the Czech Republic and Lithuania than in Slovakia. In particular, land ownership appears as significantly more concentrated in the Czech Republic and Lithuania (for instance, there is in average 0.7 owner per registered plot in Lithuania, and 2 to 4 in the Czech Republic as compared to 12 to 15 in Slovakia). Table 10 shows that fragmentation of agricultural land and of land ownership is particularly high in Slovakia. It is too early to conclude about the potential links between this high degree of land and land ownership fragmentation, the level of activity on agricultural land sale and lease markets and farm restructuring in Slovakia relative to other partner countries. This point will be tackled later on when we will have got a clear picture of the level of activity on agricultural land markets in partner countries (cf. Section 4.). At this stage however, it may be interesting to bring together information reported in Table 10 and average sizes of farms currently observed in the 3 NMS. Figures reported in the previous section show that the average size of farms is 79.3 ha of UAA in the Czech Republic (24 ha for individual farms and 931.5 ha for other forms), 29.8 ha in Slovakia (4.5 ha for individual farms and 1,098.2 ha for other forms) and 9.2 ha in Lithuania (8.1 ha for individual farms and 468.4 ha for other forms). Hence, without proving any causality relationship, one may observe that the lower degree of agricultural land and land ownership fragmentation observed in the Czech Republic comes with significantly larger average farm size. At reverse, the higher degree of fragmentation observed in Slovakia is accompanied by particularly small average size of individual farms. This could suggest that high land and land ownership fragmentation could have contributed to slowing down farm restructuring and the process of farm enlargement (especially for individual farms) in Slovakia.
In order to support this farm restructuring and farm enlargement movement, all 3 NMS have implemented land consolidation programmes. Such programmes are directed at facilitating the creation of competitive agricultural production conditions by enabling farmers to adjust their parcels in order to get farms with fewer, larger and better shaped parcels and to expand the size of their holdings. Land consolidation programmes hence involve both reparcelling (changing boundaries) and modifying the land ownership pattern (exchange of plots between farmers or owners) or the existing leasing arrangements. Usually, land consolidation plans are implemented under the leadership of the state, for given territories. Such plans are not coercive but voluntary-based: they create the conditions for facilitating voluntary agreements between farmers and landowners. As a result, land consolidation is a complex and long process since it requires active participation of farmers and landowners and a number of agreements between farmers, between farmers and landowners and between landowners. To this regards, one may underline that joined ownership of land (as it is the case in Slovakia for instance) makes the land consolidation process even longer and more complicated.
All 3 NMS have implemented land consolidation projects, with as part of the land consolidation planning process, the possibility of privatising free State-owned land. In the Czech Republic the land consolidation process has been launched in 1991. There are 2 types of process currently in force: simple land consolidation (which covers only parts of a cadastral unit and whose main aim is to clarify and consolidate ownership relationships) and complex land consolidation (which covers a whole cadastral unit and whose aim is the total reorganisation of ownership relationships in view of improving farming condition and competitiveness and/or for environmental purposes). Simple land consolidation projects cover about 150,000 ha while complex land consolidation projects have been completed for nearly 192,000 ha in 493 cadastral units. These both types of land consolidation process have been completed on about 8.1 % of total agricultural land till the end of 2004 and are in progress for 9 additional percent of total agricultural land.6 In Lithuania 3 pilot projects have been implemented since 2001, in co-operation with the Danish Directorate for Food, Fisheries and Agro-business. The first project for instance covered 392 ha, 19 landowners participated and 86 ha changed owner. As a result of the second pilot project, 63 landowners participated and 224 ha changed owner (Daugaliene, 2004). Lithuania is currently defining the guidelines for a
6 Land consolidation is progressing very slowly because it is a complex and expensive process. Land
consolidation programmes are benefiting from 33.47 mil. € in the frame of the Operational programme over the period 2004-2006. It is expected that this financial support will allow to complete land consolidation on 225,000 ha i.e. on 5 % of total agricultural area.
large scale land consolidation programme. This programme will benefit from a 2.2 million euros budget over 2005-2006 (75% from the EU Structural Funds and 25% from the national budget). In Slovakia, land consolidation projects covered an area of about 123,000 ha in 109 cadastral regions in 2004. This area accounted for 2.4% of the national area recognised as necessitating land consolidation plans (Hudecova and Csókásová, 2004).
3.2. Other key elements of the institutional and legal structures
This paragraph focuses on several institutional and legal elements that potentially affect both the number of market participants and/or the incentives to trade (sell/rent out or buy/rent in) agricultural land. The following elements have been retained: inheritance legal rules, the existence of pre-emptive rights, the existence of legal restrictions on land ownership, the existence of legal restrictions on agricultural land use and the characteristics of agricultural land rental contracts.7 For each element, main legal provisions in force in partner countries are described and compared. Then, the way these provisions may affect agricultural land market activity is highlighted.
This paragraph closes with a specific point devoted to the role of the SAFERs (Sociétés d’Aménagement Foncier et d’Etablissement Rural) in France. As private bodies with public service missions, SAFERs are important players on the French agricultural land market. Such institutions do not exist in other partner countries, hence we thought interesting to examine this French specific feature, which may be related to the specific situation of France as compared to other considered old Member States, in terms of selling and renting prices of agricultural land (cf. Section 4.).
a) Inheritance legal rules
Briefly, there are two broad types of inheritance laws: full testamentary freedom vs. mandatory transfer to rightful heirs. Full testamentary freedom means that the owner can designate totally freely who she/he wants to leave her/his property and other assets to and decide how she/he wants to bequeath them. In other words, there are no legal rules of
7 There are agricultural land taxation systems in force in all partner countries but Sweden and the UK. Therefore,
agricultural land taxation was also retained as a legal element that potentially affects land market activity. However, these agricultural land tax systems were too complex and it was not possible to describe them briefly. In addition, due to this complexity and missing information it was difficult to compare such taxation systems
inheritance and the owner is given full freedom regarding her/his heirs and the share of her/his property and other assets she/he wants to bequeath each of them. On the other hand, mandatory transfer to rightful heirs means that heirs are designated by law as well as the share of the property and other assets they are entitled to. Hence, in this second case, there are strict legal rules of inheritance and the owner is not free to choose her/his heirs, nor their respective share of the inheritance.
If both systems co-exist in nearly all countries, usually one of them is chosen as the basic principle of the national inheritance law. More specifically, in countries where the inheritance law relies on the full testamentary freedom, the owner keeps the possibility not to draft a testimony. In that case, the transfer to rightful heirs applies. At reverse, in countries where the basic principle of the inheritance law is the mandatory transfer to rightful heirs, the owner most often can make a testimony in order to designate a specific heir. But in that case, the share of her/his property and other assets she/he is allowed to bequeath to this specific heir is limited since usually a minimum share is reserved to legal heirs (for instance, in Sweden half of the property/assets is reserved to rightful heirs, the rest can be transferred through a free testimony).
Table 11 shows that the inheritance law rather relies on the full testamentary freedom scheme in the UK and Lithuania. In other partner countries, inheritance law rather relates to the system of the mandatory transfer to rightful heirs. In all these countries, legal heirs are always relatives, from the closest (most often widow/widower/spouse and children) to the most distant ones. And, most often, the property and other assets to be inherited are split first between the widow/widower/spouse and children and then equally between children.
Obviously, legislations that are actually applied in each country are far more complex than the brief description provided above. Specifically, in countries where the inheritance law is based on the mandatory transfer to rightful heirs, there are usually a number of provisions that make the inheritance legal rules less strict and provide the owner with a certain room of manoeuvre to favour one heir over the others. It is not possible here to review all provisions that can be used for that purpose since it would imply to enter into the details of national legislations of each partner country. What is important to note however is that, even if provisions do exist that give the owner some more freedom to decide how to bequeath her/his property and other assets, the fact remains that legal heirs are immutable and most often such provisions only allow to change, to a certain extent, the share that accrues to one heir or the other.