HAL Id: hal-01182775
https://hal.inria.fr/hal-01182775
Submitted on 11 Aug 2015
HAL is a multi-disciplinary open access
archive for the deposit and dissemination of
sci-entific research documents, whether they are
pub-lished or not. The documents may come from
teaching and research institutions in France or
abroad, or from public or private research centers.
L’archive ouverte pluridisciplinaire HAL, est
destinée au dépôt et à la diffusion de documents
scientifiques de niveau recherche, publiés ou non,
émanant des établissements d’enseignement et de
recherche français ou étrangers, des laboratoires
publics ou privés.
A look inside the Pl@ntNet experience
Alexis Joly, Pierre Bonnet, Hervé Goëau, Julien Barbe, Souheil Selmi, Julien
Champ, Samuel Dufour-Kowalski, Antoine Affouard, Jennifer Carré,
Jean-François Molino, et al.
To cite this version:
Alexis Joly, Pierre Bonnet, Hervé Goëau, Julien Barbe, Souheil Selmi, et al..
A look
in-side the Pl@ntNet experience.
Multimedia Systems, Springer Verlag, 2016, 22 (6), pp.751-766.
�10.1007/s00530-015-0462-9�. �hal-01182775�
(will be inserted by the editor)
A look inside the Pl@ntNet experience
The good, the bias and the hope
Alexis Joly · Pierre Bonnet · Herv´e Go¨eau · Julien Barbe · Souheil Selmi · Julien Champ · Samuel Dufour-Kowalski · Antoine Affouard · Jennifer Carr´e · Jean-Fran¸cois Molino · Nozha Boujemaa · Daniel Barth´el´emy
Received: date / Accepted: date
Abstract Pl@ntNet is an innovative participatory sensing platform relying on image-based plants identification as a mean to enlist non-expert contribu-tors and facilitate the production of botanical observation data. One year after the public launch of the mobile application, we carry out a self-critical evalu-ation of the experience with regard to the requirements of a sustainable and effective ecological surveillance tool. We first demonstrate the attractiveness of the developed multimedia system (with more than 90K end-users) and the nice self-improving capacities of the whole collaborative workflow. We then point out the current limitations of the approach towards producing timely and accurate distribution maps of plants at a very large scale. We discuss in particular two main issues: the bias and the incompleteness of the produced data. We finally open new perspectives and describe upcoming realizations towards bridging these gaps.
1 Introduction
Sustainable development of agriculture as well as biodiversity conservation are strongly related to our knowledge of the identity, geographic distribution and uses of plants. Unfortunately, such basic information is often only partially available for professional stakeholders, teachers, scientists and citizens, and often incomplete for ecosystems that possess the highest plant diversity (such as Mediterranean and tropical regions). A noticeable cause and consequence of
F. Author first address Tel.: +123-45-678910 Fax: +123-45-678910 E-mail: [email protected] S. Author second address
this sparse knowledge, expressed as the taxonomic gap, is that identifying most of the plant species in the world is usually impossible for the general public, and also often a difficult task for professionals such as farmers or foresters and even for the botanists themselves. Indeed a botanist is usually an expert of a local flora or of a given taxonomic group (e.g. a family of plants). Since there are more than 300k flowering plant species on Earth, a specialist of a local flora is usually a novice in other areas, with totally different species, genus, and / or plant families.
In this context, using multimedia identification and collaborative data man-agement tools is considered as one of the most promising solution to help bridging the taxonomic gap [18, 5, 4, 17, 25, 19]. With the recent advances in digital devices/equipment, network bandwidth and information storage ca-pacities, the production of multimedia data has indeed become an easy task. Multimedia in ecology is consequently becoming a more and more attractive research field with a potentially great impact [24, 26, 2]. In parallel, the emer-gence of citizen sciences and social networking tools has fostered the creation of large and structured communities of nature observers (e.g. e-bird1, iNat-uralist2, Tela Botanica3, Xeno-Canto4, iSpot5 etc.) who already started to produce outstanding collections of multimedia records.
Building effective and sustainable ecological surveillance systems based on such collaborative approaches is however still challenging [17, 4]. Modelling the evolution of species distribution at a large scale would require much more sub-stantial data streams, typically producing two or three orders of magnitude more observations than current streams. Current data creation and valida-tion workflows are too much dependent on the labor of a small number of expert naturalists, thus could not scale-up to the required millions of observa-tions. The Pl@ntNet experience reported in this paper is an attempt to solve this issue through an innovative participatory sensing platform that relies on image-based plant identification, as a mean to enlist non-expert contributors and facilitate the production of botanical observation data.
Contrary to purely crowdsourced approaches, a key originality of the Pl@ntNet workflow is to rely on a well established social network specialized in botany to validate or enrich the raw naturalistic observations. Since 2010, hundreds of thousands of geo-tagged and dated plant photographs have been collected and revised by novice, amateur and expert botanists of this network. This high-quality visual collaborative knowledge is already reaching an unprecedented level of diversity in terms of taxa, locations, periods, acquisition devices and illumination conditions (see Section 2.2 for more details). The image-based identification tool in itself is synchronized with the validated observations so that its recognition performance improves with the increasing amount of new
1 http://ebird.org/content/ebird/ 2 http://www.inaturalist.org/ 3 http://www.tela-botanica.org/ 4 http://www.xeno-canto.org/ 5 http://ispotnature.org/
training data available. This tool is publicly and freely available as both a web and a mobile application, allowing anyone interested to identify plants to submit new observations. The increasing success of these applications boosts the number of new observers and the emergence of a sustainable community of active contributors.
The goal of this paper is to mark a milestone one year after the launch of the first mobile application, by evaluating the preliminary outcomes of the experience as regards to the requirements for a sustainable and effective ecolog-ical surveillance tool. We first demonstrate the attractiveness of the developed multimedia system (with more than 90K end-users) and the nice self-improving capacities of the whole collaborative workflow. We then point out the current limitations of the approach towards producing timely and accurate distribu-tion maps of plants at a very large scale. We discuss in particular two main issues: the bias and the incompleteness of the produced data. Lastly we open some perspectives and describe upcoming realizations towards bridging these gaps.
2 Pl@ntNet: a multimedia-oriented participatory sensing platform 2.1 History
The Pl@ntNet platform has evolved during the last 4 years with iterative de-velopments based on research advances in multimedia information retrieval, data aggregation and integration by a growing community of volunteers, and infrastructure evolution based on users feedback and human perception eval-uation. The following outcomes illustrate this evolution:
2010, Pl@ntScan: this on-line application was the first visual-based plant species identification system based on crowdsourced data. This prototype, that al-lowed in its first version to identify 27 Mediterranean tree species based on leaf images analysis [14], was a first step toward a large scale crowd-sourcing application promoting collaborative enrichment of botanical visual knowledge. From the technical side, contrary to state-of-the-art methods that were mostly based on leaf segmentation and shape boundary features, the visual search en-gine was based on local features and large-scale matching techniques. Indeed, we realized that large-scale object retrieval methods [16, 22], usually aimed at retrieving rigid objects (buildings, logos, etc.), do work surprisingly well on leaves. This can be explained by the fact that even if a small fraction of the leaf remains affine invariant, this is sufficient to discriminate it from other species. Conversely, segmentation-based approaches show several strong limitations in a crowdsourcing environment where the acquisition protocol (presence of clut-ter and background information, shadows, leaflets occlusion, holes, cropping, etc.) cannot be accurately controlled.
more user-friendly version based on a more advanced visual search engine [1, 8] relaxing geometrical constraints and focusing more on multi-features and saliency concerns. Pl@ntNet-ID was then dedicated to the identification of 54 Mediterranean tree and shrub species from photographs of leaves or flowers. It offered the possibility to combine several pictures of the same organ (i.e. up to 3 leaf or flower images of the same species) in order to improve the identi-fication performance. Still, users had the possibility to enrich the dataset by submitting their own pictures. The validation or correction of these contribu-tions was done manually by botanists of the project.
2012, Pl@ntNet-Identify: an important milestone was marked in 2012 with the launch of the Pl@ntNet-Identify web application6and the development of an end-to-end innovative workflow involving the members of the Tela Botanica social network [17]. Beyond expert data integration efforts and purely crowd-sourced approaches, we actually argued that thematic social networks have the advantage to connect experts, enlightened amateurs and novices around a topic of common interest so that all of them can play complementary roles in a real-world ecological surveillance workflow. Typically the experts can run projects, define observation protocols and use them for teaching, enlightened amateurs can collaboratively validate data according to their level of expertise, enthusiast novices can provide massive sets of observations according to well defined and documented protocols. Technically speaking, Pl@ntNet-Identify can be considered as one of the first collaborative active learning system in which the learning algorithm is able to interactively query a network of users rather than a single user, and to annotate new data points. Two complemen-tary web applications were developed, allowing collaborative revision, vali-dation, qualification and enrichment of data before their integration in the training dataset. These two applications, called IdentiPlante (for collabora-tive identification validation) and PictoFlora (for collaboracollabora-tive picture evalu-ation and tagging process) are intensely used by the community, resulting in a nightly update of the Pl@ntNet-Identify’s training dataset with new validated records. Besides, Pl@ntNet-Identify was also the first botanical identification system based on the potential combination of several habit, leaf, flower, fruit and bark pictures, thanks to the fusion mechanisms introduced in [8] and re-fined in [17]. This allows identification during the whole year, including when leaves and flowers are not available. The resulting multimedia system has been extensively experimented through massive leave-one-out tests as well as the participation to system-oriented benchmarks and human-centered evaluations [8, 12, 11, 17]. This has shown the great potential of the approach and the good acceptance of such a new way of identifying plants by users. As the objective of this paper is not to describe the multimedia system in itself, we invite the reader refer to [17] for a complete description and a synthesis of the evaluations. 2013, Pl@ntNet-mobile iOS: the Pl@ntNet workflow was extended to mobile
devices at the beginning of 2013 [10], a first iOS application being launched in March 2013. At that time, the training dataset included 22 574 images of 957 common European plants species. Less than one year later, thanks to the success of Pl@ntNet-mobile iOS among Tela Botanica’s members, these figures increased to 66 000 and 3 600 respectively. Pl@ntNet-mobile has 4 main func-tionalities: (i) an image feeds reader to explore the latest contributions; (ii) a taxonomic browser including common names available in several European languages, with a full-text search function; (iii) a user profile and personal contents management screen; and of course, (iv) the image-based identifica-tion tool. The visual search engine is focused on 4 simple view types (flower, leaf, fruit and bark) that can be combined in a single visual request composed of up to 5 images. The current response time ranges between 4 to 20 seconds depending on the number of pictures, the types of views and the conditions of connection. Matched species are displayed by decreasing confidence scores. Users can refine the result by visualizing the images available in the training dataset as well as the species description sheets from eFlore (Tela Botanica’s collaborative encyclopedia of the French flora) and Wikipedia. When the user is ready to share his observation, he can do so whether he succeeded in identi-fying his observation or not. The picture(s), date, positioning and author name are then sent to the collaborative apps (under a Creative Commons licence) as well as to his personal collection, which is accessible from both the Tela Botanica platform and the mobile application itself.
2014, Pl@ntNet-mobile Android: finally, an Android version of the Pl@ntNet mobile application was distributed one year after the IOS version, with much more data (85 750 images covering 3 957 species) and several innovations such as (i) the use of metadata additionally to the visual content in the identifi-cation process (ii) a new multi-organ, multi-image and multi-feature fusion strategy using separate indexes for each visual feature (iii) the integration of cross-languages functionalities [9]. The ergonomy and design of the application greatly benefited from user feedback and from the experience of the iOS ver-sion. Figure 1 displays 3 screenshots of the web, iOS and Android front-ends of Pl@ntNet’s multimedia system.
2.2 Collaborative methodology
From the beginning, the Pl@ntNet initiative has engaged lots of efforts to ag-gregate raw visual botanical data through a collaborative methodology. These efforts for the production of numerous, well standardized and high-quality plant images were necessary to cover the huge visual diversity of plant species, according to their growing stages, phenological stages, and/or ecological con-ditions of development. The Pl@ntNet platform has been regularly enriched by collaborative contributions from a few dozens of people in 2010 to a few thousands in 2013, interested to participate in the development of a collab-orative plant identification system. Based on the experience and knowledge
(a) (b) (c) Fig. 1 Graphic interfaces of the 3 instances of the Pl@ntNet image-based plant identifica-tion system: (a) Web interface, (b) iPhone interface, (c) Android interface
of Tela Botanica NGO in carrying out participatory projects and citizen sci-ences missions, several facilitators have encouraged volunteers and channelled their contributions to produce appropriate data for the project. A strong focus was initially made on a relatively small group of plants (trees of the Mediter-ranean flora), in order to facilitate the participation of non specialists. Project facilitators produced several illustrated species description sheets exemplifying the correct shooting protocol. These sheets were periodically sent to potential participants through ”species of the month” campaigns. A discussion forum played a major role in allowing participants to share knowledge and experi-ence, as well as to discuss the limits and potentialities of the content-based retrieval approach for plant identification.
With the increasing number of participants and data, instead of channelling contributions on a limited set of species, we rather took advantage of the involvement of volunteers and let them freely contribute on all the species available to them. Thereafter, the project facilitation was limited to a few guidelines and challenges related to the season, such as ”Autumn leaves”, ”Tree fruit and bark” in winter, major herbs families, etc. This activity was complemented by several field sessions, either to attract and train newcomers or to rapidly collect new data.
In order to speed up data production and to facilitate contribution of participants, we developed several multimedia services such as (i) an auto-crop service allowing to split multiple-leaves scans into one-leaf images (ii) a mass annotation service allowing to semi-automatically tag images as ”habit”, ”leaf”, ”flower”, ”fruit”, ”stem”, ”plant”, ”branch”, and ”other”. Such services did consistently increase the amount of data submitted by some contributors. As mentioned above, we designed and developed two complementary tools: (i) IdentiPlante, dedicated to identification revision, validation and discussion, (ii) PictoFlora, aimed at tagging images according to their type (leaf, flower, scan, etc.) and their quality.
IdentiPlante displays all botanical records shared by the project members. Web users (logged or not) are able to provide new identifications, post com-ments and also vote on previous ones. This system is crawled every night by
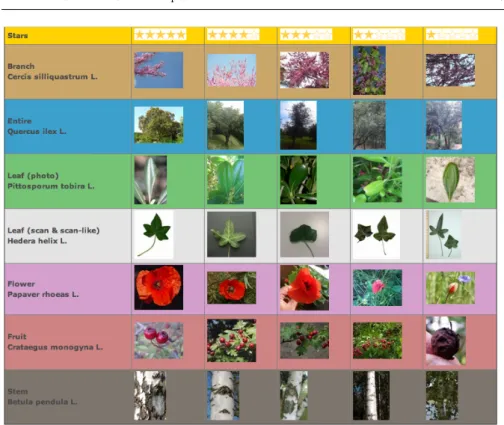
Fig. 2 Illustration of the collaborative data produced through PictoFlora: pictures are annotated with structured tags and rated according to their quality (for identification pur-poses)
the visual search engine, which picks up observations considered as correctly identified according to a predefined set of rules on the votes and on possible conflicts.
PictoFlora is dedicated to image visualization, technical evaluation and tag-ging. Users can assess picture quality (from 1 to 5 stars) and add or change the associated tags. Figure 9 illustrates the resulting quality ratings for the main types of views considered in the platform. The crawling strategy consists in collecting, among botanical records previously validated through IdentiPlante, all images having an average vote equal or above 3 stars.
Both tools provide a panoply of navigation features allowing an easy access to subsets of the records, e.g. from a given area, period, author or plant group. This allows each user to focus on the most useful or accessible contents (under-represented species, last contributions, under-(under-represented areas, etc.).
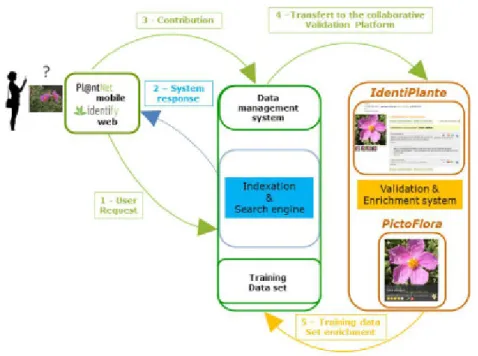
Fig. 3 Pl@ntNet participatory sensing platform
2.3 An autonomous participatory sensing platform
Figure 3 presents the overall architecture of the Pl@ntNet multimedia system (where one can recognize the different software and data streams mentioned above). It is now running as a nearly autonomous and self-organized partic-ipatory sensing [3, 21] platform with a large community of users, involved in different parts of the system. Some of its most important advantages are (i) its wide diversity of functionalities from data production to data visualization and validation (ii) its large taxonomical spectrum (with around 4K plant species) (iii) its high accessibility, especially for non-specialists in botany (iv) its gener-icity (allowing deployment on other floras) (v) its self-improving capacities due to the inherent virtuous circle (the more data the better identification perfor-mance, the better identification performance the more contributors involved as well as the more collected data).
The platform is now able to enrol many different types of user profiles, according to their needs and feelings. Three examples illustrate the attractive-ness and the overall coherence of the system (names have been changed): Sylvia: Expert botanist and keen photograph, she is interested in sharing her knowledge and data and to be acknowledged for that. Her main activity is the production of large amounts of field observations (several per day). Most
of them are illustrated with a high precision and each image is described with several keywords. One of the first motivations of this kind of user is to benefit from an infrastructure that allows to manage a big amount of data and share it with the community.
Juan: He has various levels of expertise, he is already able to identify a few species and would like to be able to identify more. This user profile doesn’t produce raw data, but is interested to evaluate his expertise and to increase it by browsing information related to specific taxa or regions through the Iden-tiPlante and PictoFlora systems. He will then validate the taxa he knows on IdentiPlante with comments and suggestions to raw data producers. He will also browse information associated to all botanical records that he is looking for, in order to enrich his expertise on specific taxa.
Peter: He wants to learn about field botany and to share his field notes with a large community of people. This user profile mostly use the mobile application and is able, without any training, to quickly identify some plant species, based on the identifications proposed by the system. Most of his plant identifications are shared in order to enrich the system for the next generation of users.
2.4 Data quality assessment
In order to assess the level of noise of the taxonomic annotations in the Pl@ntNet repository (i.e. the one used as reference set in the Pl@ntNet identi-fication tools), we conducted a specific experiment involving 3 expert botanists of the French flora. We remind that the Pl@ntNet repository contains only a fraction of the raw collected observations, i.e. the ones that have been validated through the collaborative tools IdentiPlante and PictoFlora. More precisely, an observation joins the Pl@ntNet repository only if (i) it has been validated by at least one Tela Botanica member (ii) conflicts between contradictory de-terminations have been solved (iii) the visual content is of sufficient quality with an average quality rating over 3 stars. We assessed the reliability of the data produced after this filtering process by randomly sampling 150 observa-tions from the Pl@ntNet repository and asking 3 expert botanists to assess the accuracy of their taxonomic annotations at the species level (2 of the botanists being among the most recognized expert of the French flora). As a result of this experiment, we estimated that 86.7% of the observations in the Pl@ntNet repository are correctly determined, i.e. are annotated with the correct taxon according to the 3 experts (who based their decision on the official and up to date French taxonomy). Among the 13.3% remaining observations, after discussion between the experts, 5.7% were judged as definitely incorrect and 7.6% were rather judged as ambiguous, meaning that additional pictures or information would be required to correctly disambiguate the possible species. These figures should be put in perspective, as even for experts botanists (i.e. the very few able to correctly identify more than 80% of the French flora),
there is always a certain level of doubtfulness in identification on pictures. Moreover, the taxonomy itself changes over time, so that some observations, once considered as correctly identified, may become incorrect. On the whole, whatever the identification tools and the people involved, plant occurrence data are often somewhat noisy. Scientist willing to use them should be aware of the problem, and deal with that noise.
3 Use of data analytics
To assess the attractiveness, effectiveness and sustainability of Pl@ntNet as a participatory sensing platform, we mainly rely on the use of data analytics computed via Google analytics7. In the following subsections, we present the main findings and conclusions we came on that illustrate both the high po-tential as well as the current limitations of the system. Note that all of the reported figures and statistics solely concern the standalone Pl@ntNet partici-patory sensing system as depicted in Figure 3. The considered input sources of data are noticeably restricted to the mobile applications themselves, whereas in practice, the system also copes with the other contributions of the Tela Botanica’s social network. These parallel contributions, that are so far even more important in number than the mobile ones, are uploaded through specific web tools developed by Tela Botanica, before being shared in the Pl@ntNet collaborative web tools (IdentiPlante and PictoFlora), and finally integrated into the visual index after validation. As the main goal of this paper is to evaluate the crowdsourced and participatory sensing side of the workflow, we did not considered these data streams in our analysis.
3.1 Audience
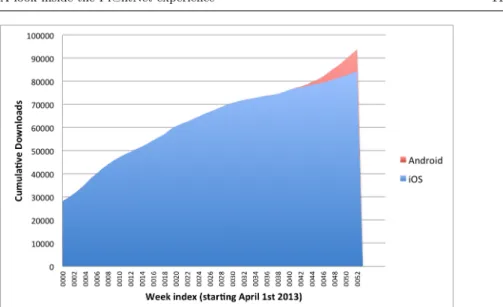
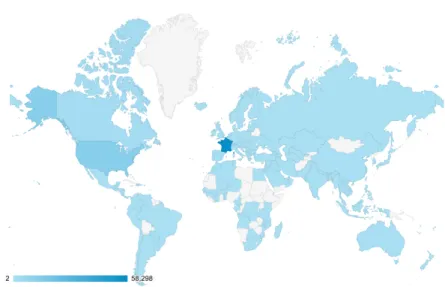
The PlantNet-mobile iOS application was launched in March 2013 and has been downloaded at the time of writing by 84437 iPhone users. The Android version was released in February 2014 and has already been downloaded by 6018 users. Figure 4 displays the cumulative number of downloads over time. This shows that the application keeped attracting new users every day, in par-ticular within the last few months thanks to the Android version and upon the arrival of spring (about 10 new downloads per hour within the last days). Fig-ure 5 displays the geographical distribution of iOS version users from its start. As the application is primarily focused on the French flora, 68.05% of users are located in France. However, the number of users living in other countries is significant, with 12K users in the US, 8.7K users in European countries (other than France), 1.8K in Canada, and 3.5K in the rest of the world. Whereas the diffusion in neighboring countries is obviously due to floristic closeness, the
Fig. 4 Weekly new downloads cumulated on the two mobile versions of the Pl@ntNet mobile applications
Table 1 Pl@ntNet Users Loyalty
iOS Android Total users 84,437 6018 1 session 9,563 (11.3%) 2,050 (34.1%) 2-5 sessions 44,549 (52.2%) 2,115 (35.1%) 5-10 sessions 22,304 (26.4%) 1,281 (21.3%) ≥ 10 sessions 8,021 (9.5%) 565 (9.4%) ≥ 25 sessions 456 (0.5%) 64 (1.03%) ≥ 100 sessions 47 (0.05%) 7 (0.12%)
attractiveness in distant countries (e.g. USA) is somewhat difficult to inter-pret. According to the feedback sent on the Appstore, it is on one side due to curiosity about the technology but also to a form of effectiveness of the appli-cation at the family taxonomic level (at which the intersection between foreign countries is much higher). In any case, this also shows the attractiveness of this kind of technology.
As for any application, the degree of involvement and loyalty is highly variable among users. Table 1 shows the relationship between the number of users and the number of sessions. The percentage of users who tested the iOS application only once is rather low (11.3%). It is higher for the Android appli-cation but this is mainly due to the shorter runtime (2 months). Then, about half of the users experimented the application just a few times, either because they were not convinced by the system, or because this corresponded to their usage of the application (”I am curious about a plant few times in the year”). Note that this category of users also includes new entrants who might use the
Fig. 5 Geographic distribution of Pl@ntNet iOS users
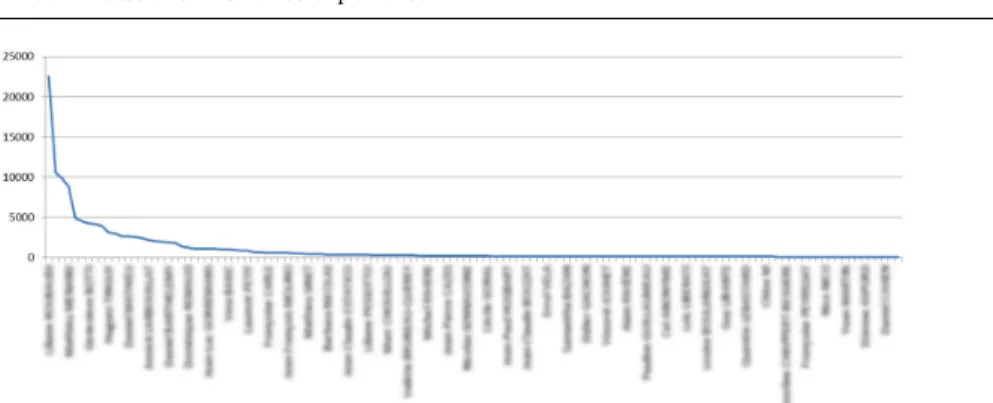
application again later. Anyway, we can roughly consider that about one third of the users who downloaded the application became real active users which shows a pretty good acceptance rate and forms a community of several tens of thousands of users. Finally, there is a long tail of few hundreds of very active users. These last ones should definitely not be neglected. As in any social net-work, they are actually likely to be the most influential users and the ones who produce the more data and knowledge. As an illustration, Figure 6 plots the number of images shared by the top-50 contributors of Tela Botanica’s social network from its creation, showing the importance of having such profiles on board.
3.2 Query logs analytics
The goal of this section is to analyse the raw observations produced by the Pl@ntNet participatory sensing applications over a period of one year, starting from April 1st 2013 to April 1st 2014. By raw observations, we mean the images submitted as queries by the users in order to identify an observed plant of interest. Each of these observations is automatically dated and 55.6% are automatically geo-localized when the user agrees on sharing his location. Each of them is also associated with a ranked list of the most probable species according to the visual search engine. During the considered one-year period, 137115 such raw observations were produced via the iOS version which is a very promising number compared to the many years of effort required to build existing botanical datasets of this size. But as will discussed hereafter, such data have several biases and limitations.
Fig. 6 Number of images shared by the top-50 contributors of Tela Botanica social network from its creation
First of all, only a very small fraction of it is nowadays accurately de-termined (i.e. has an accurate taxon associated with each observation). The way the application works for now is actually based on a volunteer basis to share the observation through the PictoFlora and IdentiPlante collaborative tools. Users actually must register, validate one of the species returned by the application and explicitly share it with the network. Non-shared observations are only stored as query logs and do not enter the circular workflow. So far, over the 137115 collected observations, only 1978 observations composed of 6946 images were shared by 316 users. This insufficient rate of 1.44% is due to several issues, some of them being addressable in the upcoming months and years, and some of them requiring more research efforts, as discussed in the perspectives section of this paper. Practically, the main break to the active contribution is the additional effort required to share an observation and the fear of sending a false determination to the network. Even if the system answer is wrong, users can actually share their observation with any of the proposed species or even by deleting the text that appears in the species field, and send an empty determination. But in practice, they almost never do so. A solution to that problem could be to more explicitly encourage such empty contribu-tions, or even to automatically send all observations to the collaborative tools by asking the user once for all the future sessions. But we would then raise another challenging issue: the social network’s overload. Long term solutions to that problem will be further discussed in section 4. Meanwhile, for the up-coming year, we will rather try to boost the number of active contributions by (i) sending notifications in the mobile application when an active contri-bution has been validated or corrected by a member of the social network (ii) integrating some of the collaborative functionalities of PictoFlora and Iden-tiPlante directly in the mobile applications (iii) better informing the users on the utility of contributing and the way of doing it well. More generally speak-ing, the objective is to foster a better awareness of the social network and the ecological challenges.
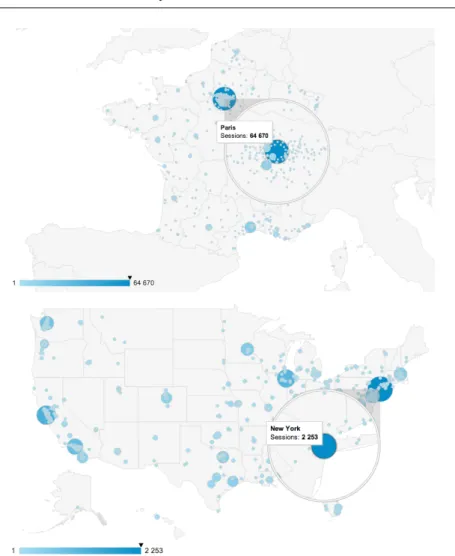
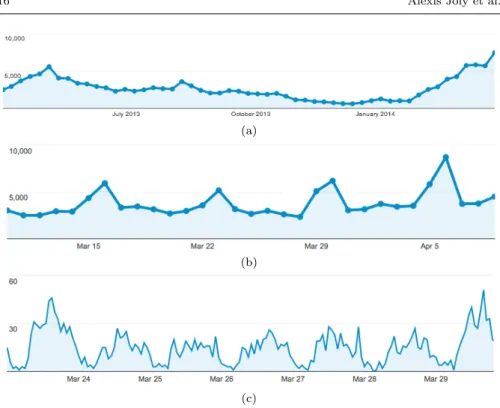
Another issue of the collected data is that observations are often incom-plete. The average number of images per observation is actually quite law, equal to about 1.33 for a total of 182706 images (90758 images of leaves, 69676 images of flowers, 11046 images of barks, 9353 images of fruits). More precisely, 77.5% of the observations are composed of a single image, 15.6% of two images, 4.4% of three images, 1.6% of four images, 0.9% of five images. Depending on the observed taxon, this lack of complementary visual infor-mation might be problematic and prevent from providing an accurate human validation. Beyond the additional effort required to photograph several parts of the plants, one of the reasons of the low average number of images per observation is the response time of the application that is increasing with the number of pictures. Recent development did allow to divide the response time by 4 and this might help collecting more pictures per plant in the upcoming year. Another reason is that most users simply don’t understand the neces-sity of taking several pictures of the same plant. As the proportion of mobile users who actively share their observation with the network is still currently low, most of them don’t benefit from the rich feedback received when using the collaborative tools. For instance, for many of the 1978 observations shared by mobile users, the latter did receive advices about which photos should be taken to complete the observation. Here again, the need to integrate social functionalities within the mobile front-end itself appears to be essential. Besides the insufficient amount of humanly validated observations, another issue which inevitably arises in any participatory sensing system, is the bias in temporal and geographical distribution of the observations. Indeed, it is highly correlated to human activity. Figure 7 displays the geographical distribution of the raw observations collected during the one-year period in both the US and France. It clearly shows that high densities of observations are linked to population density and not at all to plants density. The time distribution of the observations is also highly correlated to human activities as illustrated in Figure 8. The evolution along the year shows that the season has a strong im-pact on the number of observations. There is a clear large peak of use during the spring when flowers are the most visible and the weather ideal for walk out. On the contrary, the use in winter is very low because the number of visible plant organs is very low and the weather not favourable. The peak of use in August corresponds to summer holidays in France. At monthly level, periodic peaks appear during week-ends, on Sundays in particular. Although we did not statistically test the relationship between the use curves and me-teorological data, we punctually observed a few daily correlations with bad or good weather. Finally, the distribution of observations is correlated to human activities even during a day (low use during lunch time, during office/home day time, at night, etc.).
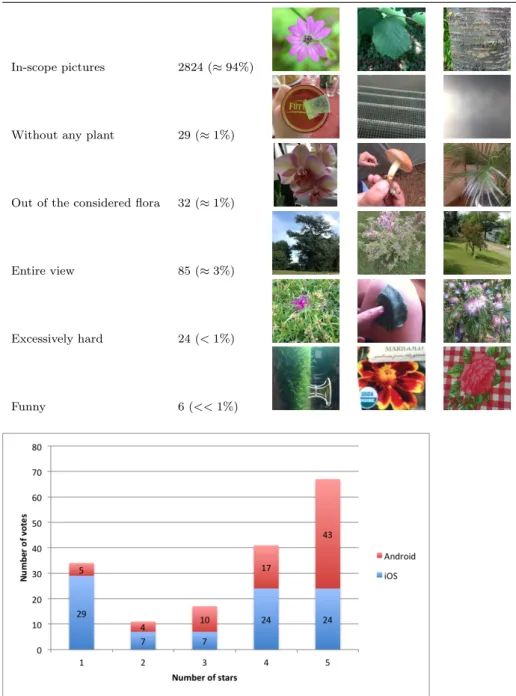
In order to assess the degree of noise in the images themselves, we randomly selected 3000 images atht we manually checked and classified into 6 different categories (Table 2). Overall, 94.1% were considered as falling into the scope of the application and of sufficient quality to be integrated in the collaborative
Fig. 7 Distribution of the user sessions of the iPhone application in France and in the US - Period: April 1st 2013 to April 5th 2014
tools (and further qualified by members of the social network). Although not negligible, this low level of noise is clearly good news regarding the usefulness of the data. Even if rare, noisy pictures might compromise users’ confidence in the system and slow down their enthusiasm to contribute. Data cleansing should therefore be considered before integrating all raw observations in the collaborative tools.
(a)
(b)
(c)
Fig. 8 Weekly (a), Daily (b) and hourly (c) number of queries submitted through the iPhone application - Periods: (a) April 1st 2013 to April 5th 2014 (b) March 10th 2014 to April 10th 2014 (c) March 23th 2014 to March 29th 2014
3.3 User feedback
Besides usage data and query logs analytics, we also analysed the comments and feedback posted by 170 users on Apple and Android marketplaces (Figure 9.) Primarily, 63.5% of the users gave a 5 or 4 stars rating with very positive comments and useful feedback that were used to progressively enrich the ap-plication (e.g. integration of the common names, full-text search, etc.). Then, 15% of the users gave a 2 or 3 stars rating. They usually complain about the current performance of the application and hope that the database and the search engine will be improved in the future. Finally, 17% of the users gave the lowest possible rating. This corresponds to persons who did not succeed in identifying any plant after few trials, either because they submitted observa-tions of plants that are not in the scope of the application (usually ornamental or exotic houseplants) or because the identification really failed. None of them made any comment on the other facets of the application (data, collaborative enrichment, etc.) as well as they did not express any wishes for the future. Note that the fraction of such users has considerably decreased during the 10-month interval between the releases of iOS and Android versions. This proves that the performance and usability of the application improved a lot during this period of time.
Table 2 Degree of noise in the images themselves from the raw observations.
In-scope pictures 2824 (≈ 94%)
Without any plant 29 (≈ 1%)
Out of the considered flora 32 (≈ 1%)
Entire view 85 (≈ 3%)
Excessively hard 24 (< 1%)
Funny 6 (<< 1%)
Fig. 9 User’s ratings collected on the Apple and Android marketplaces - Period: April 1st 2013 to April 1st 2014.
4 Challenges and Perspectives
This section discusses the challenges and the perspectives towards solving the limitations discussed above (mainly the insufficient amount of active contri-butions and the bias of the collected observations).
4.1 Improving identification performance
The primary way to increase the production of the current workflow is to improve the performance of the image-based identification engine. A better accuracy of the determinations will actually mechanically increase the attrac-tiveness of the mobile applications while reducing the noise of the submitted observations. This will consequently lighten the collaborative workload spent on cleaning and validating the data for the benefit of other useful tasks such as collecting higher level information about plants. Note that an ideal system that would always identify the correct species at the first attempt would not require any collaborative validation. This is of course not conceivable with current technologies (and even for experts) but improving the identification performance in any possible way remains an essential objective.
Upcoming progresses in computer vision and machine learning will first con-tribute to improve the accuracy of identifications in the future. Fine-grained classification currently attracts more and more researchers [27, 23, 7, 20] on challenging datasets such as those promoted in the FGComp challenge8. As
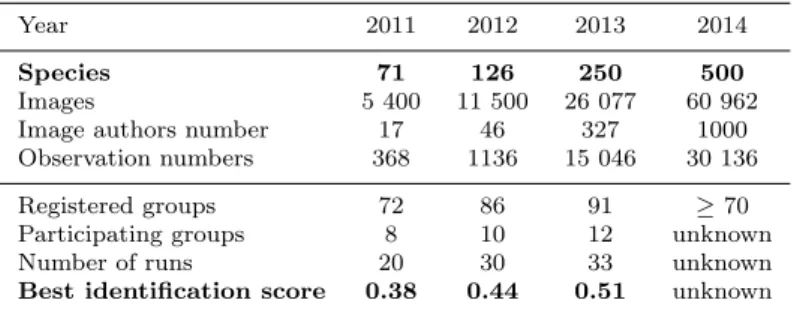
part of this effort and to boost the interest on plants, the Pl@ntNet project it-self is running a fine-grained plant identification task since 2011 in the context of the CLEF9 international evaluation forum. Each year we did share a grow-ing part of the Pl@ntNet data with the multimedia community and we did evaluate tens of methods experimented by the participating research groups. Details about the data, the methodology, the participants and the results can be found in the overview working notes produced each year [13, 12, 11]. Table 3 gives a raw synthesis over the last 4 years. One of the most important outcome of this effort is that the best identification performance did actually progress each year whereas the task was becoming more and more complex with more species, more images and more types of view (from single leaves in 2011 to flowers, fruits, barks, branches in 2013). This demonstrates that the state-of-the-art is progressing consistently and we believe that the emulation created by PlantCLEF contributes to it. Another finding was that using meta-data to complement the visual contents can slightly improve the performance of the system but could provide a technological breakthrough. In particular, the date, the type of view and the individual plant identifiers were successfully em-ployed. None of the participants was able to use the geo-location information successfully.
8
https://sites.google.com/site/fgcomp2013/
Table 3 Synthesis of PlantCLEF evaluation campaign over the 4 last years
Year 2011 2012 2013 2014
Species 71 126 250 500
Images 5 400 11 500 26 077 60 962 Image authors number 17 46 327 1000 Observation numbers 368 1136 15 046 30 136 Registered groups 72 86 91 ≥ 70 Participating groups 8 10 12 unknown Number of runs 20 30 33 unknown Best identification score 0.38 0.44 0.51 unknown
Despite the consistent progress recorded along the years, raw identification performance is however still not satisfactory enough. In 2013, only about half of the evaluated queries were actually correctly identified by the best system whereas the number of species was rather low (256). Continuing this effort in the next few years therefore appears to be a first important perspective. An important question regarding existing technologies is whether they could scale up to hundreds of thousands of classes and deal with long tail distribu-tions of weakly annotated data. Beyond computer vision and machine learning concerns, diversifying the range of approaches usable for improving the identi-fication appears to be another important perspective. As powerful as computer vision technologies could be in the future, they will actually not be able to ac-curately determine all plants at the species level using only generic image cate-gories such as the ones considered now (flower, leaf, branch, etc.). The nature of the discriminant morphological attributes is different from a group to another and many of them would require very specific acquisition protocols. Therefore, more interactive and knowledge-based information systems will probably be necessary to reach highly confident identifications. Image-based technologies should still be used as a very efficient primary step allowing to focus the user’s attention on a few species but then the user should be guided by the system to analyse the right attributes and refine his determination.
4.2 Boosting attractiveness through immersive and interactive features Beyond purely identification-oriented functions, the attractiveness of sensing mobile applications could be improved in many other ways. Immersive and Social Local Mobile features (SoLoMo) that would allow to discover and learn about the surrounding flora could notably boost the number of observations (e.g. by displaying the closest observations on a map, or by localizing in real time the closest users and interact with them, or by subscribing to specific data streams of users, or taxons). Designing and developing advanced browsing and searching functionalities is another perspective to increase both the attractive-ness and the educational impact of the applications (e.g. similar species search, combined visual and structure queries, combined visual and full text queries,
etc.). Some of these scenarios involve difficult problems and will require the emergence of new cross-media information retrieval methods allowing complex queries across both the social & contextual data and the audio-visual contents. Modern content-based search technologies currently allow to efficiently search the top-k most similar objects (or object categories) to a given query, but they cannot be efficiently combined with additional filtering on contextual & social data (or with other content-based sources).
4.3 Optimizing and balancing the collaborative workload
Current data creation and validation workflows are too much dependent on the labor of a small fraction of expert naturalists who validate, correct and discuss the contributions of the a large fraction of less expert users. Nowa-days, this bottleneck is still not a problem since the active contributions of the mobile phone users only represent 10% of the traffic on the collaborative vali-dation tool. Also, the network often answers to an undetermined observation in less than 15 minutes, many contributors being real addicts (some of them admit having the application open all the time and refreshing it regularly to catch new submissions). Even if the tool is not presented as a social gaming application or a serious game, it shares several of their success keys (social interaction, reputability, peer recognition, entertainment, captivation, etc.). But if the number of crowdsourced contributions is increased by one or two orders of magnitude, the experts will be submerged and demotivated. Some of them already complain about the fact that many people continue to send noisy or incomplete observations whereas they spend many efforts to explain how pictures of plants should be taken. If one day they perceive the collabo-rative identification applications as a massive exploitation of their expertise, they will retire from the workflow.
It is therefore crucial to try to balance the workload across more users and to keep social interactions as a central objective. Building peer-to-peer mul-timedia recommendation systems in this regard is an interesting challenge. An axiom is that any human is capable to recognize few tens of plants with-out much effort if he is provided with the right information. The problem is that the few tens of plants known by a vast majority of people are often the same, i.e. many users actually have a similar taxonomic profile focused on the most common plants. A smart recommendation system should therefore be able to diversify and rationalize the taxonomic profiles of users by send-ing them observations of specific taxons and givsend-ing them access to adapted educational contents. Optimally distributing the global taxonomic knowledge among users is a complex problem that could rely on different hypothesis such as the geographical botany awareness of users. People are actually more likely to recognize plants that live around them even if they don’t know their names, in particular plants with which they interacted in childhood.
A complementary perspective for further reducing the social network workload is to directly use content-based multimedia identification tools in the
collab-orative workflow so as to convey the right observations to the right persons (e.g. by matching the result lists with the taxonomic profiles). Asking specific users to validate or reject an observation that possibly matches their expertise is actually much more efficient than sending an undetermined observation to the whole network. Massive annotation tools could be another option to con-sider. A given user could be sent a list of observations of presumably the same species sorted by confidence score. The coherence of the first results could consistently lighten the overall validation effort. To go further, we could even imagine building content-based identification tool for each user based on his own observations and/or validations. Such a tool would act as a virtual clone of the user making use of his visual knowledge to automatically determine un-known observations sent to him. Studying the effect of integrating such clones in real collaborative systems might be an interesting research topic.
4.4 Exploiting the data
As discussed earlier in the paper, observations collected through a participa-tory sensing platform like Pl@ntNet are and will inevitably be biased by many human and environmental factors. The above mentioned perspectives might help to produce much more data and populate the long tail of species, but the brute-force spatial and temporal distribution of the observations won’t be directly usable to model plant species distribution and evolution. Hopefully, applying appropriate analytical tools to infer properties of the processes that are responsible for the spatial and temporal dynamics of natural systems only from their available realizations is already a common practice in ecology [6]. Such an approach is all the more timely now that an impressive number of physical and biological variables are measured and mapped at global scales and at high resolutions (e.g. [15]). The increasing availability of these large gridded datasets is due not only to the advances in remote-sensing, geodesy, and information technologies, but also to numerous initiatives facilitating their accessibility. Among others, these are, for optical and biophysical variables, the Global Land Cover Facility10) and the Google Earth Engine platform, and, for
organisms’ occurrences, the Global Biodiversity Information Facility 11. One
of the greatest strengths of a system like Pl@ntNet in this perspective is to produce long-term data streams and on a very wide coverage of species. As a first approximation, the bias due to human activity could for instance be considered independent of the observed species so that the distribution of each species could be easily normalized by a global model of human activities com-puted on all species. Differential analysis from one year to the next might also compensate many of the bias.
Beyond the exploitation of the observations validated by the social network,
10
http://www.landcover.org
the ultimate objective of Pl@ntNet is to be able to exploit directly the raw ob-servations sent to the system thanks to their automatic determinations (with-out any human validation). As discussed earlier, a 99% sure determination of the system is more a matter of dreaming, but on the other side, the mas-sive amount of observations could compensate the uncertainty of the produced data (by studying groups of species for instance). An other interesting prop-erty of the automatic identification results is that they are not limited to a single determination per observation. The system actually returns a ranked list of species sorted by decreasing likelihood or confidence score. Depending on the used classifier, the list can even be as long as the number of potential species. The interest of considering several uncertain observations rather than the top-1 prediction is that the identification rate within the top-K species is much higher. Therefore, the content-based identification engine can rather be considered as an effective filter than as a fully automatic classifier. By recov-ering the information of neighboring observations and considrecov-ering groups of species, it might thus be possible to infer much more accurate data. In the end, exploiting massive sets of uncertain observations could even be more effective than exploiting much smaller sets of reliable realizations.
5 Conclusion
The question raised by this article was whether a participatory sensing plat-form like Pl@ntNet could be used as an effective and sustainable ecological surveillance tool. To answer it, we analysed the logs and usage statistics of Pl@ntNet mobile application one year after its first release. This analysis clearly demonstrated the high attractiveness of the approach as well as the potentially huge amounts of botanical observations that could be produced. On the other side, it also highlighted the limitations of the current data flows, in particular the bottleneck of the validation and the urban bias. Fortunately, most of the limitations were shown to be easily tempered in the short-term and solvable in the middle term through reasonable R&D perspectives. Over-all, our conclusion is that upcoming advancements in computer sciences will inevitably lead to the emergence of new participatory sensing approaches al-lowing to measure the dynamics of natural systems. In this regard, we believe Pl@ntNet has made a good start by jointly tackling the taxonomic gap problem and the data production issues. Educational aspects also have an important role to play and innovative collaborative workflows such as Pl@ntNet could overcome the increasing lack of botanical expertise. More generally speaking, Pl@ntNet is involved in a global effort to make living species more question-able and understandquestion-able by anyone.
Acknowledgements This work was funded by the Agropolis Fundation, as part of its first flagship project Pl@ntNet. We would like to thank numerous contributors from Tela Botanica and Pl@ntNet’s network, that share their data and expertise to develop such
infrastructure. Finally we also would like to thank Mrs Lett for his careful reading and helpful comments.
References
1. Bakic, V., Yahiaoui, I., Mouine, S., Ouertani, S.L., Ouertani, W., Verroust-Blondet, A., Go¨eau, H., Joly, A., et al.: Inria imedia2’s participation at imageclef 2012 plant identification task. In: CLEF (Online Working Notes/Labs/Workshop) 2012 (2012) 2. Boom, B.J., He, J., Palazzo, S., Huang, P.X., Beyan, C., Chou, H.M., Lin, F.P.,
Spamp-inato, C., Fisher, R.B.: A research tool for long-term and continuous analysis of fish assemblage in coral-reefs using underwater camera footage. Ecological Informatics 23, 83–97 (2014)
3. Burke, J.A., Estrin, D., Hansen, M., Parker, A., Ramanathan, N., Reddy, S., Srivastava, M.B.: Participatory sensing. Center for Embedded Network Sensing (2006)
4. Cai, J., Ee, D., Pham, B., Roe, P., Zhang, J.: Sensor network for the monitoring of ecosystem: Bird species recognition. In: Intelligent Sensors, Sensor Networks and In-formation, 2007. ISSNIP 2007. 3rd International Conference on, pp. 293–298. IEEE (2007)
5. Caputo, B., Muller, H., Thomee, B., Villegas, M., Paredes, R., Zellhofer, D., Goeau, H., Joly, A., Bonnet, P., Gomez, J.M., et al.: Imageclef 2013: the vision, the data and the open challenges. In: Information Access Evaluation. Multilinguality, Multimodality, and Visualization, pp. 250–268. Springer (2013)
6. Deblauwe, V., Couteron, P., Bogaert, J., Barbier, N.: Determinants and dynamics of banded vegetation pattern migration in arid climates. Ecological monographs 82(1), 3–21 (2012)
7. Duan, K., Parikh, D., Crandall, D., Grauman, K.: Discovering localized attributes for fine-grained recognition. In: Computer Vision and Pattern Recognition (CVPR), 2012 IEEE Conference on, pp. 3474–3481. IEEE (2012)
8. Go¨eau, H., Bonnet, P., Barbe, J., Bakic, V., Joly, A., Molino, J.F., Barthelemy, D., Boujemaa, N.: Multi-organ plant identification. In: Proceedings of the 1st ACM inter-national workshop on Multimedia analysis for ecological data, pp. 41–44. ACM (2012) 9. Go¨eau, H., Bonnet, P., Joly, A., Affouard, A., Bakic, V., Barbe, J., Dufour, S., Selmi, S., Yahiaoui, I., Vignau, C., et al.: Pl@ ntnet mobile 2014: Android port and new features. In: Proceedings of International Conference on Multimedia Retrieval, p. 527. ACM (2014)
10. Go¨eau, H., Bonnet, P., Joly, A., Baki´c, V., Barbe, J., Yahiaoui, I., Selmi, S., Carr´e, J., Barth´el´emy, D., Boujemaa, N., et al.: Pl@ ntnet mobile app. In: Proceedings of the 21st ACM international conference on Multimedia, pp. 423–424. ACM (2013)
11. Go¨eau, H., Bonnet, P., Joly, A., Bakic, V., Barthelemy, D., Boujemaa, N., Molino, J.F., et al.: The imageclef 2013 plant identification task. In: CLEF (2013)
12. Go¨eau, H., Bonnet, P., Joly, A., Barthelemy, D., Boujemaa, N., Molino, J.: The imageclef 2012 plant image identification task. ImageCLEF 2012 Working Notes (2012) 13. Go¨eau, H., Bonnet, P., Joly, A., Boujemaa, N., Barthelemy, D., Molino, J.F., Birnbaum,
P., Mouysset, E., Picard, M., et al.: The imageclef 2011 plant images classi cation task. In: ImageCLEF 2011, pp. 0–0 (2011)
14. Go¨eau, H., Joly, A., Selmi, S., Bonnet, P., Mouysset, E., Joyeux, L., Molino, J.F., Birnbaum, P., Bathelemy, D., Boujemaa, N.: Visual-based plant species identification from crowdsourced data. In: Proceedings of the 19th ACM international conference on Multimedia, pp. 813–814. ACM (2011)
15. Hijmans, R.J., Cameron, S.E., Parra, J.L., Jones, P.G., Jarvis, A.: Very high resolution interpolated climate surfaces for global land areas. International journal of climatology 25(15), 1965–1978 (2005)
16. Joly, A., Buisson, O.: Logo retrieval with a contrario visual query expansion. In: Pro-ceedings of the 17th ACM international conference on Multimedia, pp. 581–584. ACM (2009)
17. Joly, A., Go¨eau, H., Bonnet, P., Baki´c, V., Barbe, J., Selmi, S., Yahiaoui, I., Carr´e, J., Mouysset, E., Molino, J.F., et al.: Interactive plant identification based on social image data. Ecological Informatics (2013)
18. Joly, A., Go¨eau, H., Glotin, H., Spampinato, C., Bonnet, P., Vellinga, W.P., Planque, R., Rauber, A., Fisher, R., M¨uller, H.: Lifeclef 2014: Multimedia life species identifica-tion challenges. In: Informaidentifica-tion Access Evaluaidentifica-tion. Multilinguality, Multimodality, and Interaction, pp. 229–249. Springer (2014)
19. Kumar, N., Belhumeur, P.N., Biswas, A., Jacobs, D.W., Kress, W.J., Lopez, I.C., Soares, J.V.: Leafsnap: A computer vision system for automatic plant species identification. In: Computer Vision–ECCV 2012, pp. 502–516. Springer (2012)
20. Mikulik, A., Perdoch, M., Chum, O., Matas, J.: Learning vocabularies over a fine quan-tization. International journal of computer vision 103(1), 163–175 (2013)
21. Mun, M., Reddy, S., Shilton, K., Yau, N., Burke, J., Estrin, D., Hansen, M., Howard, E., West, R., Boda, P.: Peir, the personal environmental impact report, as a platform for participatory sensing systems research. In: Proceedings of the 7th international conference on Mobile systems, applications, and services, pp. 55–68. ACM (2009) 22. Philbin, J., Chum, O., Isard, M., Sivic, J., Zisserman, A.: Object retrieval with large
vocabularies and fast spatial matching. In: Computer Vision and Pattern Recognition, 2007. CVPR’07. IEEE Conference on, pp. 1–8. IEEE (2007)
23. S´anchez, J., Perronnin, F., Akata, Z.: Fisher Vectors for Fine-Grained Visual Categoriza-tion. In: FGVC Workshop in IEEE Computer Vision and Pattern Recognition (CVPR). IEEE, Colorado Springs, ´Etats-Unis (2011). URL http://hal.inria.fr/hal-00817681 24. Smeaton, A.F., O’Connor, E., Regan, F.: Multimedia information retrieval and envi-ronmental monitoring: Shared perspectives on data fusion. Ecological Informatics 23, 118–125 (2014)
25. Spampinato, C., Giordano, D., Di Salvo, R., Chen-Burger, Y.H.J., Fisher, R.B., Nadara-jan, G.: Automatic fish classification for underwater species behavior understanding. In: Proceedings of the first ACM international workshop on Analysis and retrieval of tracked events and motion in imagery streams, pp. 45–50. ACM (2010)
26. Torres, M., Qiu, G.: Automatic habitat classification using image analysis and random forest. Ecological Informatics 23, 126–136 (2014)
27. Yao, B., Khosla, A., Fei-Fei, L.: Combining randomization and discrimination for fine-grained image categorization. In: Computer Vision and Pattern Recognition (CVPR), 2011 IEEE Conference on, pp. 1577–1584. IEEE (2011)