HAL Id: hal-02652654
https://hal.inrae.fr/hal-02652654
Submitted on 29 May 2020
HAL is a multi-disciplinary open access
archive for the deposit and dissemination of
sci-entific research documents, whether they are
pub-lished or not. The documents may come from
teaching and research institutions in France or
abroad, or from public or private research centers.
L’archive ouverte pluridisciplinaire HAL, est
destinée au dépôt et à la diffusion de documents
scientifiques de niveau recherche, publiés ou non,
émanant des établissements d’enseignement et de
recherche français ou étrangers, des laboratoires
publics ou privés.
phenol stress using Solexa sequencing technology
Chuanwang Cao, Zhiying Wang, Changying Niu, Nicolas Desneux, Xiwu Gao
To cite this version:
Chuanwang Cao, Zhiying Wang, Changying Niu, Nicolas Desneux, Xiwu Gao. Transcriptome profiling
of Chironomus kiinensis under phenol stress using Solexa sequencing technology. PLoS ONE, Public
Library of Science, 2013, 8 (3), pp.e58914. �10.1371/journal.pone.0058914�. �hal-02652654�
Phenol Stress Using Solexa Sequencing Technology
Chuanwang Cao1, Zhiying Wang1, Changying Niu2, Nicolas Desneux3, Xiwu Gao4*
1 Department of Forest Protection, Northeast Forestry University, Harbin, China, 2 Hubei Key Laboratory of Utilization of Insect Resources and Sustainable Control of Pests, Huazhong Agricultural University, Wuhan, China,3 French National Institute for Agricultural Research (INRA), Sophia-Antipolis, France, 4 Department of Entomology, China Agricultural University, Beijing, China
Abstract
Phenol is a major pollutant in aquatic ecosystems due to its chemical stability, water solubility and environmental mobility. To date, little is known about the molecular modifications of invertebrates under phenol stress. In the present study, we used Solexa sequencing technology to investigate the transcriptome and differentially expressed genes (DEGs) of midges (Chironomus kiinensis) in response to phenol stress. A total of 51,518,972 and 51,150,832 clean reads in the phenol-treated and control libraries, respectively, were obtained and assembled into 51,014 non-redundant (Nr) consensus sequences. A total of 6,032 unigenes were classified by Gene Ontology (GO), and 18,366 unigenes were categorized into 238 Kyoto Encyclopedia of Genes and Genomes (KEGG) categories. These genes included representatives from almost all functional categories. A total of 10,724 differentially expressed genes (P value ,0.05) were detected in a comparative analysis of the expression profiles between phenol-treated and control C. kiinensis including 8,390 upregulated and 2,334 downregulated genes. The expression levels of 20 differentially expressed genes were confirmed by real-time RT-PCR, and the trends in gene expression that were observed matched the Solexa expression profiles, although the magnitude of the variations was different. Through pathway enrichment analysis, significantly enriched pathways were identified for the DEGs, including metabolic pathways, aryl hydrocarbon receptor (AhR), pancreatic secretion and neuroactive ligand-receptor interaction pathways, which may be associated with the phenol responses of C. kiinensis. Using Solexa sequencing technology, we identified several groups of key candidate genes as well as important biological pathways involved in the molecular modifications of chironomids under phenol stress.
Citation: Cao C, Wang Z, Niu C, Desneux N, Gao X (2013) Transcriptome Profiling of Chironomus kiinensis under Phenol Stress Using Solexa Sequencing Technology. PLoS ONE 8(3): e58914. doi:10.1371/journal.pone.0058914
Editor: Michael A. Thomas, Idaho State University, United States of America
Received September 28, 2012; Accepted February 8, 2013; Published March 20, 2013
Copyright: ß 2013 Cao et al. This is an open-access article distributed under the terms of the Creative Commons Attribution License, which permits unrestricted use, distribution, and reproduction in any medium, provided the original author and source are credited.
Funding: This study was partly supported by Natural Science Foundation of China (31101676); Harbin Science and Technology Innovation Talents Special Foundation (2010RFQXS055) and State Key Laboratory of Environmental Chemistry and Ecotoxicology, Research Center for Eco-Environmental Sciences, Chinese Academy of Sciences (KF-2008-23). The funders had no role in study design, data collection and analysis, decision to publish, or preparation of the manuscript. Competing Interests: The authors have declared that no competing interests exist.
* E-mail: gaoxiwu@263.net.cn
Introduction
Phenol, which comprises a benzene ring connected to a hydroxyl group, is commonly used in the production of dyes, polymers, drugs and other organic substances, such as pesticides, plastics and explosives [1,2]. Phenol and its derivatives are widespread in aquatic ecosystems due to the runoff of water (containing pesticides and/or fertilizer residues) from agricultural fields into streams, as well as runoff from industrial and city waste sewage [3,4]. As phenol and its derivatives are stable over the long term and are usually environmentally mobile, these compounds are considered to be major pollutants and acute and chronic toxicants. For example, phenol and its derivatives produce neurotoxic effects and cause liver and kidney damage and respiratory disorders [5–7]. The critical toxic concentration of phenol established by regulatory agencies varies widely worldwide, e.g., 105.24mM in Malaysia [8], 10.63mM in the United States [9] and 1.06mM in Australia [10].
Phenol contamination of water ecosystems has serious environ-mental consequences due to the damaging effects of this compound on aquatic organisms [11,12] such as algae and aquatic animals [13]. The importance of detecting the presence of
phenol derivatives and assessing their impact on biota is acknowledged worldwide. As a result, a range of methodologies has been adopted. Direct chemical analysis is important due to the accuracy of this method, but direct chemical analysis has drawbacks, e.g., the requirement for complex sample pretreat-ment, expensive chemicals and expensive equipment [14]. In addition, this approach does not reveal temporal changes in exposure and/or the possible interactive effects of pollutants, nor does it provide ecologically relevant information [15]. To compensate for these limitations, various biological assays have been developed, including assays using aquatic animals, to provide information about pollutant-induced toxic effects and thereby assess environmental risks [16].
Midges, which belong to the chironomidae family, are among the most abundantly distributed groups of insects that can be used as bioindicators in freshwater ecosystems. Midges have a relatively short life cycle, which is mainly spent at the aquatic larval stage. In addition, midges are relatively sensitive to aquatic contaminants. Therefore, midges have been used extensively for acute, chronic and life-cycle bioassays in freshwater systems. Previous studies have demonstrated the effects of heavy metals [17] and pesticides [18–21] on the physiological, biochemical and molecular status of
midges. Recently, we studied the impact of some substituted benzenes on chironomid populations at the ecological and biochemical levels [22,23]. However, the cellular and molecular responses of chironomids to organic pollutants, especially for substituted benzenes, have rarely been studied.
Recently enhanced DNA sequencing platforms, such as the high-throughput Solexa/Illumina Genome Analyzer, provide a powerful method for assessing the relative importance of gene products in a given cell, tissue or organism [24,25]. Cellular identity and function are determined by analyzing the transcrip-tome, i.e., the complete repertoire of RNA transcripts. The Solexa technique for transcriptome analysis can provide new information about whole-genome-wide transcript expression without prior sequence knowledge. This technique has been used to investigate human and mammalian diseases and functional genomics in plants and insects [26,27]. Solexa transcriptome analysis of insects is a reliable and precise way to study genomic characteristics during development [28–31].
This is the first study in which transcriptome profiling analysis of Chironomus kiinensis was performed using RNA-sequencing (RNA-seq), and the identification of differentially expressed genes (DEGs) was used to gain a deeper understanding of the molecular toxicity of phenol. We used transcriptional profiling to identify key groups of genes and pathways that are differentially regulated in C. kiinensis under phenol stress. This study was performed to determine the molecular modifications of insects in response to phenol contamination in aquatic ecosystems.
Materials and Methods
Experimental midge rearing and sample preparation
The aquatic midge Chironomus kiinensis was obtained from Shenzhen Municipal Water Affairs Bureau and cultured using standard protocols with slight modifications [32]. Briefly, instead of collecting and separating egg masses, the midges were reared in mixed-age cultures in a glass chamber containing dechlorinated tap water and acid-washed sand with aeration (2062uC and L16:D8) and fed goldfish granule food (Beijing SanYou Beauti-fication Free TECH. CO., LTD, China). Healthy fourth-instar larvae of a similar size and color were used for the phenol stress tests. To obtain chironomid gene expression profiles, phenol stress and control cDNA samples were prepared from fourth larval C. kiinensis and sequenced using the Solexa platform. The larvae were collected with a pipette (visualized under a microscope) and transferred to a 1 L beaker containing 500 mL 10mmol/L of phenol solution (or 500 mL dechlorinated tap water for the control). One hundred larvae were employed in each of three phenol treatment replicates and in the control over a period of 24 h. Fifteen surviving midges were randomly selected from each replicate for RNA preparation.
RNA isolation and Solexa sequencing
Total RNA was isolated using an RNeasy Mini Kit (Qiagen) following the manufacturer’s guidelines and treated with RNase free DNase I (Qiagen). RNA concentrations were measured using a spectrophotometer, and the RNA integrity was checked by analysis on a 1.0% (w/v) agarose gel. In brief, mRNA was purified from total RNA (a mixture of RNA from three replicates at equal ratios) using poly-T oligo magnetic beads and broken into small pieces using divalent cations at 94uC for 5 min. The first strand cDNA was synthesized using random primers, with cleaved mRNA fragments serving as templates. This process was followed by second-strand cDNA synthesis using DNA polymerase I and RNaseH. Illumina Solexa sequencing using the GAII platform was
performed at the Beijing Genomics Institute (BGI; Shenzhen, China).
Sequence assembly
Reads were assembled using Trinity [33]. The longest assembled sequences were referred to as contigs. The reads were then mapped back to contigs with paired-end reads to detect contigs from the same transcript and the distances between these contigs. Finally, sequences were obtained that lacked Ns and could not be extended on either end. Such sequences were defined as unigenes. The predicted amino acid sequences encoded by unigenes were aligned with sequences in protein databases such as NCBI Nr database, the Swiss-Prot Protein database, the KEGG pathway database and the Cluster of Orthologous Groups (COG) database using BLASTx (E-value,0.00001). Sequence orienta-tions were determined according to the best match in the database. If the results from different databases conflicted with each other, a priority order of Nr, Swiss-Prot, KEGG and COG was followed when deciding the sequence direction of the unigenes. Orientation and protein coding region prediction (CDS) of sequences having no hits in BLAST were predicted using ESTScan [34]. Original transcript sequences (59-.39) were provided if their orientations could be determined. Other sequences were provided by the assembler outputs.
Sequence annotation
Unigene annotations provide functional annotations for all unigenes, along with their expression levels. Functional annota-tions of unigenes were analyzed using protein sequence similarity, KEGG Pathway, COG and GO analysis. All unigene sequences were against the protein databases (Nr, SwissProt, KEGG, COG) using BLASTx (E-value,0.0001). Protein function information could be predicted from annotations of the most similar proteins in the databases. The KEGG pathway database records networks of molecular interactions in the cells, and variants of these pathways are specific to particular organisms. COG is a database where orthologous gene products are classified. The assumption is that every protein has evolved from an ancestor protein, and the entire database is built on coding proteins with complete genomes as well as system evolutionary relationships between bacteria, algae and eukaryotes. All unigenes were aligned to the COG database to predict and classify their possible functions. GO functional annotation was obtained from Nr annotation. GO annotation comprises three ontologies, i.e., a molecular function, a cellular component and a biological process. The basic GO unit is a GO-term, and every GO-term belongs to a type of ontology. Using Nr annotation, the Blast2GO program was used to obtain GO annotations of all of the unigenes [35,36]. Blast2GO has been cited more than 150 times in other reports and is a widely recognized GO annotation program. After obtaining GO anno-tation for every unigene, Web Gene Ontology Annoanno-tation Plot (WEGO) software was used to carry out GO functional classification for all unigenes and to characterize the distribution of gene functions in the species gene functions at the macro level [37].
Digital gene expression library preparation and analysis
Gene expression levels were calculated using the Reads Per kb per Million reads (RPKM) method [38]. Unigene expression levels were calculated according to the formula RPKM = (1,000,000*C) / (N*L*1,000), where RPKM (A) represents the expression of gene A, C is the number of reads that uniquely aligned to gene A, N is the total number of reads that uniquely aligned to all genes and L is the number of bases in gene A. The RPKM method succeeded
in eliminating the influences of different gene lengths and sequencing discrepancy on the calculation of gene expression level. Therefore, the calculated gene expression level could be used to directly compare the level of gene expression among samples. If there was more than one transcript for a given gene, the longest transcript was used to calculate its expression level and coverage. To identify DEGs between phenol-treated and control samples, the false discovery rate (FDR) method was used to determine the
threshold of P-value in multiple tests [39]. The significance of difference in gene expression was judged using a threshold FDR#0.001 and an absolute value of log2Ratio$1. Then, the
genes expressed at different levels across samples were further annotated by GO enrichment analysis and KEGG pathway enrichment analysis.
Table 1. Primers used in Real-time RT-PCR.
Gene number Forward primer (59-39) Reverse primer (59-39) U18403 TTGTGAACGAGCAGGAACGAGT GTCGTTATCCATGCGTGTTGTG
U9085 AACCATCGTTTCATGCCGTCCA GCATCATCTTCATCAACGCAGC
U19940 CAATTTATCAACGCCGGTCCGA TCATCACAATCTGGATTCATGTCAGT U20077 AGACACAACAACATCCTCGCCA TCCTGTGTGTGTGTGTGTGTTC U19007 CATTCTCTTCGCAACAATGATGCTT AAGCTTTGTTTGCTCGGACTCACC U14484 GGACCTGCAAAGGAGGAGAATA GCTGGAGGCACTGCGATTCAATTA U17324 ATCGTTTGCCGCACGAAATCCT AATTGTGTCCTGTACGCCCGTT U18859 TAGTTTGCTTGTCATGTCCGGTCC CCCGAAGGATCGGAATGTTTGT U10424 AGCGATGGCCGATATGGAAGAA ACTGTTGTAAGCACTCGAACCC U13743 TGTCGCATCGGACAACAATCCA CAAGCATCTTCAGCGGGTCTTT
U6658 TGCTCGTTCTTGCTGACTGTGT TTGGTGAATGGCCCAGTTGGAT
U449 GCTCAAGCATGATCTGGAAACC TGTGTATGCTCTTGTGCTCCCA
U3979 TTCACCACCAGCACAGAGTTGA GCCAGTCTGCTTGCCATTAAGT
U6040 ATTTGGCATTGGAGTTGGGACC ACTCATCAACCCACCCTCAACA
U3434 TCGCCCACATGTCTTTGACCAT TGTTTGTCCCATGGGCTGATGT
U1928 TCCATCTTGTGCTCCAACTGCT GACCGCTTAGACTTCATAGAGT
U7314 CGCTGTGGTCATTGACGAGAAT GCTAGAGATCGATCATTGCCTG
U7204 ATTGCTGGCTTCACCATCACCT CGTCAGCAACGCAGCAAAGTTG
U6065 ATGCTGTTGAGGGTGGCAATGA ACCTCTTGCGTTGACCCATCTA
U1488 AGGGTGCCTCGACCTTCTTCA TCTGGATGTTGGTGGTGTCCAA
Actin AATGGGATCGCTTGGGTGCTTT TCAGCTTCACCCAATGTTGCCT
TAU TGGTGGCGACAAGCGCATTATT TGGCGTTATAGGAACCGGATGT
doi:10.1371/journal.pone.0058914.t001
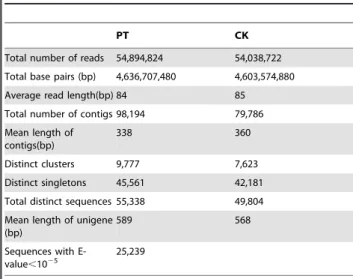
Table 2. Summary for the Chironomus kiiensis transcriptome in phenol treated (PT) and control (CK) libraries.
PT CK
Total number of reads 54,894,824 54,038,722 Total base pairs (bp) 4,636,707,480 4,603,574,880 Average read length(bp) 84 85 Total number of contigs 98,194 79,786 Mean length of
contigs(bp)
338 360
Distinct clusters 9,777 7,623 Distinct singletons 45,561 42,181 Total distinct sequences 55,338 49,804 Mean length of unigene
(bp)
589 568
Sequences with
E-value,1025 25,239
doi:10.1371/journal.pone.0058914.t002
Table 3. Length distribution of non-redundant consensus sequences.
Length of non-redundant
unigenes Total Number Percentage
100–500 30,336 59.47% 500–1000 10,714 21.00% 1000–1500 4,350 8.53% 1500–2000 2,294 4.50% .= 2000 3,320 6.50% All unigenes 51,014 Length of all unigenes (nt) 37044122
N50 (bp) * 1137
Mean Size (bp)** 726
*N50 = median length of all unigenes; **Mean size = average length of all unigenesGO and COG classification
Real-time RT-PCR analysis
Approximately 1mg of total RNA was reverse transcribed to cDNA using 1mM of oligodeoxythymidine primer. The synthe-sized cDNAs were diluted to 100mL with sterile water and used as the template for real-time PCR. Twenty genes that showed expression differences (ten upregulated genes and ten downregu-lated genes) between the two libraries were randomly selected for validation. The primer sequences are listed in Table 1. Real-time RT-PCR was performed in an MJ OpticonTM2machine (Bio-Rad, Hercules, CA, USA). The actin and TAU genes were chosen as internal controls to normalize the amount of total RNA present in each reaction. The reaction mixture (20mL) contained 10mL of SYBR Green Realtime PCR Master Mix (Toyobo), 0.5mM each of forward and reverse primers and 2mL of cDNA template (equivalent to 100 ng of total RNA). The amplifications were performed with the following parameters: 94uC for 30 s followed by 45 cycles at 94uC for 12 s, 60uC for 30 s, 72uC for 40 s and 82uC for 1 s for plate reading. A melting curve was generated for each sample at the end of each run to assess the purity of the amplified products. Real-time PCR was carried out in triplicate (technical repeats) to ensure the reproducibility of the results. The expression levels of the clones were calculated from the threshold cycle according to the delta-delta CT method [40]. The relative expression level was calculated by dividing the transcription level under phenol stress conditions by the transcription level under
control conditions. All of the relative expression levels were log2 transformed.
Results
Tag identification and quantification
After cleaning and quality checks, we obtained 51,518,972 reads with a mean length of 84 bp for the phenol treatment library (PT) and 51,150,832 million reads with a mean length of 85 bp for the control library (CK). These raw reads were further assembled into contigs using Trinity software, resulting in 98,194 contigs with a mean length of 338 bp and 79,786 contigs with a mean length of 360 bp in the PT and CK libraries, respectively (Table 2). The size distribution of these contigs is shown in Fig. S1. In this study, we obtained 55,338 unigenes with a mean length of 589 bp for the PT library and 49,804 unigenes with a mean length of 568 bp for the CK library.
Annotation of predicted proteins
For annotation, distinct gene sequences were first searched using BLASTx against the non-redundant (Nr) NCBI nucleotide database, with a cut-off E-value of 1025. Using this approach, 25,239 genes (87.39% of all distinct sequences) returned an above cut-off BLAST result (Table S1). Table 3 indicates that the proportion of shorter assembled sequences with matches in the Nr database was greater than that in the other databases. A total of
Figure 1. GO annotations of non-redundant consensus sequences. Best hits were aligned to the GO database, and 6032 transcripts were assigned to at least one GO term. Most consensus sequences were grouped into three major functional categories, namely biological process, cellular component, and molecular function.
59.47% of the matches were observed for sequences ranging from 100 to 500 bp, whereas the match efficiency decreased to 21.00% for those ranging from 500 to 1,000 bp and 6.51% for sequences longer than 2,000 bp (Table 3).
GO assignments were used to classify the functions of the predicted C. kiinensis genes. Based on sequence homology, 6,032 sequences were categorized into 51 functional groups (Fig. 1). To further evaluate the completeness of the transcriptome library and the effectiveness of the annotation process, we searched the annotated sequences for the genes involved in COG classifications. In total, 9,758 sequences had COG classifications (Fig. 2). Among the 25 COG categories, the cluster for ‘‘General function prediction’’ represented the largest group (17.82%), followed by ‘‘Transcription’’ (7.99%) and ‘‘Translation, ribosomal structure and biogenesis’’ (7.49%; Fig. 2). These functional annotations provide valuable information that helps elucidate the biological processes, functions and pathways employed by C. kiinensis in response to phenol stress.
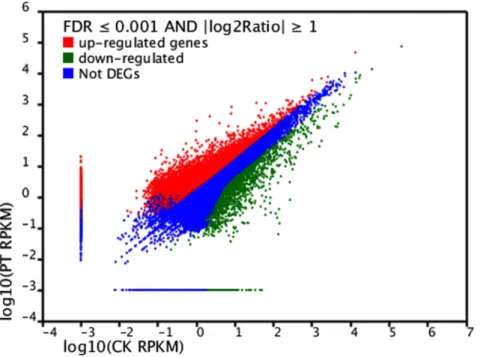
Comparison of DEG level between the two libraries
Differences in the tag frequencies appearing in the PT and CK libraries were used to estimate the gene expression levels in response to phenol stress. The transcripts detected with at least two-fold differences (FDR,0.001 AND |log2Ratio|$1) in the two
libraries are shown in Fig. 3. The red dots (8,390) and green dots (2,334) represent transcripts with higher or lower abundance
(more than two-fold), respectively, in the CK library. The blue dots represent transcripts that differed less than two-fold between the two libraries, which were arbitrarily designated as ‘‘no difference in expression’’. The DEGs with five-fold or greater differences in accumulation are shown in Fig. 4. A total of 3,121 genes exhibited increased expression of at least five-fold in the PT library, while 1,139 genes exhibited at least a five-fold decrease in expression in the PT library compared with the CK library. The expression levels of 60.28% of the unique tags were within a five-fold difference in range between the PT and CK libraries. DEGs with differences greater than 20-fold are showed in Table S2. Finally, 176 upregulated and 294 downregulated genes in the PT library exhibited a 20-fold difference in expression compared with those in the CK library.
Real-time RT-PCR analysis
To validate the Solexa expression profiles, 20 genes were randomly selected for transcript levels analysis. Among these, ten genes (U18403, U9085, U19940, U20077, U19007, U14484, U17324, U18859, U10424 and U13743) were upregulated, and ten genes (U6658, U449, U3979, U6040, U3434, U1928, U7314, U7204, U6065 and U1488) were downregulated (Table 4). Actin and TAU, reported to be stably expressed in insects, were chosen as reference genes for data normalization. The trend of RT-PCR based expression profiles among these selected genes was similar to those detected by the Solexa-sequencing based method. However,
Figure 2. COG annotations of putative proteins. All putative proteins were aligned to the COG database and can be classified functionally into at least 25 molecular families.
the scale of the differences in expression between genes in the PT and CK libraries detected by real-time PCR was generally smaller than that detected by the Solexa sequencing-based method (Table 4).
Pathways enrichment analysis of DEGs
To identify the biological pathways in C. kiinensis, we mapped the 8,146 annotated sequences to the reference canonical pathways in KEGG. In total, we assigned 18,366 sequences to 238 KEGG pathways. Significantly enriched metabolic pathways and signal transduction pathways were identified. A total of 238 pathways were affected by 5,091 upregulated DEGs and 3,055 downregulated DEGs (Table S3). Pathways with Q value ,0.05 were significantly enriched. DEG enrichment analysis showed that
the first three pathways involving upregulated genes (in response to phenol stress) were metabolic pathway (336), regulation of actin cytoskeleton (106) and focal adhesion (91). By contrast, the first three pathways involving in downregulated genes were metabolic pathways (283), pancreatic secretion (122) and protein digestion and absorption (101; Table S3). These annotations provide a valuable resource for investigating specific processes, functions and pathways for further research of chironomids under phenol stress.
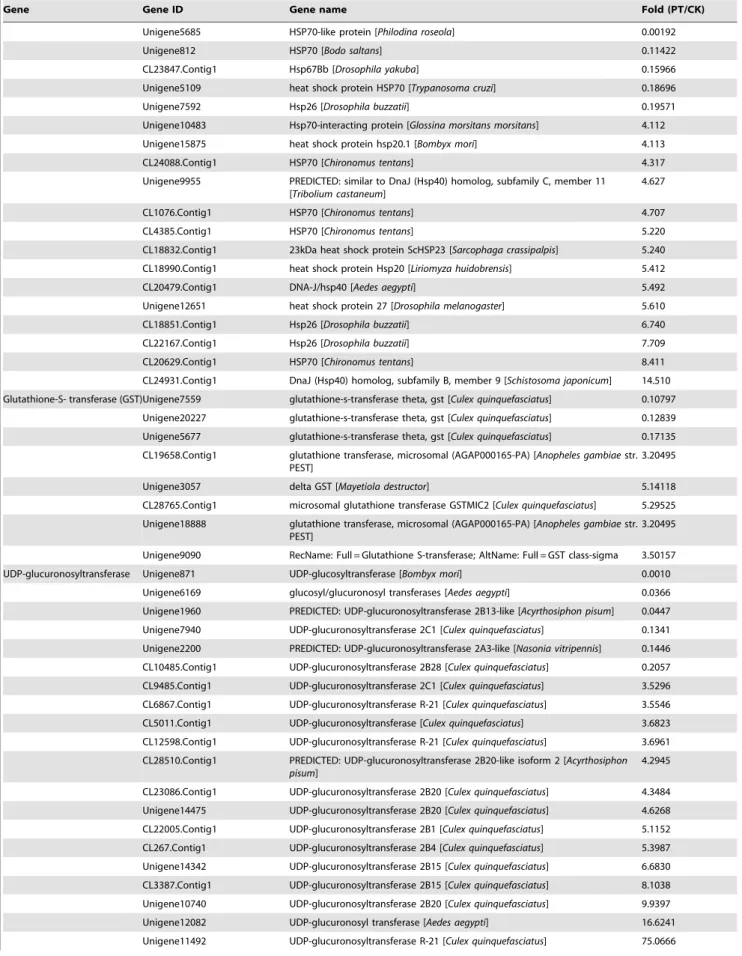
AhR-mediated defense genes associated with phenol stress
The aryl hydrocarbon receptor (AhR) is a soluble, ligand-dependent transcription factor that belongs to the basic helix-loop-helix-PAS family of regulatory proteins. AhR regulates the
Figure 3. Comparison of gene expression level between the two libraries. For comparing gene expression level between the two libraries, each library was normalized to 1 million tags. Red dots represent transcripts more prevalent in the phenol treatment library, green dots show those present at a lower frequency in the infected tissue and blue dots indicate transcripts that did not change significantly. The parameters ‘‘FDR,0.001’’ and ‘‘log2 Ratio$1’’ were used as the threshold to judge the significance of gene expression difference.
doi:10.1371/journal.pone.0058914.g003
Figure 4. Differentially expressed genes in phenol tissue library. The ‘‘X’’ axis represents fold-change of DEGs in the PT library. The ‘‘y’’ axis represents the number of unique tags (log 10).
expression of defense genes in invertebrates in response to organic pollutants. However, in invertebrates, proteins encoded by genes with functions similar to that of AhR, including spineless (Ss) and single-minded (Sim), can heterodimerize with the aryl hydrocarbon receptor nuclear translocator (ARNT) ortholog tango (Tgo) to regulate the expression of downstream genes. Interestingly, DEG analysis revealed a battery of AhR genes that showed different levels of induction or inhibition under phenol stress. AhR homolog spineless (Ss) and ARNT ortholog tango (Tgo) in PT library showed 1.85- and 2.53-fold increased expression in the PT library vs. the CK library, respectively. Moreover, three AhR ortholog single-minded genes were also induced, but not significantly, in the PT library compared with the CK library. Some AhR-mediated downstream genes were significantly induced or inhibited in the PT library. For example, 28 P450 genes were downregulated in the PT library (ranging from 4-fold to 5,000-fold downregulation), while sixteen of these genes were upregulated in the PT library (ranging from 12-fold to 1229-fold upregulation). Twenty-two genes encoding heat shock proteins (HSPs) showed a four-fold difference in expression in the PT library vs. the CK library, including 8 downregulated HSPs genes and 14 up-regulated HSPs genes. Among 26 genes encoding UDP glucuronosyltransferase, six were downregulated in the PT library (ranging from 4.9 to 1,000-fold), while 20 genes were upregulated (ranging from 3.5 to 239.9-fold; Table 5).
Discussion
Phenol, also known as carbolic acid or phenic acid, is a strong neurotoxin. Exposure to phenol can cause instant death, as it shuts down the neural transmission systems [14]. Phenol can induce harmful effects on the central nervous system and heart, causing dysrhythmia, seizures and ultimately, a coma [41]. Moreover,
exposure to phenol through skin contact or by inhalation and is toxic, as phenol is corrosive to the eyes, skin and respiratory tract, and exposure can lead to lung edema [42]. In this study, we identified multiple DEGs and signal pathways involved in the responses to short-term exposure to phenol in an aquatic arthropod model, C. kiinensis.
AhR pathway associated with phenol stress
AhR is a member of the family of basic helix-loop-helix (bHLH) transcription factors [43]. The physiological ligands of AhR are unknown, but this transcription factor can bind to several exogenous ligands such as plant flavonoids and synthetic polycyclic aromatic hydrocarbons. AhR is a cytosolic transcription factor that is normally inactive (i.e., bound to several molecular chaperones). When the ligand is bound to chemicals such as 2,3,7,8-tetrachlorodibenzo-p-dioxin (TCDD), the chaperones dissociate, and AhR translocates into the nucleus and dimerizes with ARNT. This leads to changes in gene transcription. Both mammalian and arthropod proteins belong to the bHLH-PAS class of proteins, which have a bHLH DNA binding domain, a Per-ARNT-Sim (PAS) protein-protein interaction and ligand-binding domains [44–46]. In the developmental pathway of insects, the AhR orthologs, spineless (Ss) and single-minded (Sim), heterodimerize with the ARNT ortholog tango (Tgo) in the cytosol without binding to a ligand. These heterodimers translocate to the nucleus where Ss/Tgo preferentially binds to XRE–AhR, and Sim/Tgo binds to the central midline element (CME). To date, six downstream genes regulated by AhR have been found in vertebrates, including genes encoding CYP1A1, CYP1A2, NAD(P)H: quinone oxidore-ductase, aldehyde dehydrogenase 3, UDP glucuronosyltransferase and glutathione transferase [47–50]. In this study, we identified a set of genes in C. kiinensis, i.e., genes encoding AhR orthologs (Ss and Sim) and ARNT ortholog (Tgo), that are similar to mammalian Table 4. Genes selected for Real-time RT-PCR.
Gene number Description RT-PCR fold Solexa fold
U18403 Cytochrome b561 domain-containing protein 1 [Harpegnathos saltator] 8.8 13.9 U9085 glutathione s-transferase [Chironomus riparius] 10.6 13.0 U19940 melanization protease 1, isoform C [Drosophila melanogaster] 11.9 12.3 U20077 T-cell receptor beta chain ANA 11 [Brugia malayi] 3.1 11.8 U19007 sodium/solute symporter [Culex quinquefasciatus] 8.8 11.4 U14484 sodium/shloride dependent amino acid transporter [Aedes aegypti] 6.5 11.0 U17324 environmental stress-induced protein [Culex quinquefasciatus] 1.7 9.9
U18859 cytochrome P450 349A1 [Tribolium castaneum] 9.3 8.9
U10424 transmembrane and coiled-coil domains protein 1 [Culex quinquefasciatus] 3.1 4.8 U13743 N-acetyl lactosaminide beta-1,3-N-acetyl glucosaminyl transferase [Culex quinquefasciatus] 3.1 4.5
U6658 alkaline phosphatase [Culex quinquefasciatus] 23. 2 25.1
U449 nicotinic acetylcholine receptor, beta-2 subunit [Culex quinquefasciatus] 22.4 25.3
U3979 Serine protease easter [Harpegnathos saltator] 24.9 29.5
U6040 lung carbonyl reductase [Aedes aegypti] 26.0 210.0
U3434 S-phase kinase-associated protein 1 [Bubalus bubalis] 28.2 210.3 U1928 leucine-rich transmembrane protein [Aedes aegypti] 29.1 210.6 U7314 N-acetyl galactosaminyl transferase 6 [Culex quinquefasciatus] 27.1 211.7 U7204 voltage gated chloride channel domain-containing protein [Toxoplasma gondii ME49] 22.3 212.1
U6065 CG3884, isoform C [Drosophila melanogaster] 28.4 213.9
U1488 Wiskott-Aldrich syndrome, like [Danio rerio] 26.4 215.6
Table 5. AhR-mediated defense genes associated with phenol stress.
Gene Gene ID Gene name Fold (PT/CK)
Aryl hydrocarbon receptor (AhR)
CL682.Contig1 Ahr homolog spineless [Drosophila melanogaster] 1.851
Unigene5384 tango [Drosophila melanogaster] 2.533
Cytochrome P450 Unigene1523 cytochrome P450 6BK11 [Tribolium castaneum] 0.000205 Unigene7608 Cyp313a1 [Drosophila melanogaster] 0.000450 Unigene4583 cytochrome p450-like protein [Leishmania braziliensis MHOM/BR/75/M2904] 0.00148 Unigene4751 cytochrome P450-28A1 [Drosophila mettleri] 0.00156 Unigene2527 PREDICTED: cytochrome P450 2B19-like [Xenopus (Silurana) tropicalis] 0.00157 Unigene4608 cytochrome P450 reductase C [Trypanosoma cruzi] 0.00190 Unigene2199 cytochrome P450 [Aedes aegypti] 0.00318 Unigene414 cytochrome P450 93A3 [Culex quinquefasciatus] 0.011 Unigene5277 cytochrome P450 [Culex pipiens pallens] 0.015 CL2881.Contig1 cytochrome P450 [Aedes aegypti] 0.065 CL3766.Contig1 cytochrome P450 4d8 [Culex quinquefasciatus] 0.066
Unigene1681 cytochrome P450 [Aedes aegypti] 0.073
Unigene4988 cytochrome P450 [Aedes aegypti] 0.098
Unigene1854 cytochrome P450 [Aedes aegypti] 0.108
CL8733.Contig1 cytochrome P450 [Aedes aegypti] 0.109 CL14278.Contig1 corpora allata cytochrome P450 [Diploptera punctata] 0.114
Unigene8409 cytochrome P450 [Aedes aegypti] 0.126
Unigene4683 cytochrome P450 [Aedes aegypti] 0.129
CL12023.Contig1 cytochrome P450 [Aedes aegypti] 0.135 CL16912.Contig1 cytochrome P450 4d8 [Culex quinquefasciatus] 0.140 CL1838.Contig1 cytochrome P450 [Aedes aegypti] 0.166 Unigene16823 cytochrome P450 CYP4D4v2 [Musca domestica] 0.171 Unigene2056 cytochrome P450 6d3 [Culex quinquefasciatus] 0.171 CL15542.Contig1 cytochrome P450 [Culex pipiens pallens] 0.173 Unigene13399 PREDICTED: cytochrome P450 307a1 [Apis mellifera] 0.176 CL2051.Contig1 cytochrome P450 [Aedes aegypti] 0.194
Unigene682 cytochrome P450 [Aedes aegypti] 0.229
CL5447.Contig1 Cytochrome P450 6B3 [Acromyrmex echinatior] 0.248 Unigene19789 cytochrome P450 26B1 [Culex quinquefasciatus] 11.654 Unigene19547 cytochrome P450 CYP6Z2 [Anopheles gambiae] 12.335 Unigene13715 cytochrome P450 6a22 [Culex quinquefasciatus] 22.615 Unigene17385 cytochrome P450 [Anopheles gambiae] 24.161 Unigene9177 cytochrome P450 CYP6Z2 [Anopheles gambiae] 28.790 Unigene11217 cytochrome P450 CYP6Z2 [Anopheles gambiae] 41.124 CL24894.Contig1 cytochrome P450 [Aedes aegypti] 51.357 Unigene18455 cytochrome P450 [Anopheles minimus] 61.185 CL16599.Contig1 cytochrome P450 [Leptinotarsa decemlineata] 71.546 Unigene6768 cytochrome P450 [Aedes aegypti] 170.296 Unigene10912 cytochrome P450 [Aedes aegypti] 177.196 Unigene18859 cytochrome P450 349A1 [Tribolium castaneum] 463.010 Unigene16330 cytochrome P450 6BK11 [Tribolium castaneum] 499.105 Unigene12383 cytochrome P450 4d8 [Culex quinquefasciatus] 825.200 Unigene9491 cytochrome P450 [Aedes aegypti] 913.018 Unigene8827 cytochrome P450 6a22 [Culex quinquefasciatus] 1228.771 Heat shock protein (HSP) Unigene3437 heat shock protein cognate 1, isoform A [Drosophila melanogaster] 0.00066
Unigene4224 Hsp70 protein [Mitsukurina owstoni] 0.00088 Unigene2422 stress protein HSP70-1 [Xiphophorus maculatus] 0.00104
Table 5. Cont.
Gene Gene ID Gene name Fold (PT/CK)
Unigene5685 HSP70-like protein [Philodina roseola] 0.00192
Unigene812 HSP70 [Bodo saltans] 0.11422
CL23847.Contig1 Hsp67Bb [Drosophila yakuba] 0.15966 Unigene5109 heat shock protein HSP70 [Trypanosoma cruzi] 0.18696
Unigene7592 Hsp26 [Drosophila buzzatii] 0.19571
Unigene10483 Hsp70-interacting protein [Glossina morsitans morsitans] 4.112 Unigene15875 heat shock protein hsp20.1 [Bombyx mori] 4.113
CL24088.Contig1 HSP70 [Chironomus tentans] 4.317
Unigene9955 PREDICTED: similar to DnaJ (Hsp40) homolog, subfamily C, member 11 [Tribolium castaneum]
4.627
CL1076.Contig1 HSP70 [Chironomus tentans] 4.707
CL4385.Contig1 HSP70 [Chironomus tentans] 5.220
CL18832.Contig1 23kDa heat shock protein ScHSP23 [Sarcophaga crassipalpis] 5.240 CL18990.Contig1 heat shock protein Hsp20 [Liriomyza huidobrensis] 5.412
CL20479.Contig1 DNA-J/hsp40 [Aedes aegypti] 5.492
Unigene12651 heat shock protein 27 [Drosophila melanogaster] 5.610
CL18851.Contig1 Hsp26 [Drosophila buzzatii] 6.740
CL22167.Contig1 Hsp26 [Drosophila buzzatii] 7.709
CL20629.Contig1 HSP70 [Chironomus tentans] 8.411
CL24931.Contig1 DnaJ (Hsp40) homolog, subfamily B, member 9 [Schistosoma japonicum] 14.510 Glutathione-S- transferase (GST)Unigene7559 glutathione-s-transferase theta, gst [Culex quinquefasciatus] 0.10797
Unigene20227 glutathione-s-transferase theta, gst [Culex quinquefasciatus] 0.12839 Unigene5677 glutathione-s-transferase theta, gst [Culex quinquefasciatus] 0.17135 CL19658.Contig1 glutathione transferase, microsomal (AGAP000165-PA) [Anopheles gambiae str.
PEST]
3.20495 Unigene3057 delta GST [Mayetiola destructor] 5.14118 CL28765.Contig1 microsomal glutathione transferase GSTMIC2 [Culex quinquefasciatus] 5.29525 Unigene18888 glutathione transferase, microsomal (AGAP000165-PA) [Anopheles gambiae str.
PEST]
3.20495 Unigene9090 RecName: Full = Glutathione S-transferase; AltName: Full = GST class-sigma 3.50157 UDP-glucuronosyltransferase Unigene871 UDP-glucosyltransferase [Bombyx mori] 0.0010
Unigene6169 glucosyl/glucuronosyl transferases [Aedes aegypti] 0.0366 Unigene1960 PREDICTED: UDP-glucuronosyltransferase 2B13-like [Acyrthosiphon pisum] 0.0447 Unigene7940 UDP-glucuronosyltransferase 2C1 [Culex quinquefasciatus] 0.1341 Unigene2200 PREDICTED: UDP-glucuronosyltransferase 2A3-like [Nasonia vitripennis] 0.1446 CL10485.Contig1 UDP-glucuronosyltransferase 2B28 [Culex quinquefasciatus] 0.2057 CL9485.Contig1 UDP-glucuronosyltransferase 2C1 [Culex quinquefasciatus] 3.5296 CL6867.Contig1 UDP-glucuronosyltransferase R-21 [Culex quinquefasciatus] 3.5546 CL5011.Contig1 UDP-glucuronosyltransferase [Culex quinquefasciatus] 3.6823 CL12598.Contig1 UDP-glucuronosyltransferase R-21 [Culex quinquefasciatus] 3.6961 CL28510.Contig1 PREDICTED: UDP-glucuronosyltransferase 2B20-like isoform 2 [Acyrthosiphon
pisum]
4.2945 CL23086.Contig1 UDP-glucuronosyltransferase 2B20 [Culex quinquefasciatus] 4.3484 Unigene14475 UDP-glucuronosyltransferase 2B20 [Culex quinquefasciatus] 4.6268 CL22005.Contig1 UDP-glucuronosyltransferase 2B1 [Culex quinquefasciatus] 5.1152 CL267.Contig1 UDP-glucuronosyltransferase 2B4 [Culex quinquefasciatus] 5.3987 Unigene14342 UDP-glucuronosyltransferase 2B15 [Culex quinquefasciatus] 6.6830 CL3387.Contig1 UDP-glucuronosyltransferase 2B15 [Culex quinquefasciatus] 8.1038 Unigene10740 UDP-glucuronosyltransferase 2B20 [Culex quinquefasciatus] 9.9397 Unigene12082 UDP-glucuronosyl transferase [Aedes aegypti] 16.6241 Unigene11492 UDP-glucuronosyltransferase R-21 [Culex quinquefasciatus] 75.0666
AhR pathway genes. Similarly, a battery of AhR genes was found to be either upregulated or downregulated in C. kiiensis under phenol stress. These results indicate that the AhR pathway in chironomids may be involved in the response to phenol stress and thus may be an important biological pathway. However, further studies are needed to investigate the regulatory role of the AhR pathway in insects facing phenol stress.
Pancreas pathway and phenol stress
The pancreas performs both exocrine and endocrine functions. The exocrine pancreas is composed of two functional parts, the acinar and duct cells. The primary functions of pancreatic acinar cells are to synthesize and secrete digestive enzymes. Stimulation of the cells by secretagogs such as acetylcholine (ACh) and cholecystokinin (CCK) creates an intracellular Ca2+signal. This signal, in turn, triggers the fusion of the zymogen granules with the apical plasma membrane, leading to polarized enzyme secretion. The major task of pancreatic duct cells is the secretion of fluids and
Table 5. Cont.
Gene Gene ID Gene name Fold (PT/CK)
Unigene19976 UDP-glucuronosyltransferase 2B20 [Culex quinquefasciatus] 283.4008 Unigene5157 Methylmalonate-semialdehyde dehydrogenase [Salmo salar] 0.00209 Unigene3952 alcohol dehydrogenase class-3 [Oryctolagus cuniculus] 0.093 CL27274.Contig1 aldehyde dehydrogenase [Aedes aegypti] 2.806 Unigene19683 acyl-CoA synthetase family member 4 [Mus musculus] 4.884 Unigene17726 formaldehyde dehydrogenase [Drosophila melanogaster] 239.902 NADH-Ubiquinone
oxidoreductase
Unigene3047 NADH-ubiquinone oxidoreductase NDUFS3/30 kDa subunit [Glossina morsitans morsitans]
0.176 Unigene4631 NADH-Ubiquinone oxidoreductase AGGG subunit [Pediculus humanus corporis] 0.206 Unigene6983 NADH-Ubiquinone oxidoreductase AGGG subunit [Pediculus humanus corporis] 0.309 Unigene21733 NADH-plastoquinone oxidoreductase [Aedes aegypti] 2.111 CL4001.Contig1 RecName: Full = NADH-ubiquinone oxidoreductase chain 5; AltName:
Full = NADH dehydrogenase subunit 5
2.654 CL2952.Contig1 PREDICTED: quinone oxidoreductase-like [Nasonia vitripennis] 2.970 CL15165.Contig1 NADH-ubiquinone oxidoreductase chain 2 [Simulium nigrimanum] 3.085 doi:10.1371/journal.pone.0058914.t005
Table 6. Genes in pancreatic secretion pathway.
Description Gene symbol Ratio
Ras-related C3 botulinum toxin substrate 2 precursor
Rac2 23323.07
RAS-like protein Rap 21437.25
Pancreatic lipase-related protein 1-like PLRP1 24.90 Pancreatic lipase-related protein PLRP 23.48 SLC4-like anion exchanger AE 2.24 Adenylyl cyclase 35C, isoform A AC35 2.81
Protein kinase C PKC 3.48
Adenylate cyclase type 9 AC9 3.52
Adenylate cyclase AC 3.73
RAB8A, member RAS oncogene family Rabs 4.25 doi:10.1371/journal.pone.0058914.t006
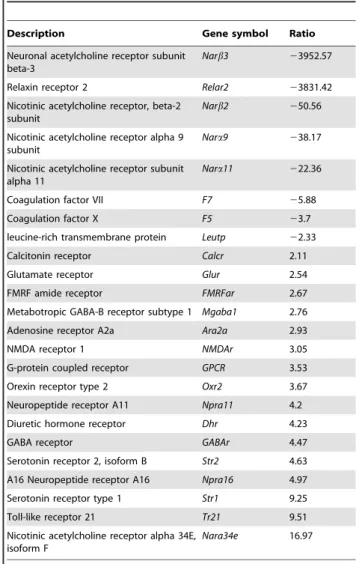
Table 7. Genes in neuroactive ligand-receptor interaction pathways.
Description Gene symbol Ratio
Neuronal acetylcholine receptor subunit beta-3
Narb3 23952.57 Relaxin receptor 2 Relar2 23831.42 Nicotinic acetylcholine receptor, beta-2
subunit
Narb2 250.56 Nicotinic acetylcholine receptor alpha 9
subunit
Nara9 238.17 Nicotinic acetylcholine receptor subunit
alpha 11
Nara11 222.36 Coagulation factor VII F7 25.88
Coagulation factor X F5 23.7
leucine-rich transmembrane protein Leutp 22.33 Calcitonin receptor Calcr 2.11
Glutamate receptor Glur 2.54
FMRF amide receptor FMRFar 2.67 Metabotropic GABA-B receptor subtype 1 Mgaba1 2.76 Adenosine receptor A2a Ara2a 2.93
NMDA receptor 1 NMDAr 3.05
G-protein coupled receptor GPCR 3.53 Orexin receptor type 2 Oxr2 3.67 Neuropeptide receptor A11 Npra11 4.2 Diuretic hormone receptor Dhr 4.23
GABA receptor GABAr 4.47
Serotonin receptor 2, isoform B Str2 4.63 A16 Neuropeptide receptor A16 Npra16 4.97 Serotonin receptor type 1 Str1 9.25 Toll-like receptor 21 Tr21 9.51 Nicotinic acetylcholine receptor alpha 34E,
isoform F
Nara34e 16.97
bicarbonate ions (HCO32), which neutralize the acidity of gastric
contents entering the duodenum. An increase in intracellular cAMP is one of the major signals of HCO3
2
pancreatic secretion. Activation of the CFTR Cl2channel and CFTR-dependent Cl2/ HCO3
2
exchange activities is responsible for cAMP-induced HCO3
2
secretion. Thus, pancreatic secretion is another important pathway in the biological process category. In this study, we found that 87 upregulated genes and 122 downregulated genes by phenol stress are involved in the pancreatic secretion process (Table 6). Among these DEGs, Ras-related C3 botulinum toxin substrate 2 precursor (Rac2) and RAS-like protein were significantly inhibited by phenol compared with the control. Rac 2 protein belongs to the GTP-binding proteins of the Rho family; there is an alternating regulatory cycle between the active GTP-bound form and the inactive GDP-bound form of Rac 2. This cycle involves three distinct families of proteins, i.e., guanine exchange factors (GEFs), GTPase-activating proteins (GAPs) and guanine nucleotide dissociation inhibitors (GDIs). Upon loading GTP, a conforma-tional change takes place that allows Rac2 protein to interact with several downstream effectors. Ultimately, this information is processed, and the signal is propagated the signal within the cell, causing changes to the actin cytoskeleton, the release of inflammatory modulators and innate immunity. The signaling of active Rac2 is mediated through its interaction with effectors such as p67phox and cytochrome b-558 [51], PLCbeta2 [52], nitric oxide synthase 2 (NOS2) [53] and Pak1 [54]. Expression is
restricted to hematopoietic cells, with the highest levels of expression in myeloid cells. Rac2 expression is regulated during the differentiation of hematopoietic and myeloid cells, and some data suggest that Rac2 might be expressed in tumors. As suggested by its restricted expression, Rac2 plays a specialized role in many hematopoietic and immunological processes. Rac2-deficient mice show defects in stem cells, mast cells and B and T cells.
The neuroactive ligand-receptor interaction pathway is associated with phenol stress
The neuroactive ligand-receptor interaction pathway, which comprises a collection of receptors located on the plasma membranes, is involved in the transduction of signals from the extracellular environment into cells [55]. The neuroactive ligand-receptor interaction pathway was significantly affected under phenol stress, and this pathway may be associated with physio-logical and neuronal functions. In addition, 89 genes that were upregulated by phenol stress, and 83 genes that were downreg-ulated by phenol stress, are involved in this pathway, as determined by KEGG analysis. Among these genes, 21 genes encoding receptors were significantly affected by phenol stress (Table 7). The neuroactive ligand-receptor interaction pathway can be divided into four subclasses according to the ligand structures, including class A (rhodopsin-like), class B (secretin-like), class C (metabotropic glutamate/pheromone) and channels/other receptors [56]. Phenol upregulated the expression of genes encoding class A amide receptors include the following: FMRFar,
Str2, Str1, Npra11 and Npra16. In addition, phenol affected the expression of four genes encoding class B receptors, including Relar2, Calcr, Oxr2 and Dhr. Most genes encoding receptors that were affected by phenol were in ‘‘channels or other receptors’’ category, including Narb3, Narb2, Nara9, Nara11, Mgaba1, Ara2a, NMDAr, GPCR, GABAr, Tr21, Nara34e, Narb3, Narb2, Nara9, Nara11, Mgaba1, Ara2a, NMDAr, GPCR, GABAr, Tr21 and Nara34e. Analysis of the transcriptome showed that phenol affects 238 pathways in chironomid larvae. Among these pathways, the neuroactive ligand-receptor interaction pathway is an attractive target for further study because multiple receptors on the plasma membranes associated with cell signaling are located in this pathway. Bioamine is an important neurotransmitter that interacts with receptors to regulate some important biological functions, i.e., physiological rhythms, internal secretion, emotion, learning and memory [57]. In the neuroactive ligand-receptor interaction pathway, the nicotinic acetylcholine receptors were significantly affected by phenol. Nicotinic acetylcholine receptors (nAChRs) are cholinergic receptors that form ligand-gated ion channels in the plasma membranes of certain neurons and on the postsynaptic side of the neuromuscular junction. In insect nervous systems, nAChRs are the targets of insecticides such as neonicotinoid insecticides [58–59]. Under phenol stress, four genes encoding nAChRs subunits, including Narb3, Narb2, Nara9 and Nara11, were downregulated, while Nara34e was upregulated, which demonstrates that phenol can alter nervous-related func-tions.Therefore, when harmful side effects of phenol are triggered in aquatic organisms, the neuroactive ligand-receptor interaction pathway may play important regulatory roles. However, further research using microarray and PCR technology is needed to confirm these results.
Supporting Information
Figure S1 Size distribution of Solexa sequencing contigs inC. kiiensis transcriptome.
(TIF)
Table S1 Top BLAST hits from NCBI nr database. BLAST results against the NCBI nr database for all the distinct sequences with a cut-off Evalue above 1025are shown.
(XLS)
Table S2 List of DEGs changed for 20 fold and more in PT library.
(XLS)
Table S3 Pathways enrichment for up-regulated and down-regulated DEGs.
(DOC)
Author Contributions
Conceived and designed the experiments: XWG. Performed the experiments: CWC ZYW. Analyzed the data: CWC CYN ND. Wrote the paper: CWC ND CYN.
References
1. Rice-Evans CA, Packer L (1998) Flavonoids in Health and Disease,Marcel Dekker Inc, New York..
2. Wang X, Dong Y, Wang L, Han S (2001) Acute toxicity of substituted phenols to Rana japonica tadpoles and mechanism-based quantitative structure-activity relationship (QSAR) study. Chemosphere 44: 447–455.
3. Devillers J (2004) Linear versus nonlinear QSAR modeling of the toxicity of phenol derivatives to Tetrahymena pyriformis. SAR QSAR Environ Res 15: 237– 249.
4. Michałowicz J, Duda W (2007) Phenols-Sources and Toxicity. Polish J Environ Stud 16(3): 347–362.
5. Barber JT, Sharma HA, Ensley HE, Polito MA, Thomas DA (1995) Detoxification of phenol by the aquatic angiosperm, Lemna gibba. Chemosphere, , 31(6): 3567–3574.
6. Kar S, Harding AP, Roy K, Popelier PLA (2010) QSAR with quantum topological molecular similarity indices: toxicity of aromatic aldehydes to Tetrahymena pyriformis, SAR QSAR Environ Res 21:149–168.
7. Zhu H, Tropsha A, Fourches D, Varnek A, Papa E, et al. (2008) Combinatorial QSAR modeling of chemical toxicants tested against Tetrahymena pyriformis, J Chem Inf Model 48: 766–784.
8. DOE-MU (1986) Water quality criteria and standards for Malaysia. Vol. 4-Criteria and Standards for Organic Constituents (prepared by Goh, S.H., Yap, S.Y., Lim, R.P.) DOE. Malaysia/IPT.University of Malaysia, 224
9. USEPA (2009) National recommended water quality criteria.Washington,D-Washington,DC:Office of water,Office of Science and Technology.
10. AWRC (1984) Australian Water Research Council (AWRC), Australian Water Quality Criteria for Organic Compounds. Australian Water Research Council Technical Paper. No. 82, Canberra, 224.
11. Maleki A, Zazoli MA, Eslami A (2005) Adsorption of phenol by commercial powdered activated carbon in aqueous solution. Al-Haitham J Sci Technol 1: 73–78.
12. Maleki S, Seyyednejad SM, Damabi NM, Motamedi H (2008) Antibacterial activity of the fruits of Iranian Torilis leptophylla against some clinical pathogens. Pak J Biol Sci 11:1286–1289.
13. Stom DI, Roth R (1981) Some effects of polyphenols on aquatic plants I. Toxicity of phenols in aquatic plants. Bull. Environ. Contam Toxicol 27: 332–337. 14. Park JS, Brown MT, Han T (2012) Phenol toxicity to the aquatic macrophyte
Lemna paucicostata. Aquat Toxicol 106–107:182–188.
15. Suresh Kumar K, Han Taejun (2010) Physiological response of Lemna species to herbicides and its probable use in toxicity testing. Toxicol Environ Health Sci 2(1): 39–49.
16. Eullaffroy P, Vernet G (2003) The F684/F735 chlorophyll fluorescence ratio: a potential tool for rapid detection and determination of herbicide phytotoxicity in algae. Water Res 37 (9):1983–1990.
17. Wilczek G, Kramarz P, Babczyn´ska A (2003) Activity of carboxylesterase and glutathione S-transferase in different life-stages of carabid beetle (Poecilus cupreus) exposed to toxic metal concentrations. Comp Biochem Physiol C 134 (4):501– 512.
18. Ibrahim H, Kheir R, Helmi S, Lewis J, Crane M (1998) Effects of organophosphorus, carbamate, pyrethroid and organochlorine pesticides, and a heavy metal on survival and cholinesterase activity of Chironomus riparius Meigen. Bull Environ Contam Toxicol 60: 448–455.
19. Crane M, Sildanchandra W, Kheir R, Callaghan A (2002) Relationship between biomarker activity and developmental endpoints in Chironomus riparius Meigen exposed to an organophosphate insecticide. Ecotox Environ Safe 53(3): 361– 369.
20. Faria MS, Nogueira AJA, Soares AMVM (2007) The use of Chironomus riparius larvae to assess effects of pesticides from rice fields in adjacent freshwater ecosystems. Ecotox Environ Safe 67(2): 218–226.
21. Schuler LJ, Trimble AJ, Belden JB, Lydy MJ (2005) Joint toxicity of triazine herbicides and organophosphate insecticides to the midge Chironomus tentans. Arch Environ Contam Toxicol 49(2): 173–177.
22. Ge SL, Cao CW, Fang GF, Wang ZY (2011) Responses of biological markers of larval Propsilocerus akamusi to phenol. Chin J Appl Ecol 22(7): 1900–1906. (in chinese)
23. Ge SL, Cao CW, Wang ZY (2011) Effects of tree kinds of pesticides on protein content and AchE activity of Propsilocerus akamusi larvae. J Northeast Forestry Univ .39(1):108–109,126
24. Ansorge WJ (2009) Next-generation DNA sequencing techniques. N Biotechnol 25:195–203.
25. Han X, Wu X, Chung WY, Li T, Nekrutenko A, et al. (2009) Transcriptome of embryonic and neonatal mouse cortex by high-throughput RNA sequencing. Proc Natl Acad Sci USA 106(31): 12741–12746.
26. Morozova O, Marra MA (2008) Applications of next-generation sequencing technologies in functional genomics. Genomics 92(5): 255–264.
27. Morozova O, Hirst M, Marra MA (2009) Applications of new sequencing technologies for transcriptome analysis. Annu Rev Genomics Hum Genet 10: 135–151.
28. Wang L, Feng Z, Wang X, Wang X, Zhang X (2010) DEGseq: An R package for identifying differentially expressed genes from RNA-seq data. Bioinformatics 26:136–138.
29. Graveley BR, Brooks AN, Carlson JW, Duff MO, Landolin JM, et al. (2010) The developmental transcriptome of Drosophila melanogaster. Nature 471: 473–479. 30. Chen S, Yang P, Jiang F, Wei Y, Ma Z, et al. (2010) De Novo Analysis of
transcriptome dynamics in the migratory locust during the development of phase traits. PLoS ONE 5(12): e15633. doi:10.1371/journal.pone.0015633. 31. Lu Y, Pang YP, Park Y, Gao X, Yao J, et al. (2012) Genome organization,
phylogenies, expression patterns, and three-dimensional protein models of two acetycholinesterase genes from the red flour beetle. PLoS ONE 7(2): e32288. doi:10.1371/journal.pone.0032288.
32. USEPA (2000) Methods for measuring the toxicity and bioaccumulation of sediment-associated contaminants with freshwater invertebrates, 2nd ed, EPA600/R-99/064.Office of Research and Development, Duluth MN 33. Grabherr MG, Haas BJ, Yassour M, Levin JZ, Thompson DA, et al. (2011)
Full-length transcriptome assembly from RNA-Seq data without a reference genome. Nat Biotechnol 29: 644–652.
34. Iseli C, Jongeneel CV, Bucher P (1999) ESTScan: a program for detecting, evaluating, and reconstructing potential coding regions in EST sequences. Proc Int Conf Intell Syst Mol Biol 138–48.
35. Conesa A, Go¨tz S, Garcı´a-Go´mez JM, Terol J, Talo´n M, et al. (2005) Blast2go: a universal tool for annotation, visualization and analysis in functional genomics research. Bioinformatics 21: 3674–3676.
36. Go¨tz S, Garcı´a-Go´mez JM, Terol J, Williams TD, Nagaraj SH, et al. (2008) High-throughput functional annotation and data mining with the Blast2Go suite. Nucleic Acids Res 36(10): 3420–3435.
37. Ye J, Fang L, Zheng HK, Zhang Y, Chen J, et al. (2006) WEGO: a web tool for plotting GO annotations. Nucleic Acids Res 34: 293–297.
38. Mortazavi A, Williams BA, McCue K, Schaeffer L, Wold B (2008) Mapping and quantifying mammalian transcriptomes by RNA-seq. Nat Methods 5: 621–628. 39. Audic S, Claverie JM (1997) The significance of digital gene expression profiles.
Genome Res 7: 986–995.
40. Pfaffl MW, Horgan GW, Dempfle L (2002) Relative expression software tool (REST) for group-wise comparison and statistical analysis of relative expression results in real-time PCR. Nucleic Acids Res 30:36.
41. Warner MA, Harper JV (1985) Cardiac dysrhythmias associated with chemical peeling with phenol. Anesthesiol 62 (3): 366–367.
42. Budavari, S; ed. The Merck Index: An Encyclopedia of Chemical, Drugs, and Biologicals. Whitehouse Station, NJ: Merck. 1996.
43. Nebert DW, Roe AL, Dieter MZ, Solis WA, Yang Y, Dalton TP (2000) Role of the aromatic hydrocarbon receptor and [Ah] gene battery in the oxidative stress response, cell cycle control, and apoptosis. Biochem Pharmacol 59 (1): 65–85. http://en.wikipedia.org/wiki/Digital_object_identifier
44. Crews ST, Fan CM (1999) Remembrance of things PAS: Regulation of development by bHLH-PAS proteins. Curr Opin Genet Dev 9: 580–587. 45. Denison MS, Pandini A, Nagy SR, Baldwin EP, Bonati L (2002) Ligand binding
and activation of the Ah receptor. Chem BioL Interact 141: 3–24.
46. Hahn ME (2002) Aryl hydrocarbon receptors: diversity and evolution. Chem BioL Interact 141: 131–160.
47. Hankinson O (1995) The aryl hydrocarbon receptor complex. Annu Rev Pharmacol Toxicol 35:307–340.
48. Swanson HI, Bradfield CA (1993) The AH-receptor genetics, structure and function. Pharmacogenetics 3: 213–230.
49. Nebert DW (1989) The Ah locus: genetic differences in toxicity, cancer, mutation, and birth defects. Crit Rev Toxicol 20: 153–174.
50. Nerbert DW, Roe AL, Dieter MZ, Solis WA, Yang Y, et al. (2000) Role of the aromatic hydrocarbon receptor and [Ah] gene battery in the oxidative stress response, cell cycle control, and apoptosis. Biochem Pharmaocol 59: 65–85. 51. Diebold BA, Bokoch GM (2001) Molecular basis for Rac2 regulation of
phagocyte NADPH oxidase. Nat Immunol 2: 211–215.
52. Piechulek T, Rehlen T, Walliser C, Vatter P, Moepps B, et al. (2005) Isozyme-specific stimulation of phospholipase C-gamma2 by Rac GTPases. J Biol Chem 280: 38923–38931.
53. Kuncewicz T, Balakrishnan P, Snuggs MB, Kone BC (2001) Specific association of nitric oxide synthase-2 with Rac isoforms in activated murine macrophages. Am J Physiol Renal Physiol 281: 326–336.
54. Carstanjen D, Yamauchi A, Koornneef A, Zang H, Filippi MD, et al. (2005) Rac2 regulates neutrophil chemotaxis, superoxide production, and myeloid colony formation through multiple distinct effector pathways. J Immunol 174: 4613–4620.
55. Lauss M, Krieqner A, Vierlinger K, Noehammer C (2007) Characterization of the drugged human genome. Pharmacogenomics 8: 1063–1073.
56. Su SY, Hsieh CL, Wu SL, Cheng WY, Li CC, et al. (2009) Transcriptomic analysis of Egb 761-regulated neuroactive receptor pathway in vivo. J Ethnopharmacol 123: 68–73.
57. Vernier P, Cardinaud B, Valdenaire O, Philippe H, Vincent JD (1995) An evolutionary view of drug-receptor interaction: the bioamine receptor family. Trends Pharmacol Sci 16 (11): 375–381.
58. Desneux N, Decourtye A, Delpuech JM (2007). The sublethal effects of pesticides on beneficial arthropods. Ann Rev Entom 52:81–106.
59. Tan Y, Biondi A, Desneux N, Gao XW (2012) Assessment of physiological sublethal effects of imidacloprid on the mirid bug Apolygus lucorum (Meyer-Du¨r). Ecotoxicol 21:1989–1997.