HAL Id: inria-00472423
https://hal.inria.fr/inria-00472423
Submitted on 6 Aug 2010
HAL is a multi-disciplinary open access
archive for the deposit and dissemination of
sci-entific research documents, whether they are
pub-lished or not. The documents may come from
teaching and research institutions in France or
abroad, or from public or private research centers.
L’archive ouverte pluridisciplinaire HAL, est
destinée au dépôt et à la diffusion de documents
scientifiques de niveau recherche, publiés ou non,
émanant des établissements d’enseignement et de
recherche français ou étrangers, des laboratoires
publics ou privés.
Map Preservation in Dynamic Graphs
Daniel Archambault, Helen Purchase, Bruno Pinaud
To cite this version:
Daniel Archambault, Helen Purchase, Bruno Pinaud.
Animation, Small Multiples, and the
Ef-fect of Mental Map Preservation in Dynamic Graphs.
IEEE Transactions on Visualization and
Computer Graphics, Institute of Electrical and Electronics Engineers, 2011, 17 (4), pp.539-552.
�10.1109/TVCG.2010.78�. �inria-00472423�
Animation, Small Multiples, and the Effect of
Mental Map Preservation in Dynamic Graphs
Daniel Archambault Member, IEEE , Helen C. Purchase, and Bruno Pinaud
Abstract—In this paper, we present the results of a human computer interaction experiment that compared the performance of the
animation of dynamic graphs to the presentation of small multiples and the effect that mental map preservation had on the two conditions. Questions used in the experiment were selected to test both local and global properties of graph evolution over time. The data sets used in this experiment were derived from standard benchmark data sets of the information visualization community. We found that small multiples gave significantly faster performance than animation overall and for each of our five graph comprehension tasks. In addition, small multiples had significantly more errors than animation for the tasks of determining sets of nodes or edges added to the graph during the same timeslice, although a positive time-error correlation coefficient suggests that, in this case, faster responses did not lead to more errors. This result suggests that, for these two tasks, animation is preferable if accuracy is more important than speed. Preserving the mental map under either the animation or the small multiples condition had little influence in terms of error rate and response time.
Index Terms—Dynamic Graph Drawing, Small Multiples, Animation, Mental Map Preservation, Evaluation
F
1
I
NTRODUCTIONDynamic graph drawing deals with the problem of depicting a graph that evolves over time. Dynamic graph drawing algorithms typically represent the evolving graph as a series of timeslices. A timeslice encodes the structure of the graph at a given time. The timeslices, also known as the sequence of graphs, are often placed in chronological order, demonstrating graph evolution.
The majority of dynamic graph drawing algorithms have been designed with an animation of the sequence of graphs as their output in mind ([4], [12], [15], [25]). In an animation of a dynamic graph sequence, the positions of nodes are interpolated between timeslices and nodes that have been added or removed are faded in or out of the drawing.
At the same time, the notion of preserving the mental map is often mentioned as a desirable feature of dynamic graph drawing algorithms. A dynamic graph drawing algorithm that preserves the mental map ([11], [23]) attempts to keep the same overall shape to the diagram while moving as few nodes as possible as little as possible. For animation, mental map preservation seems to make sense as the user does not need to spend as much time keeping track of nodes, thus facilitating readability. However, recent experiments suggest that mental map preservation may not play as significant a factor as previously anticipated ([27], [29]).
In the information visualization community, small multiples has been in use for many years to display dynamically evolving data. In a small multiples approach [30], a matrix of images
• Daniel Archambault is with INRIA Bordeaux Sud-Ouest, Gravit´e, E-mail: [email protected]
• Helen C. Purchase is with University of Glasgow, E-mail: [email protected].
• Bruno Pinaud is with Universit´e de Bordeaux I, CNRS UMR 5800 LaBRI, INRIA Bordeaux Sud-Ouest, Gravit´e: [email protected]
shows the differences between objects. In the case of dynamic data, each image in the matrix is a timeslice. Users are able to see and compare all timeslices at the same time. A small multiples approach has been applied to many problems in information visualization [30]. However, it is not often applied to dynamic graph drawing, and, as far as we know, its effectiveness in this domain has yet to be evaluated.
Animating a series of dynamic graphs seems to have the advantage that the entire screen can be devoted to the drawing of the graph. Also, it seems that animating transitions between timeslices may help users understand how the graph structure evolves. However, only one timeslice can be seen at a time and the user often needs to interact with the system to see how the graph evolves if they wish to change the direction of the animation.
Small multiples seems to have the advantage that all times-lices can be seen at once. However, it may be difficult to understand how the graph evolves between timeslices, because no animated transition exists. Also, the screen space devoted to each drawing of the graph is far less than the entire screen.
In this experiment, our first research question is:
• Which approach, animation or small multiples, is best for
reading graphs that evolve over time?
In addition, we investigate a secondary question:
• Does preserving the mental map help in the readability of
graphs that evolve over time in both animated and small multiples displays?
The contribution of this paper is empirically-based results on the relative worth of animation and small multiples and the effect of the preservation of the mental map. In this experiment, our method of assessing graph readability is based on a range of questions: local questions (e.g. the structure around one or two nodes), connection questions (e.g. paths between nodes), and global questions (e.g. overall structure of
the graph). The data sets were drawn from benchmark data sets established by the information visualization community.
2
P
REVIOUS ANDR
ELATEDW
ORKThe previous work to this experiment is varied and spans at least three research areas. Many researchers in graph drawing have looked at the problem of drawing a series of dynamically evolving graphs with the intended output as an animation. A sample of these algorithms is presented in Section 2.1. Also, there are experiments that have looked at the effect of the mental map on the readability of a sequence of graphs evolving over time. In Section 2.2, we look at these studies. Finally, a variety of research communities have examined the benefits of animation and have compared animation to small multiples. Section 2.3 presents this work. Section 2.4 presents a summary of what we found in previous and related work.
2.1 Dynamic Graph Drawing Algorithms
The field of dynamic graph drawing conveys evolving graphs over time. The majority of these algorithms were developed with the intent that the output of the algorithm would be an animation. However, many of these algorithms could be adapted to present their output with small multiples.
The problem of drawing dynamic graphs and trees has been considered since the early nineties ([9], [24]). North [25] described one of the first dynamic graph drawing algorithms where an evolving directed acyclic graph is drawn in a hierarchical manner. Subsequently, Brandes and Wagner [7] studied dynamic, undirected graph drawing using a Bayesian and force-directed approach. Diehl and G¨org [10] created graph drawing algorithms for dynamically evolving, undi-rected graphs by constructing a supergraph which is drawn beforehand and encodes all graphs of the time sequence. G¨org
et al. [17] also considered dynamically evolving orthogonal and hierarchical drawings of graphs. Erten et al. [12], in their Graphael system, apply a force-directed algorithm to derive animations. In their approach, inter-timeslice edges link the same node across the series of timeslices. The stiffness of these edges can be tuned to limit the movement of nodes and, therefore, adjust how much of the mental map is preserved. Force-directed methods that encode the mental map as a weighting function on the nodes have also been implemented in the information visualization community ([14], [15]). Ad-ditionally, other works have extended spectral graph drawing techniques to dynamic graphs [6], visualized dynamically evolving cluster hierarchies [20], and visualized dynamically evolving computer networks ([4], [5]).
Even though animation has been used extensively in the dynamic graph drawing literature, some dynamic graph visu-alization systems have been designed with a small multiples approach in mind. Chi and Card [8] present a system based on small multiples for the visualization of dynamically evolving web sites. In this work, an interface similar to a spreadsheet presents the evolution of structural and attribute information associated with the nodes and edges. Archambault [1] presents a technique for depicting the structural differences between two graphs using graph hierarchies. In this approach, the union
of two graphs is computed and the nodes and edges that appear in only one graph, the other graph, or both graphs are grouped into metanodes, depicting the evolution of high-level structure in the graph. Although the approach only depicted the structural differences between a pair of graphs, the technique could be extended to visualize a series of timeslices using a small multiples approach.
The majority of these approaches were developed with an animation as the intended output. However, the output of many of these algorithms could be equally represented using small multiples. In our study, we use the approach of Erten et al. [12] as the algorithm handles undirected graphs and has a mental map parameter that is easily tuned by varying the stiffness of inter-timeslice edges.
2.2 Evaluation of Mental Map Preservation
Several studies have focused on determining the effect of the mental map on the readability of dynamic graph drawing algo-rithms, under the assumption that the output is an animation. Purchase et al. [26] presented a study which examined the effect mental map preservation has on dynamic graph drawing readability. In this work, the authors considered dynamically evolving directed acyclic graphs drawn in a hierarchical man-ner using the algorithm of G¨org et al. [17]. The authors found that the mental map was important for questions which required nodes of the graph to be identified by name, but less important for questions that focus on edges or do not require nodes to be differentiated from each other.
Subsequently, Saffrey et al. [29] investigated two new men-tal map preserving dynamic graph layout algorithms. These algorithms were based on force-directed approaches that limit the movement of nodes by geometric restriction. The results of this study suggested that preserving the mental map by restricting node movement can actually be harmful to diagram readability, especially when significant node overlap occurs.
Purchase et al. [27] performed an evaluation of the impor-tance of the mental map in dynamic graph drawing, using Graphael [12]. In this study, the authors compared sequences of graphs exhibiting a high, medium, and low degree of mental map preservation. The study found, surprisingly, that the extremes (high and low mental map preservation) performed better than the medium condition. The authors suggest that this result may be due to the nature of the dynamic graphs used in the experiment, which maintained the same nodes but changed the number of edges significantly between timeslices. With such graphs, the compromise between layout quality and node movement in the medium condition appears to be worse than the high mental map (little node movement), and the low mental map (good layout quality in each timeslice).
In this study, we investigate the effect that preserving the mental map has on dynamic graph readability in both anima-tion and small multiples presentaanima-tions. Using Graphael [12], we test the mental map parameter by comparing performance using a dynamically evolving sequence of graphs that pre-serves the mental map with one that does not.
2.3 The Effectiveness of Animation
Many communities have performed experiments to determine the effectiveness of animation for communicating dynamically evolving data with varying results. This section starts with a brief description of some of the studies reporting on the benefits of animation. Subsequently, we present two recent experiments that compared small multiples and animation directly.
2.3.1 The Benefits of Animation
A number of papers support the idea that animation can be beneficial for the purposes of visualization. Bartram and Ware [3] argued that objects that move similarly, even if they are actually very far apart, tend to be grouped together. Subsequently, Ware et al. [33] provide evidence that similarly moving nodes and edges in a drawing create a pop-out effect from a very large and potentially cluttered background. On the other hand, works such as Tversky et al. [31] have countered many studies which have found animation to be beneficial. However, the work acknowledged that animation may be an effective way of presenting transitions.
2.3.2 Comparing Animation and Small Multiples
Two recent experiments have directly compared small mul-tiples to animation for dynamic data. We describe these experiments below.
Griffen et al. [18] described an experiment that suggests animation can be helpful in discovering space-time clusters. In their experiment, moving clusters of coloured hexagons were represented both using animation and small multiples techniques. The animation depicted the hexagons evolving over time while the small multiples technique showed six timeslices. Their experiment found that animation was sig-nificantly more accurate and faster in detecting these clusters against background noise when compared to small multiples. Robertson et al. [28] compared animation, trace line, and small multiples visualization techniques on multi-dimensional data, similar to the type of data used in the Gapminder pre-sentations of Hans Rosling [16]. In their experiment, various United Nations statistics for several countries were presented using these three techniques. The animation condition pre-sented an animated bubble chart of the data evolving over time. The traces condition mapped out the path of each country during animation. Finally, the small multiples approach placed the trace line of each country inside its own frame. The authors found that animation was the least effective form for analysis. Both small multiples and trace lines were significantly faster than animation, and small multiples was significantly more accurate.
2.4 Summary
Few dynamic graph drawing approaches use a small mul-tiples for the visualization of dynamic graphs, even though small multiples may be more useful than animation for some tasks. Empirical research can help identify those circumstances where small multiples should be used.
If animation is used for visualizing dynamic graphs, there is relatively strong evidence that preserving the mental map does not help task performance, although these results have not been tested with the small multiples approach.
Other studies, using a variety of different data types, show that animation can outperform small multiples, while others claim the opposite. The types of dynamic data tested in these experiments are very different ([18], [28]). Whether or not an approach based on small multiples, animation, or combination of the two is suitable seems to heavily depend on the type of dynamic data being visualized.
3
T
HEE
XPERIMENTIn order to compare animation and small multiples as tech-niques for the visualization of dynamic graphs, as well as gauge the effect of the mental map, we performed a within subject experiment. We performed a 2 condition (animation vs. small multiples) × 2 factor (with vs without mental map) ×2 data set (Threads2 and Vast) × 5 question design1. Our two data sets did not differ substantially in size.
3.1 Experimental Overview
The experiment interface consisted of a single view of the dynamic graph, either an animation view or a small multiples view, and a question on the right hand side of the screen. The question was visible for the duration of the task. As seen in Figs. 1 and 2, four radio buttons appear on the right hand side of the interface. The participants selected a radio button to indicate their answers and then confirmed their response by clicking the button at the bottom of the screen.
All experiments were conducted in the same quiet, window-less room and on the same machine. They were conducted individually, with only the participant and the experimenter present. A thirty inch Apple Cinema display (operating at 1920 × 1440) was used so that graph elements in this data set would be maximally visible.
3.2 Data Sets
We used two standard information visualization data sets in this experiment. Nine timeslices of each were selected from these larger data sets. We found that these nine timeslices were large enough to make the tasks challenging and allowed us to make full use of the screen in the small multiples condition by presenting the data in a 3 × 3 matrix in a way that was still readable. A nine timeslice graph was also still large enough to represent noticeable evolution of information; fewer timeslices would have limited the extent of evolution that could be depicted.
Threads2, used in the work of Frishman and Tal [15], is a graph that represents online newsgroup discussions. Nodes are authors of newsgroup articles, and an edge exists between two authors if one replied to the posting of another. As authors and postings were never deleted, this data set always grows in size. We selected the timeslices one through nine. This data
1. Details of the data sets and questions are presented in Sections 3.2 and 3.5 respectively.
set grows from thirty-six nodes and thirty-five edges to sixty nodes and sixty-eight edges.
The second data set, Vast, is a sample of the cell phone communication network presented as part of the 2008 VAST contest [19]. A node in this graph is a cell phone and an edge connects two nodes if the two cell phones called each other on a particular day. Vast is a selection from this data set found to be particularly interesting by one of the VAST contest participants [34]. We used the final nine timeslices in the data set and randomly inserted and deleted nodes in each of these timeslices. The number of nodes and edges in this data set fluctuates between fifty-nine nodes and fifty-six edges through to twenty-nine nodes and eleven edges.
The participants were not made aware of what Threads2 and Vast actually represented. While it would be interesting to investigate the readability of evolving graphs within the context of real-world domains, neither of our research ques-tions were domain-specific. Thus, there was no need for the domain to play any role in the experiment. We simply chose two data sets each of realistic size and structure.
3.3 Interfaces
Animation and small multiples are the two conditions for this experiment. In this section, we present the interfaces for each of these conditions. No zooming, selection, or other forms of interaction were allowed. The zoom level was fixed at the same level for all tasks where all pertinent information was visible.
3.3.1 Animation
The interface of the animation condition was similar to a movie player and showed a smooth transition between times-lices. The animation started playing automatically after a three second pause so that the participants could read and under-stand which question they needed to answer. Thus, animation questions could be done without any interaction. A play/pause button was also provided. Participants were instructed that, at any time, they could stop the animation and drag the slider forwards or backwards to play the animation forwards or in reverse at the desired speed. In this condition, nearly the entire screen is given to the animation window. When a vertex moved between timeslices, its position was smoothly interpolated. If a vertex or edge was added/removed from the graph in a particular timeslice it faded into/out of the view. The interface is shown in Fig. 1 along with a sample question.
3.3.2 Small Multiples
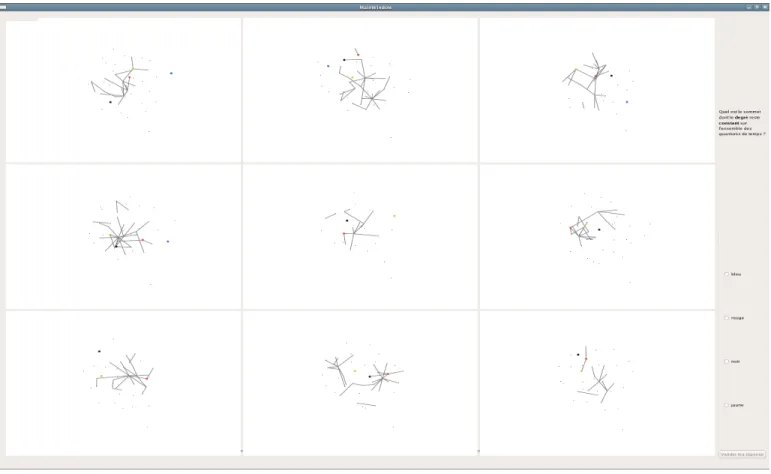
In the small multiples interface, each timeslice was placed inside its own pane on the screen. The nine timeslices were placed in a left to right then top to bottom order. The area given for each pane of the interface was identical and about a third of the width and height allotted for the single view in the animation condition. Therefore, elements in the small multiples view were smaller, but pertinent elements were still visible. The participant could not interact with this display and needed to scan the panes to read the dynamic graph. The interface is shown in Fig. 2 along with a sample question.
3.4 The Mental Map
Graphael [12] is a dynamic graph drawing algorithm where the degree of mental map preservation can be adjusted relatively easily. In the algorithm, inter-timeslice edges exist between nodes which represent the same node across timeslices. This graph, containing all real edges and inter-timeslice edges, is drawn once with a force-directed algorithm. If these inter-timeslice edges are stiff, nodes stay in the same area of the plane, while if they are loose, nodes move more freely.
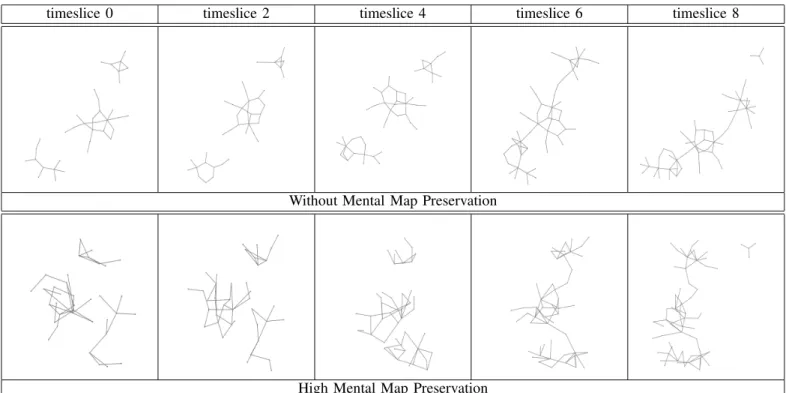
In this experiment, we presented graph layouts that either preserved the mental map or did not. For the series of layouts that did not preserve the mental map, we drew each frame independently with the force-directed algorithm used by Graphael. For the series of layouts that did preserve the mental map, we set the inter-timeslice edges to a value of sixty. These relatively stiff inter-timeslice edges attempted to keep the same node in approximately the same area of the drawing in all the timeslices in which it was present. Thus, the heuristic would drive the graph layout to move as few nodes as possible as little as possible and attempt to preserve graph shape. This value is approximately the same as the high mental map condition presented in Purchase et al. [27]. An example depicting the evolution of Threads2 under both of these factors is shown in Fig. 3.
3.5 Tasks
Our research question should require that participants read both the global and local structure of a dynamic graph. More importantly, these questions must require that participants look at all the timeslices. Questions for which the answer is found earlier than the end of the animation are not suitable, because the full evolution of the dynamic graph over time is not taken into account. Taking into account the structural constraints of Threads2and Vast, we chose five questions. The questions were posed in French, but we provide English equivalents in this paper. Eight versions of each question, four for each data set, were written.
The first question considers the evolution of node degrees in the graph. The question is local, topology-based, and similar to the types of questions posed in Purchase et al. [27]. Four nodes were highlighted in different colours, and participants were asked to select the colour of the node as the answer to the question.
1) Node degree changes. One of the following questions was asked:
a) Which node increases its degree over time? b) Which node decreases its degree over time? c) Which node keeps its degree constant over time? We chose this question because it was local, depending on the degree of nodes in the graph, and was similar to effective questions presented in previous experiments.
The second question explored when nodes appear in the graph. This question gauges if participants can see when nodes are added or if nodes stay in the data set over time. Four groups of three nodes were highlighted in different colours. Participants were asked to select the colour of the group of nodes as the answer to the question.
Fig. 1. The animation condition. In the animation condition, nearly the entire screen was devoted to the full drawing of the graph. A button at the bottom left of the screen allowed the participant to stop or play the animation at any time. The slider could be dragged forwards or backwards by the participant to see how the animation evolves. The question was shown in the upper right corner of the screen. When the participant thought they had the right answer, the participant selected a radio button on the right and clicked valider ma r´eponse (or “confirm answer”). The transition between timeslice one and two of Vast is shown, without mental map preservation.
2) Node appearance. One of the following questions was asked:
a) Which set of three nodes appear together exactly once?
b) Which set of three nodes are always present over all time slices?
We chose this question as the appearance/disappearance of nodes in a dynamic graph is one of the most basic operations of evolving relational data.
Consequently, we test for the same property for edges that appear in the data set. Four pairs of edges were highlighted in different colours. Participants were asked to select the pair of edges of the same colour as the answer to the question.
3) Which two edges appear together exactly once? We chose this question for similar reasons to those cited for the node appearance question.
In our fourth question, we test if the participant is able to notice more global trends in the dynamic graph. Specifically, the question tests if an overall growth in the number of nodes in the data set is perceived. No nodes were highlighted and the participant was asked:
4) In this data set, does the number of nodes increase, decrease, remain constant, or fluctuate?
We chose this question because it was a global question similar to an effective question used in Purchase et al. [26].
Finally, we test the readability of paths through a graph as it evolves over time. This question is more of a global question as it involves tracing a path through the graph from one coloured node to another. Four pairs of nodes where highlighted in four different colours. Participants were asked to select the pair of nodes of the same colour as the answer to the question.
5) When a path exists between these pairs of nodes, for which pair of nodes does the shortest path only de-crease in length?
We chose this question because it was global and required the participant to read both the nodes and edges of the graph to find the answer. Also, a version of this question was previously used in Saffrey et al. [29].
Our tasks can be categorized using the graph visualization task taxonomy of Lee et al. [21]. In this taxonomy, questions 1 and 5 are topology-based tasks, requiring the participant to read global and/or local topological structure. Question 1 would be a adjacency task and question 5 is a connectivity task. As this taxonomy dealt with static graph layouts, ques-tions 2 through 4 do not fit easily into this classification.
Fig. 2. The small multiples condition. In the small multiples condition, nine small windows show the state of the graph at each timeslice. The participant can scan the matrix, but no transitions between the timeslices are offered. The question is shown in the upper right corner of the screen. When the participant believed they had the right answer, the participant selected a radio button on the right and clicked valider ma r´eponse (or “confirm answer”). Vast, with mental map preservation, is shown. The focus nodes for the question were highlighted in colour as shown.
colours, because we were interested in the effects of the factors and conditions on graph readability. With this highlighting, we eliminated any additional cognitive cost of searching for nodes or reading labels. Also, keywords were presented in bold, so that the participant could easily recognize each question.
We posed multiple choice questions based on the colour of the highlighted nodes. Multiple choice is preferable to asking participants to select graph nodes and edges directly on the screen, because in the animation without mental map condition, nodes often move rapidly. It would put these layouts at a disadvantage in the experiment as there would be an additional cost for the participant to indicate the answer.
3.6 Experimental Design
Both animation and small multiple conditions used a 2 (with and without mental map) factor × 2 data set (Threads2 and Vast) × 5 question within subject design.
The interface for each of the two conditions, animation and small multiples, was demonstrated to the participants before each condition. These demonstrations allowed participants to ask questions, to find out about the experimental tasks, and to see how the answers to the questions could be found.
The experimental procedure required that participants an-swer all questions under one condition first, animation or
small multiples, followed by all questions under the other condition. Therefore, any cognitive shift required to move from one interface to another only occurred once. However, we counterbalanced between participants by presenting the ani-mation condition first to even-numbered participants and the small multiples condition first to odd-numbered participants. The participant could take a short break between experimental conditions if desired.
There were twenty experimental tasks for each condition: 2 data sets, 5 questions, 2 mental map factors. Each of these tasks were randomized for each participant and presented in two blocks of ten tasks, separated by a short break. To help overcome any learning effect, these two blocks were preceded by a practice block of ten questions, selected randomly from the set of experimental tasks, with each of the five questions being asked twice in this practice block2. Participants were not
aware that this initial block of ten questions did not form part of the experimental data collection. Each participant therefore
2. There was a possibility that participants could do the same version of the question as practice and as experimental data, possibly benefiting from learning. In the presented data, 2% of the 1120 experimental tasks were correctly answered repetitions that were answered incorrectly during practice tasks while 1% of the experimental tasks were incorrectly answered repetitions that were correctly answered during practice tasks. This possible learning effect seems to have a negligible influence on our results.
timeslice 0 timeslice 2 timeslice 4 timeslice 6 timeslice 8
Without Mental Map Preservation
High Mental Map Preservation
Fig. 3. Threads2 evolution under the with and without mental factors. The top row shows the without mental map version while the bottom row shows the mental map version. Only timeslices 0, 2, 4, 6, and 8 are shown.
completed a total of 60 tasks. We had four versions of each question at our disposal, which allowed us to ensure that the questions asked under the two mental map factors within a condition were not identical.
Randomizing the order of the tasks for each participant and including several practice tasks in advance of the experimental tasks helped in countering any learning effect, whereby a par-ticipant’s performance improves with practice independently of the experimental condition.
The animations and small multiple displays were rendered in real time using the Tulip framework [2]. For each task, the participant had exactly forty seconds to answer, before the next task was automatically displayed. This task time of forty seconds was determined through pilot experiments and was chosen taking into account task difficulty in order to avoid floor and ceiling effects3. A time limit for each task was necessary to ensure that the experiment would not take too long (which would raise ethical concerns), while still permitting a within-subjects design using a total of 60 tasks. The screen would flash briefly once when ten seconds remained for the task, warning the participant that their time was nearly up. The animation did not start playing until three seconds had elapsed and took twenty-five seconds to play all nine timeslices. This speed of animation was determined through pilot experiments as a comfortable animation rate. At any time, the participant could drag the slider at the bottom of the screen to evolve the animation at his or her own
3. A ceiling effect occurs when the tasks are so difficult that the participant error rate is uniformly high over all conditions, making it impossible to determine if the condition has had any effect on performance. A floor effect is similar, except that the tasks are so easy that the error rate is uniformly low.
rate. The participants were given the list of questions at the beginning of the experiment, and keywords for each question were highlighted in bold text, allowing for easy identification. For questions 1, 2, 3, and 5, the participant responded by selecting a radio button corresponding to a colour and committed their answer with a push button at the bottom of the interface. Nodes pertinent to each question were highlighted automatically in that colour for both conditions. For question 1, the colour indicated the nodes the participant should watch for an increase, decrease or no change in degree. In questions 2 and 3, the colours corresponded to the nodes or edges that needed to appear simultaneously exactly once. For question 5, the colours corresponded to the nodes between which the shortest paths needed to be tracked. In question 4, no nodes were highlighted. The participant was simply asked if the number of nodes increased, decreased, remained constant, or fluctuated.
Each experiment was conducted individually with the re-searcher, and took approximately 50 minutes, including the pre-experiment training, practice tasks, experimental tasks for both experimental conditions, and post-experiment question-naire.
4
R
ESULTSBased on our experience in the pilot experiments, we antic-ipated that using small multiples would prove to be faster than animation, but were not sure whether it would be more accurate. As previous experimental research has not shown any conclusive benefit for preserving the mental map ([26], [27], [29]), we were not expecting the mental map to influence either the response time or error rate for both conditions.
Animation SM 0.0 0.2 0.4 0.6 0.8 1.0 0.3 0.32
(a) Mean Error Rate
Animation SM 0 10 20 30 40 31 26
(b) Mean Response time (sec.)
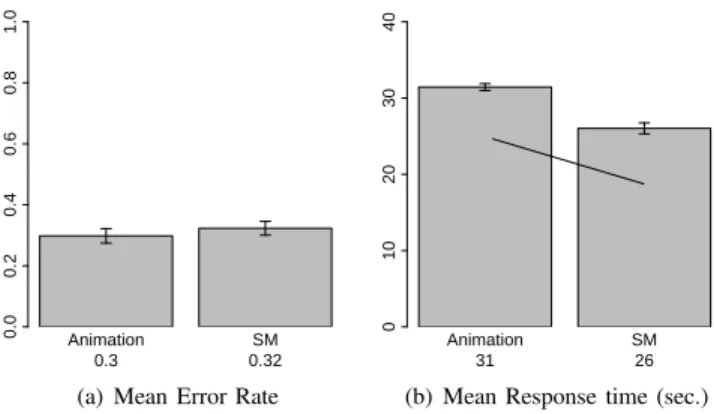
Fig. 4. Mean response time and error rate, comparing Small Multiples (SM) to animation3.
Our analysis was performed in two stages. First we con-sidered the effect of our two conditions, small multiples vs animation, as this was our primary research question. Section 4.1 presents these results. We made no distinction according to the use of the mental map in this analysis.
We then considered the effect of the mental map. In this case, we separated our analysis according to the two conditions as the user experience is very different in each. Section 4.3 describes the overall results under the animation condition, while section 4.5 describes the results under the small multi-ples condition. In both cases, we first considered the overall effect and the effect for each question.
In all cases, as the data is not always normally distributed, we used a non-parametric Wilcoxon signed-rank test with a standard significance level α = 0.05 to determine statistical
significance between conditions. When splitting the data to consider participant performance on individual questions, we applied a Bonferroni correction, thus reducing the significance level to α= 0.025 for this second-level analysis. When both
time and error data produced significant results, we performed a correlation analysis over all participants and tasks to see if there was a significant negative correlation, which would indicate that more time led to more errors.
One participant was removed from the analysis because he misunderstood two of the questions for half of the experiment. Two more participants were removed due to very high error rates, suggesting that they either misunderstood the tasks or had little commitment to the experiment. Twenty-eight participants were used in the results (24 male, 4 female). Participants were not paid for participation.
4.1 Animation vs Small Multiples Overall
Fig. 4 shows the mean error and response time results when comparing small multiples to animation. The small multi-ples condition is significantly faster than animation (SM:26s, Anim:31s; p ≪ 0.05). No significant difference is found in the error data.
3. In this and all subsequent bar charts, lines indicate where a significant difference is found, and the mean value is written below each bar in the chart.
4.2 Animation vs Small Multiples by Question
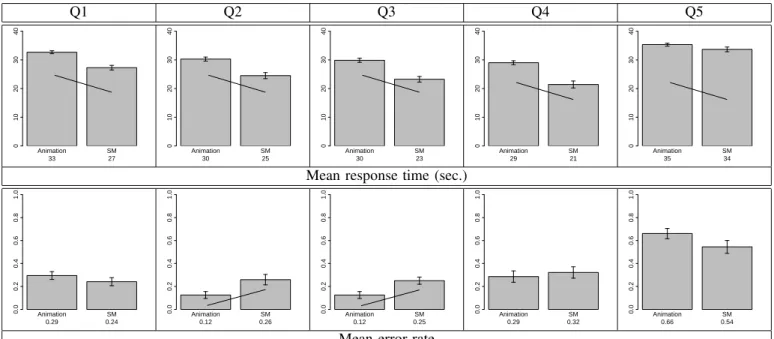
Fig. 5 shows the mean error and response time results when comparing small multiples to animation for each question.
• Question 1 – Node Degree:
– The small multiples condition is significantly faster than animation (SM:27s, Anim:33s; p ≪ 0.025). – No significant difference is found in the error data.
• Question 2 – Node Appearance:
– Small multiples is faster than animation (SM:25s, Anim:30s; p ≪ 0.025).
– Small multiples produced more errors than animation (SM:0.26, Anim:0.12; p = 0.007).
– The correlation between time and error is 0.264; as this is not negative, it is not the case that faster responses led to more errors (and vice versa).
• Question 3 – Edge Appearance:
– Small multiples is faster than animation (SM:23s, Anim:30s; p ≪ 0.025).
– Small multiples produced more errors than animation (SM:0.25, Anim:0.12; p = 0.021).
– The correlation between time and error is 0.290; as this is not negative, it is not the case that faster responses led to more errors (and vice versa).
• Question 4 – Graph Size:
– Small multiples is faster than animation (SM:29s, Anim:21s; p ≪ 0.025).
– No significant difference is found in the error data.
• Question 5 – Paths:
– Small multiples is faster than animation (SM:34s, Anim:35s; p = 0.024).
– No significant difference is found in the error data.
4.3 With Mental Map vs Without Mental Map:
Anima-tion
When analyzing the with mental map factor of the experiment, the data is separated into the small multiples and animation conditions. Dividing the data by condition before analysis makes sense, because the participant experiences two very different interfaces between with mental map under small multiples and without mental map under animation.
Fig. 6 shows the mean error and response time results when comparing with mental map to without mental map in the animation condition. With mental map is significantly faster than without mental map (MM:31s, NoMM:32s; p = 0.024). No significant difference is found in the error data.
4.4 With Mental Map vs Without Mental Map:
Anima-tion by QuesAnima-tion
Fig. 7 shows the mean error and response time results when comparing with mental map to without mental map under the animation condition for each of the five questions.
• Question 1 – Node Degree:
– No significant difference is found in the response time or error data.
Q1 Q2 Q3 Q4 Q5 Animation SM 0 10 20 30 40 33 27 Animation SM 0 10 20 30 40 30 25 Animation SM 0 10 20 30 40 30 23 Animation SM 0 10 20 30 40 29 21 Animation SM 0 10 20 30 40 35 34
Mean response time (sec.)
Animation SM 0.0 0.2 0.4 0.6 0.8 1.0 0.29 0.24 Animation SM 0.0 0.2 0.4 0.6 0.8 1.0 0.12 0.26 Animation SM 0.0 0.2 0.4 0.6 0.8 1.0 0.12 0.25 Animation SM 0.0 0.2 0.4 0.6 0.8 1.0 0.29 0.32 Animation SM 0.0 0.2 0.4 0.6 0.8 1.0 0.66 0.54
Mean error rate
Fig. 5. Mean response time and errors, comparing small multiples to animation, for each question.
Q1 Q2 Q3 Q4 Q5 MentalMap NoMentalMap 0 10 20 30 40 32 33 MentalMap NoMentalMap 0 10 20 30 40 29 31 MentalMap NoMentalMap 0 10 20 30 40 29 30 MentalMap NoMentalMap 0 10 20 30 40 28 30 MentalMap NoMentalMap 0 10 20 30 40 35 35
Mean response time (sec.)
MentalMap NoMentalMap 0.0 0.2 0.4 0.6 0.8 1.0 0.3 0.29 MentalMap NoMentalMap 0.0 0.2 0.4 0.6 0.8 1.0 0.12 0.12 MentalMap NoMentalMap 0.0 0.2 0.4 0.6 0.8 1.0 0.071 0.18 MentalMap NoMentalMap 0.0 0.2 0.4 0.6 0.8 1.0 0.23 0.34 MentalMap NoMentalMap 0.0 0.2 0.4 0.6 0.8 1.0 0.66 0.66
Mean error rate
Fig. 7. Mean response time and errors, comparing with mental map versus without mental map under the animation condition, for each question.
• Question 2 – Node Appearance:
– With mental map is faster than without mental map (MM:29s, NoMM:31s; p = 0.016).
– No significant difference is found in the error data.
• Question 3 – Edge Appearance:
– No significant difference is found in the response time or error data.
• Question 4 – Graph Size:
– With mental map is faster than without mental map (MM:28s, NoMM:30s; p = 0.024).
– No significant difference is found in the error data.
• Question 5 – Paths:
– No significant difference is found in the response time or error data.
4.5 With Mental Map vs Without Mental Map: Small
Multiples
Fig. 8 shows the mean error and response time results when comparing with mental map to without mental map in the small multiples condition. With mental map is significantly faster than without mental map (MM:25s, NoMM:27s; p = 0.014). No significant difference is found in the error data.
MentalMap NoMentalMap 0.0 0.2 0.4 0.6 0.8 1.0 0.28 0.32
(a) Mean Error Rate
MentalMap NoMentalMap 0 10 20 30 40 31 32
(b) Mean Response time (sec.)
Fig. 6. Mean response time and errors, comparing with mental map to without mental map in the animation condition. MentalMap NoMentalMap 0.0 0.2 0.4 0.6 0.8 1.0 0.31 0.34
(a) Mean Error Rate
MentalMap NoMentalMap 0 10 20 30 40 25 27
(b) Mean Response time (sec.)
Fig. 8. Mean response time and errors, comparing with mental map versus without mental map in the small multiples condition.
4.6 With Mental Map vs Without Mental Map: Small
Multiples by Question
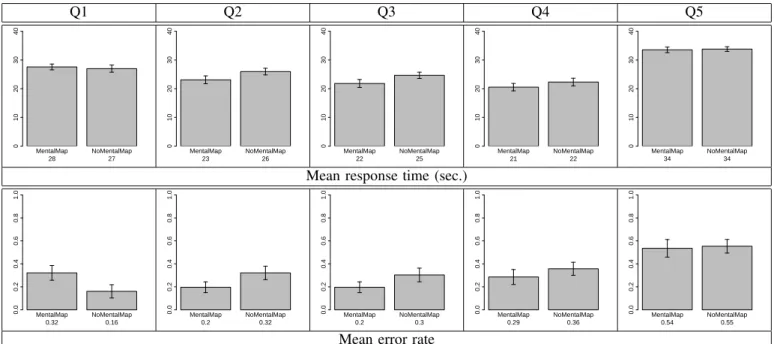
Fig. 9 shows the mean error and response time results when comparing with mental map to without mental map in the small multiples condition for each of the five questions.
• All questions: No significant difference is found in the
response time or error data.
5
A
NALYSISIn this section, we present a summary of our findings in relation to our primary and secondary research questions.
5.1 Small Multiples vs Animation
Our primary research question was which of small multiples or animation is more effective for answering questions about graphs that evolve over time.
Our data shows that it is faster to answer questions using small multiples than animation for all five questions. In addition, questions pertaining to the appearance of nodes and edges produce fewer errors using animation.
TABLE 1
The presentation methods chosen by the participants as most preferred overall and perceived to be the most
useful for each question.
Small
Animation No response/
Multiples Neither
Most preferred 11 16 1
over all question
Q1 8 0 20
Perceived to be Q2 2 17 9
the most useful Q3 2 18 8
Q4 5 11 12
Q5 21 1 6
5.2 With Mental Map vs Without Mental Map
Our secondary research question was whether maintaining the mental map between timeslices is effective for answering questions about graphs that evolve over time, either as a small multiples presentation or an animation presentation.
In the animation condition, we did find that preserving the mental map was significantly faster than not preserving the mental map overall and in two of the five questions: node appearance and graph size. We did not find any significant difference in terms of error rate. However, in all three cases the improvement was no more than two seconds, which is slight when compared to the total task time. Thus, preserving the mental map had little effect on improving the readability of dynamic graphs under the animation condition.
Overall, preserving the mental map was significantly faster under the small multiples condition, but only by two seconds. We did not find a significant difference in terms of error rate. When divided by question, we neither found a significant difference in terms of error rate nor in terms of response time. Thus, preserving the mental map had little effect on improving the readability of dynamic graphs under the small multiples condition.
5.3 Survey Results
The twenty-eight participants completed a survey after the ex-periment. In the survey, they were asked which interface they preferred overall and to indicate which interface they perceived to be the most useful for each of the five questions. Table 1 shows the number of times that the respective interfaces were chosen as being the most preferred overall or perceived to be the most useful for each question.
We anticipated that preference for a condition (Small Multi-ples or Animation) and perception of a condition’s usefulness would be related to the accuracy of the responses. Fig. 10 compares the subjective data from Table 1 with accuracy data. It shows the percentage of participants who preferred each condition to the overall task accuracy for each condition. The figure also compares the percentage of participants who per-ceived each condition as useful for each question to the accu-racy for each question. There is insufficient data for statistical analysis, but visual observation suggests a correlation between preference/perception of usefulness and accuracy: thus, the greater the number of participants choosing a condition as preferred or useful, the higher the accuracy in that condition.
Q1 Q2 Q3 Q4 Q5 MentalMap NoMentalMap 0 10 20 30 40 28 27 MentalMap NoMentalMap 0 10 20 30 40 23 26 MentalMap NoMentalMap 0 10 20 30 40 22 25 MentalMap NoMentalMap 0 10 20 30 40 21 22 MentalMap NoMentalMap 0 10 20 30 40 34 34
Mean response time (sec.)
MentalMap NoMentalMap 0.0 0.2 0.4 0.6 0.8 1.0 0.32 0.16 MentalMap NoMentalMap 0.0 0.2 0.4 0.6 0.8 1.0 0.2 0.32 MentalMap NoMentalMap 0.0 0.2 0.4 0.6 0.8 1.0 0.2 0.3 MentalMap NoMentalMap 0.0 0.2 0.4 0.6 0.8 1.0 0.29 0.36 MentalMap NoMentalMap 0.0 0.2 0.4 0.6 0.8 1.0 0.54 0.55
Mean error rate
Fig. 9. Mean response time and errors, comparing with mental map to without mental map under the small multiples condition, for each question. No significant difference was found.
In the open comments section at the end of the survey, many participants indicated that they found the experiment hard, and would have liked more time to answer the questions. This result was expected, since we designed the experiment to be somewhat challenging.
Most participants watched the animation in its entirety be-fore interacting with the interface. Many did not use the slider in the animation condition or only used it to quickly verify answers, because they felt pressed for time. Five participants, however, used the slider systematically to answer all or a subset of questions under the animation condition. Of the subjects that used the slider, two of them reported that they felt it allowed them to answer the questions faster.
A few participants thought that the dynamic graphs were difficult to read. However, with the exception of question 5, the data shows that they were sufficiently readable for more than three-quarters of the tasks to be answered correctly.
6
D
ISCUSSION6.1 Small Multiples vs Animation
Overall, small multiples was significantly faster than animation in all cases. This significant difference in response time means that it took the participants less time to scan the small multiples display than to watch the full animation of the dynamic graph before deciding on their answer. For the two questions where animation was found to be beneficial in terms of error rate, our data suggests that animation is a slower way to arrive at a correct answer.
The two tasks where animation was shown to be more accurate entailed detecting when nodes and edges appear simultaneously in a dynamic graph. Determining the simul-taneous appearance of edges and nodes is a task similar to the space-time clusters of Griffen et al. [18], so this result seems to be consistent with this work. Also, this result is consistent
with Ware et al. [33] as the nodes and edges that fade in together have common movement. This result also suggests that animated transitions between timeslices for a dynamic graph series can be useful, as Tversky et al. [31], a strong critic of the benefits of animation, suggests as a possibility. Our data suggests that if accuracy is more important than response time in tasks of this nature, animation should be used rather than small multiples.
Looking at this result using the graph visualization task taxonomy of Lee et al. [21], we see small multiples seemed to perform better for topology-based tasks, but not significantly so. However, animation performed significantly better in terms of error rate than small multiples when the task was related to the appearance of nodes or edges in the dynamic graph. It may be that tasks that require the user to read topological information in the graph are better handled by a small mul-tiples approach, but tasks related to the dynamic evolution, such as the nodes and edges added and deleted from the graph, may be better handled via animation. However, further experimentation is required to provide firmer evidence for this conjecture.
6.2 With Mental Map vs Without Mental Map
When comparing the with mental map and without mental map factors, we found hardly any difference for either the animation or the small multiples conditions. These differences amount to no more than two seconds for either condition.
Previous work on mental map preservation ([26], [27], [29]) has not shown strong evidence of a benefit when preserving of the mental map in an animated evolving graph. Although we did find a significant difference in terms of response time when the mental map was preserved, this difference was small when compared to the overall response time. Thus, our results seem to be consistent with the findings of these studies.
0 20 40 60 80 100
Animation Small Multiples Neither/No Response Preference Accuracy (a) Overall 0 20 40 60 80 100
Animation Small multiples Neither/No response Usefulness Accuracy (b) Question 1 0 20 40 60 80 100
Animation Small multiples Neither/No response Usefulness Accuracy (c) Question 2 0 20 40 60 80 100
Animation Small multiples Neither/No response Usefulness Accuracy (d) Question 3 0 20 40 60 80 100
Animation Small multiples Neither/No response Usefulness Accuracy (e) Question 4 0 20 40 60 80 100
Animation Small multiples Neither/No response Usefulness
Accuracy
(f) Question 5
Fig. 10. For each condition (Animation, Small Multiples, No Response/Neither) the participants’ preference/perception of usefulness is the left hand bar, and task accuracy is the right hand bar.
6.3 Error Rates
The error rates in this experiment (12% to 34% when exclud-ing question 5 (Paths) which suffered from a ceilexclud-ing effect) may appear high when compared with other HCI experiments like Fitt’s law [13] and object selection experiments. However, high error rates are common in the information visualization experimental literature that evaluates the readability of dy-namic graphs, animation, and small multiples (Purchase [26]: 55%; Saffrey et al. [29]: 15%-30%; Purchase et al. [27]: approx 30%; Griffen et al. [18]: 30% for animation and 35% for small multiples; Robertson et al. [28]: 40% for animation and 30% for small multiples). Thus, the presented error rates are typical for comparable experiments, and this variation in the error can play an important role in identifying differences between the two conditions.
6.4 Limitations
All experiments are limited by their parameters, and empirical results are generalizable only within the scope of those pa-rameters. While we have used real data sets, our two evolving graphs are of a particular size, and larger or smaller graphs may give different results. We chose a variety of different tasks appropriate for reading an evolving graph and analyzed our data separately according to these tasks: our conclusions may not extend to tasks of a different nature. We enforced a time limit of forty seconds for each task. This time was chosen through pilot tests – long enough for the participants to have a reasonable chance of getting the right answer, while not being so long that the whole experiment would take an unreasonable length of time. While some participants expressed the view
that they did not have enough time to answer the questions, the overall accuracy rate of 69% (76% if question 5 is excluded) showed that, in most cases, there was sufficient time for them to find the correct answer. These accuracy rates are typical for comparable experiments reported in the literature.
As our research questions were related to reading evolv-ing graphs, we deliberately removed any visual search time required to locate relevant nodes in our tasks by highlighting them and exploiting the pre-attentive properties of colour [32]. Therefore, our results cannot be easily generalized to tasks that also require that relevant nodes be identified.
Our definition of the mental map is restricted by the definition used in the Graphael algorithm [12] and its force-directed algorithm. These algorithms frequently place small disconnected components on the periphery of the drawing. These nodes tend to appear to move rapidly under the an-imation condition because of the distance that they cover between transitions. Other algorithms and other definitions of the mental map [22] may produce different results.
During piloting, an animation speed that required twenty-five seconds for the full animation to play was determined for animation comprehensibility. This default animation speed was chosen so that the participant did not spend time adjusting the animation speed during the experiment. However, participants were notified that they could use the slider at the bottom of the screen to evolve the animation at their own rate. As two participants found that the animation was too slow and many participants rarely used the slider, the animation speed could have been an area of potential bias in the experiment.
All but two of our participants had a mathematical or computer science background. We do not see this demographic
profile as a problem in the context of this experiment. As our research questions relate to the understanding of evolving graphs, some mathematical science background is helpful.
6.5 Future Work
There are several directions for future work in order to find more generalizable results: using different (larger or smaller) data sets, different questions, different definitions of the mental map, different layout algorithms, or different participants. Such experiments could extend the application of the results presented here or indicate additional limiting parameters.
Four interesting issues that warrant investigation are: 1) The effect of visual search time. In most information
visualization tasks, the nodes and edges of interest are not known in advance, and, therefore, cannot be highlighted to support visual search. Including visual search in an experiment similar to this one would make the tasks more realistic. However, in order to ensure that the experiment is still controlled for comparable task difficulty between conditions, these tasks will need to be defined very carefully.
2) Higher-level tasks. Our tasks asked questions about low-level graph structure: degree, appearance, and paths. High-level tasks, involving the understanding of clusters and fully-connected sub-graphs, for example, can often be more readily mapped to tasks that users typically perform with dynamic graph drawing data. Although there are some results on this topic (e.g. [26], [29]), it would be interesting to extend this work into the small multiples and animation context.
3) Alternative Graph Representations. Our study only investigated node-link representations of dynamic graphs and purely animation or small multiples interfaces. It would be interesting to repeat such an experiment on alternative graph representations, such as adjacency ma-trices, or other types of interfaces which combine both the animation and small multiples.
4) Dynamic graph drawings task taxonomy. The taxon-omy of Lee et al. [21] does not extend to dynamic graph drawing tasks, and reassessing it in the light of the tasks used here and in previous evolving graph experiments would result in a useful research tool.
7
C
ONCLUSIONIn this paper, we presented an experiment that compared ani-mation and small multiples interfaces for visualizing dynamic graphs. Results showed that a small multiples approach was significantly faster, but we found no significant difference in the overall error rate. Animation had significantly fewer errors than small multiples for detecting the appearance of specific nodes and edges even though it was slower, suggesting that if accuracy is more important than response time, animation should be used in preference to small multiples on this type of question.
In terms of the mental map, we found hardly any effect of preserving the mental map. This seems to be consistent with
several previous experiments that used a definition of mental map similar to the one we use here.
The results of this controlled experiment demonstrate the importance of the choice of visual presentation method for evolving graphs, according to the task to be performed, and the relative importance of accuracy and response time. While it is often assumed that an animation is the best presentation method, our results suggest that small multiples should be considered a more appropriate alternative in some cases.
A
CKNOWLEDGMENTSWe would like to thank John Hamer for writing the dynamic graph layout algorithm based on the Graphael model and Guy Melanc¸on for his help preparing the paper for submission. This work was supported in part by a travel grant given to the second author by the University of Bordeaux I, by the University of Bordeaux I, and by the INRIA Bordeaux Sud-Ouest GRAVITE project. Finally, we would like to thank the anonymous reviewers of TVCG for their helpful comments.
R
EFERENCES[1] D. Archambault. Structural differences between two graphs through hierarchies. In Proc. of Graphics Interface, pages 87–94, 2009. [2] D. Auber. Tulip : A huge graph visualization framework. In P. Mutzel
and M. J ¨unger, editors, Graph Drawing Software, Mathematics and Visualization, pages 105–126. Springer-Verlag, 2003.
[3] L. Bartram and C. Ware. Filtering and brushing with motion.
Informa-tion VisualizaInforma-tion, 1(1):66–79, 2002.
[4] K. Boitmanis, U. Brandes, and C. Pich. Visualizing internet evolution on the autonomous systems level. In Proc. of Graph Drawing (GD ’07), volume 4875 of LNCS, pages 365–376, 2007.
[5] U. Brandes and S. R. Corman. Visual unrolling of network evolution and the analysis of dynamic discourse. Information Visualization, 2(1):40– 50, 2003.
[6] U. Brandes, D. Fleischer, and T. Puppe. Dynamic spectral layout of small worlds. In Proc. of Graph Drawing (GD ’05), number 3843 in LNCS, pages 25–36, 2005.
[7] U. Brandes and D. Wagner. A bayesian paradigm for dynamic graph layout. In Proc. of Graph Drawing (GD ’97), volume 1353 of LNCS, pages 236–247, 1997.
[8] E. H. Chi and S. K. Card. Sensemaking of evolving web sites using visualization spreadsheets. In Proc. IEEE Symp. on Information
Visualization (InfoVis’99), pages 18–25, 1999.
[9] R. F. Cohen, G. D. Battista, I. G. Tollis, R. F. Cohen, R. Tamassia, and I. G. Tollis. A framework for dynamic graph drawing. ACM Symp. on
Computational Geometry, pages 261–270, 1992.
[10] S. Diehl and C. G ¨org. Graphs, they are a changing – dynamic graph drawing for a sequence of graphs. In Proc. of Graph Drawing (GD ’02), volume 2528 of LNCS, pages 23–31. Springer-Verlag, 2002.
[11] P. Eades, W. Lai, K. Misue, and K. Sugiyama. Preserving the mental map of a diagram. In Proc. of Compugraphics, pages 24–33, 1991. [12] C. Erten, P. J. Harding, S. Kobourov, K. Wampler, and G. V. Yee.
GraphAEL: Graph animations with evolving layouts. In Proc. of Graph
Drawing (GD ’03), volume 2912 of LNCS, pages 98–110. Springer-Verlag, 2003.
[13] P. M. Fitts. The information capacity of the human motor system in controlling the amplitude of movement. Journal of Experimental Psychology, 47(6):381–391, 1954.
[14] Y. Frishman and A. Tal. Dynamic drawing of clustered graphs. In Proc.
IEEE Symp. on Information Visualization (InfoVis’04), pages 191–198, 2004.
[15] Y. Frishman and A. Tal. Online dynamic graph drawing. IEEE Trans.
on Visualization and Computer Graphics, 14(4):727–740, 2008. [16] Gapminder. www.gapminder.org.
[17] C. G ¨org, P. Birke, M. Pohl, and S. Diehl. Dynamic graph drawing of sequences of orthogonal and hierarchical graphs. In Proc. of Graph
[18] A. L. Griffen, A. M. MacEachren, F. Hardisty, E. Steiner, and B. Li. A comparison of animated maps with static small-multiple maps for visually identifying space-time clusters. Annals of the Association of
American Geographers, 96(4):740–753, 2006.
[19] G. Grinstein, C. Plaisant, and J. Scholtz. IEEE VAST 2008 challenge. www.cs.umd.edu/hcil/VASTchallenge08, 2008.
[20] G. Kumar and M. Garland. Visual exploration of complex time-varying graphs. IEEE Trans. on Visualization and Computer Graphics (Proc.
Vis/InfoVis 2006), 12(5):805–812, 2006.
[21] B. Lee, C. S. Parr, J.-D. Fekete, and N. Henry. Task taxonomy for graph visualization. In BELIV ’06: Proc. of the 2006 AVI workshop on BEyond
time and errors, pages 1–5, 2006.
[22] Y. Lee, C. Lin, and H. Yen. Mental map preserving graph drawing using simulated annealing. In Proc. of the Asia-Pacific Symp. on Information
Visualisation, pages 179–188, 2006.
[23] K. Misue, P. Eades, W. Lai, and K. Sugiyama. Layout adjustment and the mental map. Journal of Visual Languages and Computing, 6:183– 210, 1995.
[24] S. Moen. Drawing dynamic trees. IEEE Software, 7(4):21–28, 1990. [25] S. North. Incremental layout in dynaDAG. In Proc. of Graph Drawing
(GD ’95), volume 1027 of LNCS, pages 409–418. Springer-Verlag, 1995. [26] H. Purchase, E. Hoggan, and C. G ¨org. How important is the ”mental map”? – an empirical investigation of a dynamic graph layout algorithm. In Proc. Graph Drawing (GD ’06), volume 4372 of LNCS, pages 184– 195, 2006.
[27] H. C. Purchase and A. Samra. Extremes are better: Investigating mental map preservation in dynamic graphs. In Diagrams 2008, volume 5223 of LNAI, pages 60–73. Springer-Verlag, 2008.
[28] G. Robertson, R. Fernandez, D. Fisher, B. Lee, and J. Stasko. Effective-ness of animation in trend visualization. IEEE Trans. on Visualization
and Computer Graphics (Proc. Vis/InfoVis ’08), 14(6):1325–1332, 2008. [29] P. Saffrey and H. C. Purchase. The ”mental map” versus ”static aesthetic” compromise in dynamic graphs: A user study. In Proc. of
the 9th Australasian User Interface Conference, pages 85–93, 2008. [30] E. Tufte. Envisioning Information. Graphics Press, 1990.
[31] B. Tversky, J. Morrison, and M. Betrancourt. Animation: Can it facilitate? Int. Journal of Human-Computer Studies, 57:247–262, 2002. [32] C. Ware. Information Visualization: Perception for Design. Morgan
Kaufmann, 2004.
[33] C. Ware and R. Bobrow. Motion to support rapid interactive queries on node-link diagrams. ACM Trans. on Applied Perception, 1(1):3–18, 2004.
[34] Q. Ye, T. Zhu, D. Hu, B. Wu, N. Du, and B. Wang. Cell phone mini challenge award: Social network accuracy exploring temporal communication in mobile call graphs. In IEEE Symp. on Visual Analytics
Science and Technology, pages 207–208, 2008.
Daniel Archambault received the PhD degree
from the University of British Columbia in 2008. From 2008 through early 2010, he was a post doctoral researcher at INRIA Bordeaux Sud-Ouest. Currently, he is a post doctoral re-searcher in the Clique Research Cluster at University College Dublin. His interests include graph drawing, visualization systems and their evaluation, and computer graphics.
Helen Purchase is Senior Lecturer in the School
of Computing Science at the University of Glas-gow. While her main interest is the evaluation of the visual presentation of graphs, she also takes part in several empirical research projects investigating a variety of different visual stimuli. She has published several papers in the area of computer science education.
Bruno Pinaud received the PhD degree in 2006
from the University of Nantes. He is an assistant professor in the University of Bordeaux I, De-partment of Computer Science since September 2008. His current research interest are dynamic graph drawing, visualization of graph rewriting systems and experimental evaluation.