HAL Id: hal-00364456
https://hal.archives-ouvertes.fr/hal-00364456
Submitted on 4 Jul 2017
HAL is a multi-disciplinary open access
archive for the deposit and dissemination of
sci-entific research documents, whether they are
pub-lished or not. The documents may come from
teaching and research institutions in France or
abroad, or from public or private research centers.
L’archive ouverte pluridisciplinaire HAL, est
destinée au dépôt et à la diffusion de documents
scientifiques de niveau recherche, publiés ou non,
émanant des établissements d’enseignement et de
recherche français ou étrangers, des laboratoires
publics ou privés.
Yann Riffonneau, Arnaud Delaille, Franck Barruel, Seddik Bacha
To cite this version:
Yann Riffonneau, Arnaud Delaille, Franck Barruel, Seddik Bacha. System modelling and energy
management for grid connected PV systems associated with storage. 23rd European Photovoltaic
Solar Energy Conference and Exhibition, Sep 2008, Valence, Spain. �hal-00364456�
SYSTEM MODELLING AND ENERGY MANAGEMENT FOR GRID CONNECTED PV SYSTEMS WITH STORAGE
Y.Riffonneau
*†, A.Delaille
*, F.Barruel
*, S.Bacha
†* CEA/INES, Laboratory for Solar System (L2S), BP 332, 50 avenue du Lac Léman, 73377 Le Bourget du Lac, France † G2Elab, ENSIEG-INPG/UJF-CNRS-BP38402-Saint Martin D’Hères-Cedex-France
ABSTRACT: This paper presents the modelling and energy management of a grid connected PV system associated with storage. Within the economic, energetic and environmental context, objective of the system is to ensure loads supply at the least cost by optimising the use of solar power. Therefore, due to the complicated operating patterns, an energy management system which decides on energy flow for any moment is necessary. First, we present the system studied. Based on an AC bus typology, we consider all the energy flow possibilities. A model of the system is presented with an innovate algorithm for the estimation of batteries state of charge (SOC). Energy management has been done with a deterministic algorithm. At each step size, the algorithm finds the energy flow pattern which ensures loads supply at the least cost, taking into account availability of PV power, batteries SOC, loads demand and instantaneous electricity grid prices.
1. Introduction
Face up to the environmental, economical and political context, integration of renewable energy in electricity production is essential. Due to its many assets, photovoltaic solar power is one of the most promising solutions. However, over voltage in distribution lines network during important feeding time and the mismatch between the PV production and the loads consumption times impose the limits of integration of grid connected PV systems [1]. Adding a storage element to these systems would enable to solve these problems. In such a case, many applications are conceivable, depending of size and technology of the storage element. The high number of power flow direction has to be considering in function of the architecture of the system. To satisfy the objective function of the system, a power flow management algorithm has to be developed. Forecasting of variables in the system such as grid electricity price and solar source availability are necessary to ensure optimization along the period studying. This paper presents the hybrid system and its corresponding power flow possibilities. Modelling of the PV source and storage are displayed. Determinist algorithm has been used to develop the power flow management algorithm. This algorithm and its corresponding objective function are described for an individual economic environment. Simulations have been realized in a perfect prediction context. Results are analysed and discussed.
2. System description
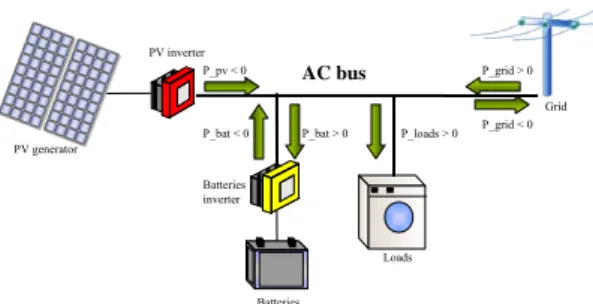
In this paper, we propose to integrate a storage element in a grid connected photovoltaic system. The storage technology used in this study is lead acid secondary batteries. Because the storage is associated with a commercial grid connected PV system, topology of the global system is composed of an AC bus. Figure 1 shows the scheme of the system with the possible power flow directions and their corresponding signs convention. Photovoltaic modules are considered as a power source, loads as a power sink, batteries and grid are considered as power sources or sinks depending of the power direction. Batteries Loads PV generator Grid PV inverter Batteries inverter AC bus
P_bat < 0 P_bat > 0 P_loads > 0 P_grid < 0 P_grid > 0 P_pv < 0
Figure 1 : Scheme of the system studied The size of the system corresponds to the values of Table 1 with:
Ploads_max = Maximum loads power (kW) Ppv = Photovoltaic generator peak power (kWp) Pbat_max = Maximum batteries power (kW) Cbat = Total batteries capacity (Ah) Vbat = Total batteries voltage (V)
Ploads_max 2.8 kW
Ppv 3.5 kW
Pbat_max 2 kW
Cbat 200 Ah
Vbat 120 V
Table 1 : System specifications
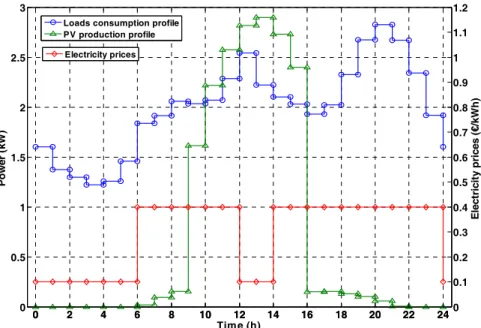
The reference loads consumption profile and grid electricity prices are presented Figure 2. The PV purchase price is a constant equal to 0.3 €/kWh. The on peak and off peak periods are based on the actual end user electricity contract, from the grid operator GEG in Grenoble, France [2]. Prices values have been evaluated considering to be expected in a future liberalised electricity market. The loads power demand profile has been created with information about french electric consumption from [3].
City of simulation is Chambéry, in France. Hourly irradiation and temperature values for the year 2007 are collected from experimental measure at INES institute, Chambéry.
3. System modelling
3.1. Photovoltaic generator
The PV module current/voltage behaviour at the maximum power point (MPP) is described through linear equations (1), (2) and (3) [4]. The module temperature
Tmod (°C) is obtained from the nominal operating cell temperature NOCT (°C), the ambient temperature
Tamb (°C), and the irradiance E (W/m²). Taking into account the temperature effect, output current and voltage are obtained from the standard test conditions (STC). By this way, the only parameters needed are temperature coefficients CImpp (A/°C) and CVmpp (V/°C) , the NOCT, STC irradiance E0 equal to 1000 W/m², STC current Istc (A) and voltage Vstc (V), and cell temperature
Tstc (°C). These data are always given by the constructor.
Tmod = Tamb + E/800 × (NOCT – 20) (1)
Impp = [Istc + CImpp × (Tmod – Tstc)] ×E/E0 × Np (2)
Vmpp= [Vstc+ CVmpp× (Tmod –Tstc)
+ 0.026 × log (E/1000)] × E/E0 × Ns (3) Total current and voltage of the PV generator are obtained by multiply module current and voltage respectively by the number of modules in parallels Np and in series Ns. As the equations shows, we consider the PV generator working at its MPP. Behaviours of the MPP tracker (MPPT) and inverters are not modelled here. The mean efficiency of power electronic is taking into account with a ratio of 92% applied to the output power of the PV generator.
3.2. Lead acid battery
This section presents only the state of charge. We do not model the voltage characteristic because it is not needed for energy management.
We propose here an innovating estimation of SOC from [5] describes by equations (4) (5) (6) (7). It takes into account the variation of the quantity of charge in the process as a function of the current rates and temperature. Values needed to SOC estimation are the reference capacity and its corresponding current. Cnx (Ah) is the new nominal capacity after the discharge number “x”. This nominal capacity tapes off with ageing process after each discharge. Evolution of this quantity is described in the subsection about state of health (SOH);
C(t) (Ah) is the available quantity of charge in the battery
at time “t”; Q(t0) (Ah) is the initial quantity of charge in the battery at time t0; Qd(t) (Ah) is the quantity of charge
which take part in the discharge process; Qc(t) (Ah) is the quantity of charge which take part in the charge process; ai and bi are balanced coefficient used to take into account the work conditions.
SOC = Cn(t) / Cnx (4)
C(t) = Q (t0) – Qd(t) + Qc(t) (5) If Ibat < 0
Qd(t) = ∫(a1(Ibat) × a2(T) × |Ibat(t)| × dt) (6) If Ibat ≥ 0
Qc(t) = ∫(b1(SOC) × b2(Qd) × |Ibat(t)| × dt) (7) The coefficient a1 is function of the discharge current
in the battery and of the reference current I0
corresponding to the reference capacity Cn0. It permits to
calculate the equivalent charge quantity extract of the battery during discharge process with the equivalent reference current I0 whatever the current rate Ibat. It
corresponds to the Peukert equation where n is the Peukert coefficient.
a1 = (Ibat(t) / I0) ^ (n – 1) (8) The Peukert coefficient depends of the current rate and is generally in the range 1.2-1.6. Values of n is given by Table 2 as a function of the current Ibat(t).
The coefficient a2 is used to take into account of the
temperature effect. It is a function of the reference temperature Tref equal to 20°C and the ambient
temperature Tamb. A corrective factor of 0.75% is
introduced from the French policy NF C58-510 on lead acid batteries for solar application.
a2 = 1 / (1 + 0.0075 × (Tamb(t) – Tref)) (9) The coefficient b1 corresponds to the charge efficiency of
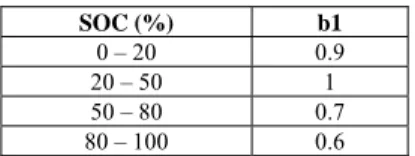
the battery. Discharge efficiency is assumed to be equal to one, and losses appear only during charge process. Efficiency depends of the SOC and the current rate. In our model, b1 is not a continuous value and is a function
of SOC. Table 3 shows values of b1 used in our model
for lead acid batteries.
Table 2 : Values of the Peukert coefficient as a function of current
Ibat ≤ I50 ≤ I20 > I20
n 1.2 1.3 1.5
Table 3 : Values of coefficient b1 function of SOC for lead acid batteries
SOC (%) b1
0 – 20 0.9
20 – 50 1
50 – 80 0.7
80 – 100 0.6
The coefficient b2 is an innovate point in the SOC
estimation. It permits to take into account the influence of the last discharge on the next charging process. b2
correspond to the rate between the equivalent quantity of charge extract from the battery during discharge process calculated with equivalent coefficients a1 anda2 (= Qd),
and the same variable calculated without the equivalent coefficient.
b2 = Qd / ∫(|Ibat| × dt) (11)
This coefficient allows to maintained feasibility of calculi during irregular cycling process such as in photovoltaic application.
The objective of the power system is to supply loads with the least cost while satisfying the constraints imposed. The problem will be solved with hourly step size. Equations (18) and (19) show the constraint imposed to batteries on SOC and batteries power Pbat.
0.2 < SOC < 0.9 (18)
Pbat ≤ 2 kW (19)
Referring to fig. 2, the algorithm has to find the batteries and grid power schedule which satisfy the objective function along the entire simulation period. We define below calculus of decision variable energy cost and cost functions used by the algorithm to find the optimal power flow solution. The problem is formulated based on the discretization of a 24 hours future prediction horizon with a step size of one hour [6].
All the conceivable power flow directions in the system are taking into account. Each one is optimal for a particular range value of the decision variable.
At each discrete time instance, from real time and predicted values of solar power availability, loads consumption and batteries SOC, the algorithm calculates the decisions variables and applies the corresponding optimal power flow direction.
4.1. Energy cost
Because we want to supply loads with the least cost, we need to estimate energy cost of each source. This subsection present the method to obtain energy cost of the photovoltaic generator and batteries.
Photovoltaic energy cost is obtained from equation 20.
pv pv pv Life Y Inv t PV × = cos _ (20) With :
Invpv = Grid connected photovoltaic system investment cost (€/kWp). From [7], this value is assumed to be equal to 6000 €/kWp in France.
Ypv = Annual photovoltaic yield (kWh/kWp). From experimental measures, this value is assumed to be equal to 1200 kWh/kWp in France.
Lifepv = Life time of the photovoltaic generator (years). This value is estimated to 20 years.
So the photovoltaic energy cost is:
PV_cost = 0.25 €/kWh (21)
Batteries energy cost is composed of two terms, the discharge energy cost and the charge energy cost. The discharge energy cost Bat_dch_cost (€/kWh) is a constant obtained from equation (22).
ref ref bat DOD N Inv t dch Bat × = cos _ _ (22) With:
Invbat = Batteries investement cost (€/kWh).Taking into account the future cost reduction achieved by the massive employment of grid couple storage system, this value is estimated to 100 €/kWh for lead acid technology.
Nref = Reference cycle life of batteries (number of cycle). It is assumed to be equal to 1000 for a reference depth of discharge of 80%.
DODref = Reference depth of discharge of batteries (%). It assumed to be equal to 80%.
So the discharge energy cost is:
Bat_dch_cost = 0.12 (23)
Charge energy cost Bat_ch_cost (€/kWh) is the energy price of the source used to charge batteries divided by the batteries charge efficiency effbat estimated to 0.85. If batteries are charge with PV, this quantity is equal to
PV_cost, if it is charge with the grid, it corresponds to
energy price from the grid (24).
PV_cost / effbatif charged from PV
Bat_ch_cost = (24)
grid_cost / effbatif charged from grid The batteries energy cost Bat_cost (€/KWh) is the sum of the charge and discharge energy cost (25).
Bat_cost = Bat_dch_cost + Bat_ch_cost (25) 4.2. Cost functions
The optimum power direction is choice in function of the cost function results. Two cost functions are defined (Present_cost_fct and Future_cost_fct) to choice the optimal state of batteries (charge (Pbat > 0), discharge (Pbat < 0) or idle (Pbat = 0)). Present_cost_fct” is defined as the difference between the grid cost and Batteries cost (24).
Present_cost_fct = grid_cost – Bat_cost (26)
It is calculated to estimate feasibility of batteries discharge operation (so when Ppv < Ploads). If the
Present_cost_function is positive, grid_cost is higher
than Bat_cost, so discharge of batteries to supply loads is the least cost operation. Otherwise, loads are supply by the grid and batteries are in idle state.
In order to estimate feasibility of batteries charge operation, predictions are necessary. A prediction matrix has been developed containing the future loads power demand (f_Ploads (kW)), future grid electricity price (f_grid_cost (€/kWh)), and future PV power availability (f_Ppv (kW)). The algorithm finds into the prediction matrix the periods when PV power is not enough to supply loads. It reads the future grid electricity price at this time and compares it to the battery energy cost calculated as a function of the charge source. The future cost function Future_cost_fct is defined as the difference between the future grid electricity price, gains from purchase PV power PV_gain (€/kWh), and the batteries cost (25).
If PV modules are the batteries charge source (so when
Ppv > Ploads), we have to submit to the future electricity price the gain obtained by selling PV power to the grid instead of charging batteries. By this way, we can decide at any moment if it is cheaper to charge batteries or to feed the grid. If PV modules are not the charge source, it means PV power is equal to zero, so PV_gain is zero.
– Bat_csot (27) If battery energy cost is lower than the future grid electricity price, batteries are charged from the corresponding source; otherwise, batteries are not used. By this way, batteries charge is anticipated to supply loads when PV power is not enough.
5. Simulations results
Two hypotheses have been assumed during simulations. Firstly, the power flow from batteries to the grid is not considered in our algorithm.
Secondly, we assumed that predictions are perfect. This means that the true values of variables match exactly with the predictive values. This situation is not realistic but simulations with perfect predictions are necessary to study the algorithm behaviour in optimal conditions.
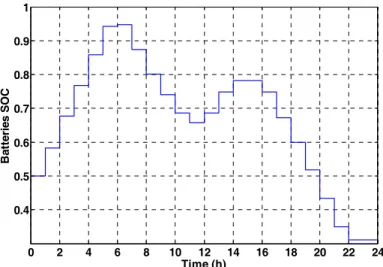
Figure 3 and Figure 4 show the results of the optimisation algorithm for the 13 of July 2007.
0 2 4 6 8 10 12 14 16 18 20 22 24 0 0.5 1 1.5 2 2.5 3 Time (h) Po w er ( kW ) 0 2 4 6 8 10 12 14 16 18 20 22 240 0.1 0.2 0.3 0.4 0.5 0.6 0.7 0.8 0.9 1 1.1 1.2 El ect ri ci ty p ri ces ( €/ kW h )
Loads consumption profile PV production profile
Electricity prices
Figure 2 : Loads consumption profile, electricty prices and PV output power corresponding to the input data of the simulation during the 13 of July 2007
0 2 4 6 8 10 12 14 16 18 20 22 24 -2 -1 0 1 2 3 4 Time (h) En er g y ( kW h )
Energy exchange w ith batteries Energy exchange w ith the grid
Figure 3 : Energy flow diagram of the batteries and grid energies corresponding to output data from the algorithm of the simulation during the 13 of July 2007.
0 2 4 6 8 10 12 14 16 18 20 22 24 0.4 0.5 0.6 0.7 0.8 0.9 1 Time (h) B at ter ie s S O C
Figure 4 : Batteries SOC during simulation As expected, batteries are charged with the grid during
low price periods and are discharged to supply the loads during PV unavailability and high prices periods. The maximum battery power is respected and its SOC is kept in the range allowed. The total energy spent during simulation is obtained with equation (28). Ei (kW) is the energy quantity from the source i (PV, grid or batteries) and Ei_cost (€/kWh) is the price of the energy from the source corresponding to the power Ei.
Money spent = ∑(Ei × Ei_cost) (28) The total money spent during on day is equal to 10 €. This is less than the money spent using only the grid as power source, which is equal to 15 €. The annual benefits from the system are equal to 1825 €. In this economical context, the algorithm assures to supply loads at the least cost and reduce electricity cost.
6. Conclusion
Energy storage associated to grid connected PV systems enables an optimal control and use of solar power. The algorithm developed in this paper assures loads supply at the least cost over the entire period studied. The algorithm determines for any moment the power flow in the system. It takes into account the real time and predictive values of loads demand, electricity grid prices, batteries SOC and solar power availability. A significant value of money is saved from the system use.
Simplicity of the algorithm developped enables to implement it easily into a microprocesor in order to develop an experimental energy management system which will be tested at INES institute in Chambéry. 7. References
[1] Y.UEDA & all, “Detailed performance analyses results of grid-connected clustered PV systems in Japan – first 200 systems results of demonstrative research on clustered PV systems”, 20th EUPVSEC, 2005
[2] Gaz Electricité de Grenoble (GEG), “ Tarif heures pleines/heures creuses pour le particulier“, 2008
“
[3] OLIVIER SIDLER, “Cabinet Sidler ENERTECH “, Les usages de l’électricité dans le bâtiment (electrical used in building), Septembre 2003, http://sidler.club.fr
[4] A.RICAUD, “ Photopiles solaires”, Presses
polytechniques et universitaires romandes, 1997
[5] A.DELAILLE, “Développement de méthodes d’évaluation de l’état de charge et de l’état de santé des batteries utilisées dans les systèmes photovoltaïques“, Thèse de doctorat de l’université Pierre et Marie Curie, 2006 [6] P.L ZERAS & al, “Model-based optimal control of a
hybrid power generation system consisting of photovoltaic arrays and fuel cells”, Journal of power sources, Vol 181, pp.327-338, 2008
7 HESPUL association, “Energy efficiency and renewable energies, grid connected photovoltaic systems“, Energy information of Rhône, France, 2007, http://www.hespul.org