HAL Id: cea-01373968
https://hal-cea.archives-ouvertes.fr/cea-01373968
Submitted on 29 Sep 2016HAL is a multi-disciplinary open access
archive for the deposit and dissemination of sci-entific research documents, whether they are pub-lished or not. The documents may come from teaching and research institutions in France or abroad, or from public or private research centers.
L’archive ouverte pluridisciplinaire HAL, est destinée au dépôt et à la diffusion de documents scientifiques de niveau recherche, publiés ou non, émanant des établissements d’enseignement et de recherche français ou étrangers, des laboratoires publics ou privés.
Phase-locking modes in a bidimensional network of
coupled water jets
S. Houard, F. Daviaud, P. Bergé
To cite this version:
S. Houard, F. Daviaud, P. Bergé. Phase-locking modes in a bidimensional network of coupled water jets. Physica D: Nonlinear Phenomena, 1996, 99, pp.318-338. �10.1016/S0167-2789(96)00140-6�. �cea-01373968�
ELSEVIER Physica D 99 (1996) 318-338
Phase-locking modes in a bidimensional network of coupled water jets
S. Houard*, E Daviaud, P. Berg6Service de Physique de l'Etat Condens6, CEA/Saclay, F-91191 Gif-sur- Yvette C6dex, France
Received 31 July 1995; revised ! May 1996; accepted I May 1996 Communicated by Y. Kuramoto
Abstract
In this paper, we investigate the dynamics of a bidimensional network of coupled water jets impinging from below on a water/air interface. For each jet, a transition is observed at a critical flow rate value for which the surface bump at the vertical of the jet starts oscillating at a well-defined frequency. We infer that this oscillatory mode is the materialization at the surface of a helical instability of the submerged laminar jet. When coupled together, the bidimensionai network of oscillators exhibits monoperiodic collective modes whose spatial arrangements are similar to those encountered in crystals. A collection of phase-locking modes is observed for each geometry, and stability diagrams are constructed. Analysis of the coupling between the jets reveals a long distance coupling through surface waves. A tuning criterion is proposed to explain the bifurcation from one mode to another. Finally, the symmetries of the system are investigated using two different systematic schemes. The predictions are compared with the observations and some features of the particular topology of phase-locking modes are explained.
PACS: 0545: 4755C: 0220
Keywords: Jet: Helical instability: Phase-locking mode: Bifurcation: Symmetry
I. Introduction
The study of the collective dynamics of systems of coupled oscillators has received considerable interest in the last few years. This results from the wide vari- ety of problems it can be connected to: from the study of collective chaos in theoretical physics [ 1-7], to the study of the cooperative synchronization phenomenon and of biological rhythms in biology [8-14]. Indeed, mutual synchronization occurs very commonly in pop- ulations of biological oscillators: congregated fireflies flashing in synchrony at night [8,12], pacemaker cells of the heart working in unison [ 11 ] and women having
* Corresponding author.
their menstrual periods in synchrony [9] are striking examples of cooperative synchronization.
A first mathematical approach of the phenomenon of mutual synchronization was proposed by Winfree [15]. He considered populations of weakly coupled oscillators ,whose individual limit cycles were not perturbed, so that only phase variations had to be considered. He discovered that synchronization oc- curs above some coupling strength threshold value. His phase model was reformulated by Kuramoto [16]. Three different regimes were observed, depending on the coupling strength relative to the frequency bandwidth of the population of oscillators [4]: (i) in- coherence, where the oscillators beat at different frequencies, (ii) phase-locking modes, including the 0167-2789/96/$15.00 © 1996 Elsevier Science B.V. All rights reserved
S. Houard et aL/Physica D 99 (1996) 318-338 319
trivial mode of synchrony, where the oscillators beat at the same frequency, but present constant phase- shift relative to each other, (iii) partial locking, a state intermediate between the latter two. The most strik- ing example of phase-locking mode in nature is in the locomotion of animals [14,17], where the differ- ent gates of quadrupeds correspond to phase-locking modes of different symmetry.
As a further step, models with stronger coupling between oscillators were considered, allowing am- plitude variations of limit cycles. This led to the discovery of unsteady collective modes, such as col- lective chaos, that were not observable with the earlier phase models [4]. The collective behaviour of net- works of coupled oscillators is now investigated by many physicists, using the formalism of discretized complex Ginzburg-Landau equations [6-7]. Among other things, the chaotic dynamics in such systems is expected to exhibit characters intermediate between low-dimensional chaos and spatio-temporal chaos [7]. Parallel to this intensive numerical work, the spatio-temp0ral behaviour of experimental systems of coupled oscillators has been investigated too, in- volving Josephson-junction series arrays [18] or 2D lattices of coupled units such as vortices [19] or elec- tronic devices [20]. In this paper, we propose to study the collective dynamics of a 2D network of coupled oscillators using an original experimental device: co-flowing water jets impinging (from below) on a water/air interface.
Although many studies have been devoted to the problem of a jet impinging on a flat solid surface [21- 23], few have been devoted to the imI.~igement of a submerged jet on a water/air interface, and if so [24,25], for a jet flow parallel to the surface only. The present experimental set-up, namely a jet impingement normal to the water/air interface has, to our knowl- edge, not been investigated yet. Thus we propose to study the collective dynamics of bidimensional net- works of such co-flowing jets. Note that Villermaux and Hopfinger [26] studied large-scale instabilities in a bidimensional network of co-flowing air jets, but no interface was present.
First, the experimental device is presented. Then the case of a single jet is considered: above some flow rate
threshold value, a single water jet exhibits a monope- riodic oscillatory mode. The characteristics and mech- anism of transition are studied in detail. Then, the dynamics of two coupled jets, a line of jets and fi- nally bidimensional lattices of such co-flowing water jets are investigated, using perforated plates of differ- ent geometries and solidities. Collective phase-locking modes are observed, whose topology is commented upon. For each set of plate parameters, diagrams of - stability are constructed which" are used to investigate the coupling mechanism between jets, as well as the criteria of transition from one phase-locking mode to another. In a last step, considerations of symmetry are used to highlight the particular topology of phase- locking modes, with two different approaches. The first approach is specific to the present experiment, and is derived from the empirical procedure which was adopted for observations, while the second is more generic, and uses group theory.
2. Experimental set-up
In the present experiment, we study the collective dynamics of a bidimensional network of coupled wa- ter jets. To generate the jets, a plexiglass tranquiliza- tion chamber is used (Fig. I). The water comes in through a thin cylinder and penetrates in the chamber through two 3 mm holes perforated at its end. The tur- bulent flow is then homogenized using a grid and a 5 cm thick dense sponge. A sponge was preferred to straws because the vertical size of the whole appara- tus had to be limited. The flow then comes through a 6 mm thick perforated plate, generating co-flowing water jets. Note that in a first prototype, the jets issued from 30 mm long pipes instead, in order to facilitate the backward recirculation of the flow. However, since no quantitative change in the collective dynamics was observed, we opted for the more convenient device of Fig. 1. Indeed, since the perforated plates are re- movable, various geometries and plate parameters can be tested. Three geometries have been investigated: square, hexagonal (honeycomb) and triangular, with different plate parameters for each of them (Table 1). The square, hexagonal and triangular meshes of the
320 S. Houard et aL/Physica D 99 (1996) 318-338 .Air
("
1 h IT I
I I /.hole tt 11 !! !1 II I tt It li il I!t
t
t
t
tit
t
t
t
t
iliiiiii iii iiiiiiii !i!
iiiiiiiiiiiiiiiiiiiiiiiiillii,, iiiiiiiiiiiilliiiii!iiil!!il
i:!:...:!:!:~:~:~:~:~:!:i:i:i:!:i:i:i:~:!:!:~:~:~:~:!:i:!:~:i:i:~:~:~:i:i:~:E:!:!:ii!!!iiiii!iiiiiiiii! iiiiiiiiiiiiiiiiiiii
removable / plate/
W a t e r ' . . . . .C~_'.~ . . . ' I i • I . U: In ~ t i o n ,,","L ... ~ ,-" .... l " ~ i Ch b,.r ... ---:" ... i" .... F'I --'-- '~ . . . I. . . ' [ --Fig. !. Experimental device. A tranquilization chamber is used to homogenize the turbulent incoming flow. Then, the flow passes through a removable perforated plate, generating co-flowing water jets.
Table I
List of plate parameters
Network mesh Jet diameter [ ~ Q 0 = 1.44 mm 0 --" I . O m m 0 --" 0.5 mm N ffi 89, d = 8 m m N = 57, d - 12, 6, 4 m m N ffi 57, d - 12, 6ram N = 46, d = 12, 8 mm N - 6 8 , d = 12. 8mm
Note: N - the number of jets of the network; d - the distance between nearest neighbours.
network are represented by the corresponding symbols in ~ b l e I. N is the number of jets of she network, while d is the distance between nearest neighbours. Except for the square geometry, only 1.0 mm holes have been used.
The plexiglass tranquilization chamber is immersed in water in a 0.4 m deep, 0.4 m wide and 0.7 m long plexiglass water tank. The chamber can be positioned vertically using a micropositioner, so that the depth of the jets below the free-surface can be adjusted. The water is pumped at the bottom of the tank using a centrifugal pump, and reinjected at the bottom of the tranquilizafion chamber (Fig. 1). The free surface level is thus always constant in the tank. Moreover, the water tank itself is large enough for the pumping of the water not to create perturbations in the hydrodynamics of the jets. A flowmeter is used to control the total flow rate through the perforated plate. The homogeneity of the
flow throughout the whole network of jets has been verified at low flow rate values, using an ombroscopic method. The homogeneity of the 2D light reflection patterns obtained, along with the great sensitivity of the method, allowed us to conclude that the flow rate was homogeneous throughout the network.
The presence of a water/air interface allows a bidimensional visualization of the system. In the counterpart, it introduces complexity in the physical processes, since the water jets are impinging on a de- formable surface. Actually, the interface is part of the physical system and reveals to be crucial, both for the development of the oscillatory phenomenon which is observed and for the coupling between the jets.
The dynamics of the system is expected to depend both on (i) physical parameters governing the dy- namics of a jet: the flow F (or the velocity
F/S)
S. H o u a r d et a l . / P h y s i c a D 99 (1996)318-338 321
Fig. 2. Surface deformation at the vertical of a jet, for increas- ing values of the adimensional parameter e = ( F - F c ) / F c .
(~ = 1.44mm, h = lOmm): (a) e = - 0 . 2 ; (b) e = - 0 . 1 ; (c) e = O: a transition is observed where the bump starts oscillat- ing at a high eigenfrequency; (d) surface waves generated by the oscillatory motion of the bump. In both panels (c) and (d), stroboscopic lighting is used to visualize the phenomenon, in panels (a)-(c), the zoom magnification factor is 20.
(iii) characteristics of the fluid: surface tension and viscosity.
below the free-surface; (ii) geometrical parameters: the geometry of the network, the distance d between nearest neighbours in the lattice, the diameter ~ of the holes and the number N of jets in the network;
3. Oscillatory mode for a single jet
3. !. Observations
The impingement of the jet on the water/air in- • terface induces an upward deflection of the interface at the vertical of the jet. The height of the deflection increases with increasing flow rate at the nozzle exit. Fig. 2 illustrates the evolution of the free-surface deformation as the flow rate increases. First, only a small and smooth swell is visible (Fig. 2(a)); then a higher bump bursts at the top of the small swell (Fig. 2(b)). Then this bump grows up to a critical height where it starts oscillating (Fig. 2(c)) in a cir- cular motion at the same time as surface waves are generated (Fig. 2(d)). The height of the bump at the threshold .is of a few millimeters, but depends both on the diameter ~ of the jet and on the depth h of the jet nozzle. The eigenfrequency of the oscillation is larger than the standard video frequency, and a
S. Houard et al./Physica D 99 (1996) 318-338 322
diameter (mm)
~
40
. . . .
, . . . .
,
. . . . > , 4,~
30
v ~ v
v
~ 2 0 f , , , ,
' ~
0
10
Fig. 3. Field of existence of the transition. Note that the tran- sition to the oscillatory mode is no longer observed for jet di-' ameters exceeding the capillary length of water (/c = 2.0 mm).
stroboscopic lighting is thus necessary to visualize the phenomenon (Figs. 2(c) and (d)).
The oscillatory transition is observed for very nar- row ranges of parameters. It is no longer observed for jet diameters larger than 2.5 mm, nor is it observed for too large depths h. Actually, the smaller the diamter of the jet, the deeper the transition can be observed: from a maximum depth of 1.5 cm for a 2.0 mm diam- eter jet to a maximum depth of 3 cm for a 0.5 mm di- ameter jet. This is summarized, qualitatively, in Fig. 3, where the shaded area represents the existence field of the transition: in this area, the oscillatory mode appears above a flow rate threshold value depending both on the diameter 0 and on the depth h of the jet.
3.2. Measurements
3.2.1. Measurements at the threshold
Using a photodiode (placed above a given point of the free-surface) and a large spectrum lighting source, the time dependence of the surface deformation has been analysed using a spectrum analyser. Just above the threshold, the spectrum displays a fundamental mode harmonics (cf. [27]). The dependence of the frequency of the fundamental mode with the depth h and the diameter 0 of the jet nozzle has been ex-
4, 4,
20
30
{a)
Depth h (ram)
40
" ' ' I ' ' ' I ' A N -I-g
30
O"$
%o
41,
LL20
' ' ' ' ' ' ' ' '2.2
2.6
3.0
(b)
Bump height (mm)
Fig. 4. (a) Variations of the eigenfrequency of the oscillatory mode (at the threshold) versus depth. 0 = 1.44 mm. (b) Corre- lation between the eigenfrequency of the mode and the bump height (at the threshold). 0 = 1.44 mm.
amined closely. Fig. 4(a) shows the variation of the frequency of the oscUlato:'y mode (at the threshold) versus the depth h for a 1.44 mm diameter jet. The fre- quency is a decreasing function of depth. Three linear trends can be distinguished- for very shallow depths, below .5 mm, a strong negative slope is observed; then, between 5 and 20mm, the slope is moderate; finally, between 20 and 30mm, the frequency de- creases only slightly with depth. For the same depths, the height of the bump (at the threshold) has also been measured. When the frequency is plotted versus the height of the bump (Fig. 4(b)), a liaear trend is observed, and the frequency decreases with increas- ing height. Note that the frequency (at the threshold) decreases from 40 to 20 Hz, while the bump height (at the threshold) increases from 2.2 to 3. I ram, when the depth h is increased from 1 to 30mm (Fig. 4(b)).
S. Houard et aL/Physica D 99 (1996) 318-338 323
The dependence of the frequency upon the diameter of the jet has also been examined. For a depth of 10mm, the frequency at the threshold is 36, 27 and 20 Hz, respectively for jet diameters of 1.0, 1.44 and 2.0 mm: the frequency decreases when the diameter of the jet increases.
3.2.2. Measurements above the threshold (at a fixed
depth)
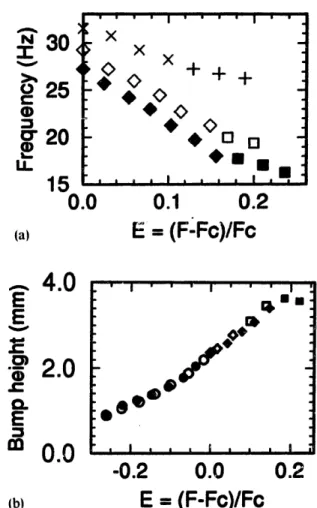
When the flow is increased above the threshold, the fundamental peak is enlarged and the harmonics dis- appear, buried in the background noise: the sharpness of the monoperiodic mode decreases as the spread- ing from the threshold increases. Indeed, the motion of the bump appears to be more complex: the oscil- lation in the horizontal plane is contaminated by the vertical gravitational collapses of the bump, hence the enlargement of the peak. At the end, the spectrum has become large and the jet is in the well-known foun- tain regime. In Fig. 5(a), tile frequency is plotted ver- sus the relative spreading e = ( F - Fc)/Fc from the flow rate threshold Fc, at depths of 2, 5 and I0 mm, for a jet diameter of 1.44 mm. For a given depth, two different symbols are used to distinguish the os- cillatory regime (diamonds) and the fountain regime (squares). Note that the frequency of the oscillatory mode decreases linearly as ~ increases. The slope is the same for depths of 5 and 10 mm, but is slightly different for a depth of 2 mm. In Fig. 5(b), the corre- sponding bump height is plotted versus e for depths of 5 and 10mm. The symbols are the same as in Fig. 5(a), except that a third symbol (circles) is used for negative values of e, corresponding to the case of Figs. 2(a) and (b). In the oscillatory regime, the height of the bump increases linearly as e increases. When plotted together, the frequency and the bump height still display a negative linear tendency as in Fig. 4(b), but the slope is smaller. The difference in slope may result from the vertic::l fluctuations of the bump observed above the threshold: the height which is indeed measured is the maximum height reached by the bump. The physical link with the frequency is thus perhaps not as direct as for the measures at the threshold.
30
2s
20
g .15
(a) . . . . I . . . . I ' " ; x x x+ + +
0
O _
°g-S
, • I . . . . I m0.0
0.1
0.2
E== (F-Fc)/Fc
A 4 . 0E
E
• 2 . 0 ¢.. Q.E
: 3m 0 . 0
• I ' ' ' I ' ' ' I ~ n n_ /
O @ @ o e ' I I ! I t I , , , I-0.2
0.0
0.2
E =
(F-Fc)/Fc
Fig. 5. (a) Variations of the eigenfrequency of the oscilla- tory mode for increasing flow rate values above the thresh- old. 0 = 1.44mm; x+: h = 2ram: o.~: h - 5mm; @U:
h - IOmm. (b) Variations of the bump height for increasing flow rate values above the threshold. O = 1.44 ram. Non-filled symbols: h = 5 mm; filled symbols: h = IOmm. oe: ~ < O, no motion; oO: ~ > O, oscillatory mode: E3,: e > 00 fountain regime.
To summarize:
- above some flow rate threshold value, the bump at the vertical of the .jet exhibits a monoperiodic oscillatory mode,
- at the same time, surface waves with a spiral geom- etry are generated,
- at the threshold, the frequncy of the mode decreases with increasing depth or with increasing diameter of the jet. The decrease is more pronounced at shallow depths,
- when the flow rate is increased above the threshold, the bump height increases while both the sharpness of the mode and its frequency decrease,
- t h e frequency decreases linearly with increasing bump height.
324 S. tlouard et al./Physica D 99 (1996) 318-338
3.3. Jet instability
At this stage, we would like to give some highlights on the possible origin and mechanism of the transi- tion. The existence of a water/air interface is likely to play a crucial role in the oscillatory phenomenon which is observed, Indeed, the role of the capillary forces is pointed out (Fig. 3), by the fact that the tran- sition is no longer observed for jet diameters larger than the capillary length of water (Ic =2 mm [26]). The role of surface tension has been verified by adding drops of liquid soap: the threshold of the transition is then reduced significantly, whereas the frequency of the oscillation is only slightly modified. Below the threshold, a steady deformation of the surface is ob- served (Figs. 2(a) and (b)), which results from the ver-" tical balance of the following forces: gravity, which tends to reduce the height of the bump; surface tension, which tends to minimize the surface of the bump; and the thrusting force of the jet, which tends to increase the height of the bump, which is interpreted as an en- trainment motion initiated by a jet helical instability.
At the threshold, the surface bump undergoes a circular motion (Fig. 2(c)), generating surface ripples with a spiral pattern (Fig. 2(b)). The spiral pattern indicates that the source radiating the ripples is rotat- ing at the frequency of the bump motion itself. Since laminar jets display helical instabilities that would well explain the particular geometry of the waves at the surface, we think that the instability we observe originates in the submerged water jet beneath the bump.
Few studies have been devoted to instabilities in a laminar jet. Batchelor and Gill [291, using a linear sta- bility analysis in an inviscid fluid, showed that the he- lical and sinuous modes were the preferred modes of instability for a laminar jet. In an early dye experiment, Reynolds [30] observed sinuous undulations in a natu- rally excited liquid jet for a Reynolds number between 10 and 300. Both experimental [31-33] and theoreti- cal [31,34,351 studies have since confirmed the exis- tence and predominance of helical instabilities in such laminar jets. In the present experiment, the Reynolds number Re =
uO/t,
of the jets (where u =F/S
is the ratio of the flow rate over the nozzle surface, andthe diameter of the jet) remains moderate - 300-600 at the transition threshold - but is large enough for instabilities to be able to develop [36]. However, the development of instabilities in unstable jets is highly dependent on the velocity profile at the nozzle exit of the jet. In our experiment, the moderate Reynolds number
Re
of the jets, along with the large nozzle length to nozzle diameter ratio r of the jets (r = 6 with perforated plates, r = 20 with the early prototype with pipes), should make this profile rather smooth, if not that of a laminar jet exactly.As a conclusion, we think that the oscillatory mo- tion of the surface bump is a materialization of the helical instabilities which develop in the submerged water jet. Since a dynamic upward pressure is needed to maintain the surface bump to a given height, and since no variation of the bump height is observed dur- ing its oscillatory motion (at the threshold at least), it shows that the surface bump just follows the rotary motion of the jet column in perfect synchrony. How- ever, the existence of a correlation between the surface bump height and the eigenfrequency of the oscillation (Section 3.2) indicates that the surface, which is the upper limit of the oscillating jet column, may control the eigenfrequen'cy of the instability through the size of the bump. Indeed, considering the bump like the mass of an inverted pendulum would well explain the decrease of frequency observed for increasing bump height (or increasing flow rate).
Note that a sinuous mode is also observed for rather shallow depths (a few millimeters) and for flow rates just above the threshold. The bump then describes a rectilinear motion and hemi-,circular concentric ripples are generated. However, when the depth is increased, or when the flow rate above the threshold is increased, only the helical mode is observed, in agreement with previous observations or stability analysis [29,31].
4. Collective modes
4. !. Two coupled jets and line of coupled jets
Above the flow rate threshold value, each jet is an oscillator whose eigenfrequency depends both
S. Houard et al./Physica D 99 (1996) 318-338 325 on the depth h and on the flow rate F. To be-
gin with, we conducted simple experiments with two coupled oscillating jets. The influence of the depth h, the flow rate F and the distance d be- tween the jets was investigated. When d is smaller or equal to 12mm, the jets oscillate at the same frequency and are either in phase (acoustic mode) or :t phase-shifted (optical mode). Transitions are observed between the two modes with varying flow rate or depth. When the distance d between the jets is increased, the jets begin to display incoherency, oscillating at two distinct frequencies. However, the difference A f depends on the depth of the jets be- low the surface. For instance, for d = 24mm, we measured A f for different depths at the flow rate threshold of the instability, we obtained A f = 4 Hz at h = 2ram; A f = 2.5Hz at h -- 5mm; A f =
l.SHz at h = 10mm and A f = 0 (synchrony) for depths larger than 13 mm. One should keep in mind that the deeper the jets below the surface, the larger the bumps at the surface at the critical flow rate, and the stronger the surface waves. If, as will be developed in a following section, we think that the oscillators couple through the surface waves radiating from the bumps, it should not be surpris- ing that synchrony is recovered for large depths. It is thus uneasy to determine a unique critical dis- tance of interaction between the jets. Moreover, for a given depth h, the critical distance depends also on the couple of jets chosen. For instance, tbr one couple, incoherency appeared at d = 48 mm, whereas synchrony still prevailed for another couple. This may result from little differences in diame- ter when the holes are machined. The "population" of oscillating jets could then present a frequency bandwidth A f depending on the quality of the machining.
Systems consisting of lines of jets have also been in- vestigated. Acoustic and optical modes similar to those of systems of lines of vortices [ 19l were observed, with transitions between the two modes when the flow rate or the depth are varied. It should be noted that when increasing the flow rate, the instabilities usually ap- pear first for the two jets situated at the end of the line.
4.2. Bidimensional networks 4.2.1. Description o f the modes
Let us now explore the collective dynamics of bidimensional networks of such oscillators. To do that, a set of removable plexiglass plates has been machined, including three different geometries, and for each of them different sets of plate parameters (Table 1 ).
When coupled together, the jets always remain syn- chronized at the same frequency and oscillate with the same amplitude. Note that unlike in the two-jet system, and because of the necessary confinement of the exper- iment, the first neighbours of any jet are now always closer than 12 mm (Table I). The collective modes display a monoperiodic time dependence simply char- acterized by its eigenfrequency. The spatial organi- zation of the system is dominated by phase-locking phenomena: the initial network of jets subdivides into several sublattices of in-phase jets. To determine the spatial organization of the system, a stroboscopic light- ing is used, at a frequency close to that of the eigen- frequency, and the residual motion of the network of bumps is observed. A grazing or vertical (using a beam-splitter plate) stroboscopic lighting is used, and a video recorder is placed at the vertical of the system. In the helical instability mode, each oscillator, or bump, is characterized by its direction of rotation and by its phase shift relative to other bumps. To deter- mine the latter, note that since the source of the rip- ples is rotating, the initiating point of the spiral pattern (Fig. 2(d)) can be identified easily at every instant. To identify the different collective modes, the following procedure is adopted: a given jet is taken as a refer- ence, and the comparative state of its nearest neigh- bouts is observed (comparative direction of the helix and phase-shift). This empirical procedure proved to be the most accurate since all collective modes show invariance by translation properties.
For each network geometry, different sets of plate parameters have been tested (Table 1), and a few col- lective modes have been identified. For each mode, a name has been given, specific to the particular ar- rangement of the bumps. All the modes that have been
S. Houard et al./Physica D 99 (1996) 318-338 326 (a~ t
@ ,
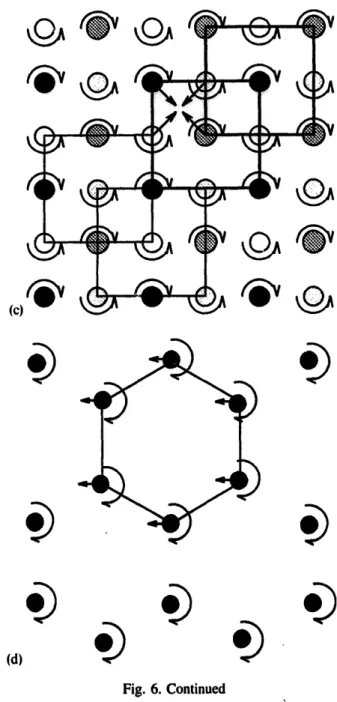
(c) (b)Fig. 6. Collective phase-locking modes. Fol each mode, the direction of rotation and the phase of the oscillators are repre- sented using a surrounding arrow and grey pattern circle, re- spectively. Jets in phase are represented by same patterns and define sublattices whose mesh is drawn with either thin or thick lines, according to the direction of rotation. Square geometry: (a) diagonal mode, (b) gearing mode, (c) simultaneity mode.
The arrows indicate the comparative instantaneous vector posi- tion of four neighbouring jets. Hexagonal geometry: (d) acous- tic mode, (e) inscribed triangles mode, (f) asymmetrical 2d hexagon mode, (g) 3d hexagon mode. Triangular geometry: (h) acoustic mode, (i) parallel mode, (j) asymmetrical 2d hexagon
mode.
identified in the three geometries are represented in Fig. 6. For each mode, the direction of rotation and file phase of the oscillator are represented using a sur- rounding arrow and a grey pattern circle, respectively.
(d)
Fig. 6. Continued
Circles with the same grey pattern correspond to jets rotating in phase in the same direction.
In the square geometry, three modes have been iden-
tified: diagonal, gearing and simultaneity.
The diagonal mode is rather simple: all the jets
rotate in the same direction (see Fig. 6(a) for the schematic representation, and Fig. 7 for the real system). The first neighbours of a given jet of ref- erence are phase-shifted by 7r with it, whereas its second neighbours are in phase with it. The jets in phase arrange thus in two sublattices phase-shifted of ~r, whose mesh is a square of size , j ~ (thin line squares of Fig. 6(a)). Arrows are used to represent
S. Houard et aL/Physica D 99 (1996) 318-338 327
,)
o)
©
328
the instantaneous position vector of the four nearest neighbours.
In the
gearing
(Fig. 6(b)) andsimultaneity
(Fig. 6(c)) modes, the jets arrange in two distinct sub- networks (one for each direction of rotation). Each subnetwork is subdivided into two a- phase-shifted sublattices where the jets rotate in phase in the same direction. The mesh of the sublattice is a square of size 2d (thick and thin lines are used to distinguish the two subnetworks or the two directions of rotation). The first neighbours of a given reference jet rotate in the direction opposite to that of the reference, whereas the second neighbours rotate in the same direction but display a phase-shift of n" with it. The differ- ence between the
gearing and simultaneity
modes is the comparative instantaneous position of the near~ est neighbours: in thegearing
mode (Fig. 6(b)), the arrows point alternatively at the centre of a four-jet unit, whereas in thesimultaneity
mode (Fig. 6(c)), they all point at the centre simultaneously, hence the respective names.In the
hexagonal geomet~.,
four different modes have been identified:acoustic, inscribed triangles,
asymmetrical 2d hexagon and 3d hexagon.
The
acoustic
mode (Fig. 6(d)) is the simplest one: all the jets rotate in phase in the same direction.The
inscribed triangles
mode (Fig. 6(e)) is the trans- position of thediagonal
mode to the hexagonal geom- etry: the squares of size ~ are replaced by equilat- eral triangles of size ~ f ~ .The
asymmetrical 2d hexagon
mode (Fig. 6(0) is less symmetric than the previous ones. The jets arrange again in two distinct subnetworks (one for each direction of rotation), but one quarter of them rotate in the first direction whereas the other three rotate in the opposite direction. For the jets of ref- erences of the first type (blank circles of Fig. 6(f)), all the first neighbours rotate in the direction oppo- site to that of the reference, whereas for the jets of reference of the second type (black and grey circles), one-third of them rotate in the direction opposite to that of the reference and the other two-thirds ro- tate in the same direction. The jets in phase of the first type arrange in one sublattice of hexagons of size 2d, The jets in phase of the second type at-S. Houard et aL/Physica D99(1996) 38
/ . . . . . . .
Fig. 7. Collective diagonal mode for a square geometry (seen from above).
range in three phase-shifted sublattices of hexagons of size 2d. The difference between all the previous modes is that two jets of reference (one of each type) are now needed to derive the spatial organiza- tion of the network using invariance by translation properties.
In the 3d
hexagon
mode (Fig. 6(g)), the jets arrange in two distinct subnetworks too (one for each direction of rotation). Each subnetwork subdivides into three phase-shifted sublattices where the jets rotate in phase in the same direction. The mesh of the sublattice is a hexagon of size 3d. For both subnetworks, the first and third neighbours of a given reference jet rotate in a direction opposite to that of the reference, whereas the second neighbours rotate in the same direction but are phase-shifted with it. Note that in contrast ,with all the previous modes, the phase-shift of the second neigh- bours depends on the eigendirections of the network. In the triangular geometry, three different modes have been identified:acoustic, asymmetrical 2d
hexagon
andparallell
The
acoustic mode
(Fig. 6(h)) is simply the trans- position of theacoustic
mode of the hexagonal geom- etry. The same remark stands for theasymmetrical 2d
hexagon
mode (Fig. 60)) too.The
parallel mode
(Fig. 60)) is specific to the trian- gular geometry. The jets arrange in two distinct sub- networks (one for each direction of rotation). Each subnetwork is subdivided into two n" phase-shiftedS. Houard et ai./Physica D 99 (1996) 318-338 329
sublattices where the jets rotate in phase in the same direction. The mesh of the sublattice is a hexagon of size 2d (thick and thin lines are used to distinguish the two subnetworks, or the two directions of rota- tion). In contrast with all the previous modes, all the first neighbours of a given reference jet do not ro- tate in the same direction: one-third of them rotate in the same direction as the jet of reference, whereas the other two-third rotate in the opposite direction.
4.2.2. Diagrams of stability
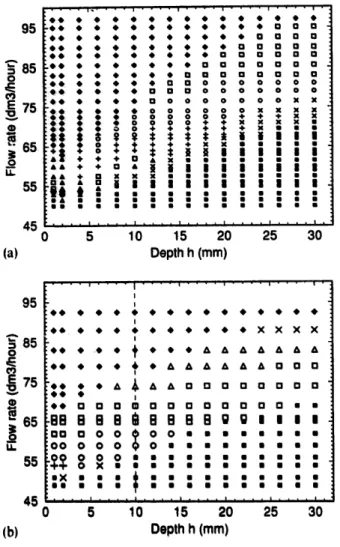
For each set of plate parameters of Table 1, a stabil- ity diagram has been constructed, where the field of ex- istence of the different collective modes is represented in a bidimensiona! flow rate (F)/depth (h) space. Two diagrams are represented for the square geometry (Fig. 8) and the hexagonal geometry (Fig. 9). The dia- grams are built up using the following procedure: the flow rate is decreased by regular steps, and for each flow rate value, the plate is lifted by 2 mm steps, from a depth of 3 cm to the surface (the transition for a single jet is not observed deeper). For each diagram, a sym- bol representing the state of the system is reported for each couple of discrete (Fi,
hi)
values of the param- eters F and h. The filled-square symbols correspond to low flow rate values (below the threshold): no indi- vidual or collective instability is observed. The filled- diamond symbols correspond to high flow rate values: each water jet is in a fountain regime and no collec- tive mode is observed. In-between, each symbol zone represents a particular collective mode among those described above. Plus symbols represent regimes inter- mediate between two well determined phase-locking modes. Cross symbols represent regimes with inter- mittent coupling of the bumps: such regimes are ob- served just above the threshold. In Fig. 8(a), the dashed curve represents the variation of the flow rate thresh- old versus the depth of the plate: note that the thresh- old increases roughly linearly with the depth.For the square geometry (Figs. 8(a) and (b)), the
diagonal, gearing
andsimultaneity
modes are repre- sented by circle, square and triangle-right symbols, respectively. Two other modes have been observed marginally at rather shallow depths: triangle-up sym- bols correspond to anoptical
mode between the lines1 1 5 • .-. 1 0 5 O o~ 9 5 E 8 5 ~= 7 5 .9o I J . 6 5 55 (a) , , i . . . . i . . . . i . . . . I . . . . i . . . • ~ e e e e e e e e ~ o e i ~ e e e e e e e e e e o a a a ~ e e e e e e e e a o o a a a ~ e e e e e a a a a a a a a a ~ * * * * a a a a a a a a a a ~ e e . e a a a a a + + + 4 . + ~ e e e a a + o o o o o ~ • • o o 0 o o o ~ ~ • • o o o o o o 0 0 ~ • • u • • • O O O O O O ~ ' ; ' m • • • m • • m x o 0 0 j....u"m m m m m • m • m • ~n~,.~ ~ ~ - m • • • • u • . m m m • • m m m m m m • • • • • • • • • u • • • • • m • • I I • • • • • • • • • • • l • • .... I .... I l t l l l l l ll l .... Illlt l I 5 10 15 2 0 2 5 3 0 D e p t h h (ram) 50 A 0 40 E o • a0 E 20 (b) . . . . i . . . . i . . . . i . . . . , i . . . . i . . . . ~ • 7 C O • • • • • e e e, e 41, I > I > I > I > l e e 41' • • • • 41, o e, e i > !> i > i > i >
e e • • • • • • e e I~ i> i> i> i> i> e e • • • • • • • I~ I> I> I> I> I> I>
e e • • • • i> i> I> I> I) I> I> I> 4. +
e e • • • • I> I> I> I> I> + + o o a e e • • • ~> t> J> ~> + a o a a o a o * • • • ~ + a a a a a a a x x O e • • • 0 . 0 0 0 0 O 0 x • • • e e • • o o o o o o X • • • • •
tt B BIIIIIIIIII
° I88 • " "I
B m ,,,it• • ....• • I, .• ,,I• .... I tt t l l l tl , l • , 0 5 10 15 2 0 2 5 3 0 D e p t h h (ram)Fig. 8. Collective modes' stability diagrams - Square geometry:
(a) N = 57, d = 12 mm, O = 1.0 ram; (b) N = 5 7 ; d = 6 mm:
O = 0.5 mm. l : no collective dynamics; O: fountain regime; ×: nonpermanent regime: 4-: unidentified regime: o:
diagonal
mode; n:
gearing
mode; ~:simulta,eity
mode: 4:optical
mode: *:shear
mode.(or the columns) of the square network, whereas star symbols correspond to a
shear
mode between the lines (or the columns). Note that in these two modes, the jets are in the sinuous instability mode and not in the helical mode as for all the previous collective modes. The plate parameters for the diagram of Fig. 8(a) are N = 57, d = 12 mm and 0 = 1.0 mm, whereas those for Fig. 8(b) are N = 57, d = 6 mm and 0 = 0.5 mm (Table 1). Note that thed/dp
ratio(d/O
= 12) is kept constant for both diagrams.First, a comparison between the two diagrams shows that the field of existence of the different col- lective modes is shifted. Moreover, the
simultanei~
q
S. Houard et al, IPhysica D 99 (1996) 318-338
330 e • 95 '** 0 • q ) o o o .~ 85 "** E 75 - * * ~ s5 .I! L~ ~ 55 . a , 45 "" 0 (a) • . i . .... e .... ! .... i .... i .... i • • • • • • • • • • • • • • • @ • • • @ @ • • • • • 0 0 0 • • • • • O • • O • 0 0 0 0
: : : : : : : : ~ g g g g g
• O • • 0 • • 0 0 0 0 0 0 0 • • @ O • • a a O a o a o o • • • • • a Q 0 0 0 0 0 0 0 0 • • 0 O O O 0 0 0 0 0 0 0 • • • • 0 0 0 0 0 0 0 0 X X $ 8 t t ¢ I I g ~ i i I I I + + u A t i I I I I I I I Ii'
, i l l l ; ; i l ,
• | |'ii'
,
, , I , , , , l l l . . ! . . . . i . . . . i . . . . i . 5 10 15 20 25 30 Depth h (ram) 95 A b. = 85 0 ID ~ 65 I u~ 55 I . . . . ! . . . . I . . . . i . . . . i' . . . . i . . . . ! • ;I @ @ @ @ • @ @ • • @ • @ @ @ • I ~ e a • • # • • • • • • • X X X X t " ~ e ~ -O O + e $ • A A A A A d d u e e • • • • • d A A d A A O O Qi
; • • • • A A A Q a O a O a D O / • • 0 O 0 ~ O ~ Q O O 0 O ~ • • ,BB B B B g B B B B g g I I I I O 0 0 0 0 ~ 0 0 • • • • • • • • O 0 0 0 0 ¢ 0 • • l • • • • • • , g g ° o ° ° . : : : : : : : : : : :: x : : : l : : : : : : : : : :
4 5 .... i .... i .... | .... i .... i .... i , 0 5 10 15 20 25 30 (b) Depth h (ram)Fig, 9. Collective modes' stability diagrams - Hexagonal ge- ometry: (a) N = 46, d = 12ram, ¢) = 1.0mm; (b) N = 46, d -- 8 ram, ~ = 1.0 ram. I : no collective dynamics: @: tbun- rain regime: ×: nonpermanent regime: +: unidentified regime,: o: acoustic mode: [3: 3d hexagon mode:/1: inscribed triangles mode: *: asymmetrical 2d hexagon mode. The same scaling is applied for both panels (a) and (b).
Second, the same modes can be observed for flow rate values far different: the
diagonal
andgearing
modes are observed in both diagrams 8(a) and (b), corresponding to 1.0 and, 0.5 mm diameter jets, re- spectively. Third, for each diagram, transitions are observed from one mode to another when the flow rate F (alone) or the depth h (alone) is modified: note for instance the transition from the
gearing
to thesimultanei~,
mode when the flow rate increases, for a depth of lOmm, or when the depth decreases for a flow rate of 37.5 dma/h (Fig. 8(b)).For the hexagonal geometry (Figs. 9(a) and (b)), the
acoustic, inscribed triangles, 3d hexagon
andasym-
metrical 2d hexagon
modes are represented by circle, triangle-up, square and star symbols respectively. In this geometry, no collective mode corresponding to the sinuous instability mode of the jets has been observed. The plate parameters for the diagram of Fig. 9(a) are N = 46, d = 12 mm and 0 = 1.0 mm, whereas those for Fig. 9(b) are N = 46, d = 8 mm and 0 = 1.0 mm. This time, only the distance d between nearest jets has been changed (from 12 to 8 mm). The significance of the vertical dashed line drawn for a depth of l0 mm will be examined in the next section.A comparison between the two diagrams shows, again, that the field of existence of the different col- lective modes is shifted. Transitions from one mode to another are observed, again, when the flow rate F (alone) or the depth h (alone) is changed: note for instance the transition from the
acoustic
to the 3dhexagon,
then from the 3dhexagon
to theinscribed
triangles
mode when the flow rate is increased for a depth of 10mm (Fig. 9(b)).4.3. Mechanism of coupling between the jets
Two major questions arise concerning tile coupling between the jets:' (i) By what mechanism do the os- cillating jets couple to each other? (ii) What governs the transitions that are observed between the different collective modes?
In the bidimensional system of co-flowing air-jets of Villermaux and Hopfinger [26], the existence of a fluid recirculation cavity due to the confinement of the jets by their nearest neighbours is crucial to the phenomenon of individual and collective oscillation. In the present experiment, the 3D recirculation of the jets does not seem to be of crucial importance. In- deed, a gi~;en collective mode can be observed with either a system of tubes (see Section 2) or perforated plates, and for depths of either 1 or 3cm, provid- ing quite different recirculating patterns for the jets. On the other hand, no coupling between the jets has ever been observed in the absence of surface waves radiating from the oscillating bumps. As pointed out above for two-jet systems, the coupling between the jets seems to be stronger when the jets are set deep below the surface, generat ag stronger surface ripples.
S. Houard et al./Physica D 99 (1996) 318-338 331
Surface waves could thus convey the interaction be- tween the jets, providing long distance rather than dif- fusive coupling of the oscillators.
Concerning the transitions observed between the different modes in the stability diagrams, a first intu- itive interpretation is that the bifurcations result from the co~|finous increase (or decrease) of a pertinent cou- pling parameter. Since surface waves provide the most plausible mechanism of coupling, the pertinent cou- pling parameter should include some of the character- istics of the waves.
The experiment is governed by three parameters: the flow rate F, the depth h and the distance d be- tween nearest neighbours (for a given geometry). Using the different stability diagrams obtained for the sets of plate parameters of Table 1, the respec- tive role of the three parameters is highlighted using three different transformations where one of the three parameters is changed while the other two are left constant. We consider thus transformation o~: h and d constant, F increases, transformation fl: F and d
constant, h decreases and transformation y: F and h
constant, d decreases. For each geometry, the same
sequence of bifurcations from one mode to another is observed for the three transformations:
square geometry - diagonal-, gearing - , simui- tanei~, mode; hexagonal geometry - plus symbol - , acoustic - , 3d hexagon --, inscribed triangles mode;
triangular geometry - parallel - , acoustic mode.
Note that the validity of the above sequences can be partially checked using the stability diagrams of Figs. 8 (square geometry) and 9 (hexagonal geome- try). The term "partially" stems from the fact that a complete sequence is never observed along a single horizontal or vertical profile of a stability diagram (at best, two transitions can be observed along the same profile: vertical dashed line of Fig. 9(b)). To derive the above sequences, a complete set of stability diagrams is thus required.
A surprising feature is observed, which is not rep- resented here: in many cases, the sequence of bifur- cations loops, so that increasing (or decreasing) again the single parameter of the transformation induces the first mode of the series to replace the last one. This is observed for transformations (o~) and (fl) in the square
geometry, for transformation (or) in the hexagonal ge- ometry, and for transformations (o~), ( i l l and (y) in the triangular geometry. Finally, collective modes with very reduced existence fields in the diagrams (optical
and shear modes in the square geometry, and asymmet- rical 2d hexagon modes in the hexagonal and triangu-
lar geometries) have not been included in the present analysis.
Different coupling scenarios are now considered, , whose validity is examined with regard to the above sequence of modes. First, the role of the flow rate F and of the jet velocity u0 at the nozzle exit is exam- ined briefly: as pointed out above itt the comparison of diagrams 8(a) and (b), the same collective mode can be observed for very different flow rate values: this shows that the flow rate is not a relevant quantity for the coupling between the jets. The mean velocity u0 at the jet exit is neither a relevant quantity: transitions are observed between modes when d is decreased at constant F and 4, values (and thus at constant u0 = cte*
F/02).
Finally, the marked difference between di- agrams 8(a) and (b) shows that d/O is not a relevantquantity either.
The next scenario was to consider the height of sur- face bumps as a possible quantity relevant to coupling. First, the oscillatory mode for a single bump starts when the height of the bump reaches a threshold value (Fig. 2). Second, the same height can indeed be ob- tained for flow rate values far different if the diam- eter of the jet is changed, like in Figs. 8(a) and (b). • Third, the frequency of the oscillatory mode and the height of the bump are correlated (Section 3.2). In the case of a single jet, we have verified that when the flow rate (alone) increases, or when the depth (alone) decreases, the height of the bump increases. The se- quence of modes observed for both transformations ot and fl could then be interpreted as a consequence of the continuous increase of bump height. However, this hypothesis breaks down when transformation y is considered: when the distance between the jets is re- duced, at constant F and h, the height of the bumps is left unchanged, whereas transitions between collec- tive modes are still observed.
Let us now consider that the coupling is not gov- erned by the height of the bump itself but by the
S. Houard et aL/Physica D 99 (1996) 318-338 332 A N ~
z 30
C• 20
1! ¸ 055
iii l • • | I , I ~ I a65
75
85
Flow rate (dm3/hour)
Fig. 10. The frequency of the collective modes is measured across the vertical dashed line profile of Fig. 9(b), for increasing values of the flow rate above the threshold. The symbols are the same as in Fig. 9(b). Note the marked jump of frequency each time the system switches to a new mode.
amplitude of the surface ripples that are generated at a distance d from the radiating bump (see Section 3). Note that this is equivalent to considering an adimen- sional coupling parameter constructed as the ratio of the bump height to the distance d of the first neigh- bouts. This explanation is still coherent with the se- quence of modes observed for both transformations and ~: if the height of the bump increases, the am- plitude of the surface ripples increases in the same way. It is also coherent with the sequence observed for transformation 3,: the conservation of energy implies decrease of the amplitude of the ripples when the radial distance from the point source increases. Thus, if the jets are brought closer, the amplitude of the rip- pies at the distance of the first neighbours increases, in agreement with the sequence of bifurcations. How- ever, this scenario does not account for the looping of the sequence of modes.
Anyway, surface wav=s remain the most plausible means of coupling, One should thus consider the thor- ough interaction between an oscillating jet and the surface waves that propagate from all the other jets of the network, in particular resonance effects such as the tuning be~een the wavelength of the collective modes and the discrete wavelengths of the network. This tuning effect could well explain the looping phe- nomenon observed for the sequence of modes, and would provide a valuable insight into the mechanism
of transition from one mode to another. In Fig. 10, the frequency of the collective modes has been measured along the vertical dashed-line profile of Fig. 9(b), using a photodiode and a spectrum analyser (same set-up as in S~tion 3), ~ e variations of the frequency are plot- ted for increasing flow rate values above the thresh- old, for a depth of 10 mm. The symbols are the same as those used in Fig. 9(b). When the system remains in the same phase-locking mode, the frequency de- creases smoothly with increasing flow rate. However, each time the system switches to another mode (from
the acoustic
to the 3dhexagon
mode, then from the 3dhexagon
to theinscribed triangles
mode), a sharp drop of frequency occurs. Now decreasing the flow rate in a reverse path, a slight hysteresis phenomenon is ob- served, which is not represented in Fig. 10. In contrast with the case of a single jet (Section 3), the sharpness of the collective mode does not decrease when the flow rate above the onset of the mode increases. The peak of frequency ;.n the spectrum remains narrow in- stead. In our opinion, this results from the possibility of bifurcating from one collective mode to another.At this stage, we propose the bifurcation from one mode to another to be governed by a tuning criterion between the wa~/elength of the oscillatory mode of the jets and the discrete wavelengths associated with the periodic bidimensional pattern of the network. The mechanism might be as follows: the frequency, and hence the wavelength of the oscillatory mode of the jets are governed by external variations of the param- eters F and h and by the surface waves. The system adjusts until the tuning of the present collective mode (imps below that of a new collective mode, with some hysteresis however. Thea the system bifurcates to the new mode.
4.4. Considerations of symmetry
General conclusions can be drawn from the descrip- tion of the collective modes (Section 4.2.1):
- the jets always oscillate at the same frequency and with the same amplitude,
- the sublattices defined by the jets in phase are reg-
ular polygons whose symmetry is that of the perfo- rated plate,
S. Houard et al./Physica D 99 (1~'~6) 318-338 333
- the mesh of all different sublattices is the same, - the spatial arrangements display no modulation, and
thus look similar to those encountered in crystals (for example, the
gearing
mode of Fig. 3(a) is the analogous of a NaCl crystallographic structure). All this is relevant to a strong coupling between the jets. However, the coupling is not strong enough to perturb the limit cycles of the oscillators [4]. Although a mechanism has been proposed in the previous sec- tion to explain the transitions between the collective modes, the criteria of selection of the particular topol- ogy of the collective modes (see Section 4.2. !) are still unclear. For example, thediagonal
(square geometry)and inscribed triangles
(hexagonal geometry) modes have no equivalent in the triangular geometry, and thegearing and simultaneity
modes have no equivalent in the hexagonal and triangular geometries.Using considerations of symmetry, it is indeed pos- sible to explain some of these features. To investigate the symmetries of the system of coupled water jets, two different approaches are considered: the reference jet approach and the group theory approach. The first one is rather specific to the present experiment and derives from the experimental procedure adopted to observe the collective modes. The second one is more generic and examines the spatio-temporal symmetry groups of the collective modes.
4.4.1. Reference jet approach
This approach derives naturally from the obser- vations: it stems from the fact that the collective modes display invariance by translation properties. Indeed, except for the asymmetrical 2d
hexagon
mode, the spatial arrangement of the network can be reconstructed using
one
reference jet only, a ba- sic pattern for its nearest neighbours, and invariance by translation properties. Nov/using this invariance by translation property as a basic postulate, a sys- tematic investigation of all the possible modes is undertaken. With this aim, the following procedure has been adopted: a given jet is taken as a reference, and a systematic investigation of all the possible pat- terns defined by the comparative state of its nearest neighbours is carded out. The comparative state of a1 "~ Neighbouts +1 A~ffiO
gl"
.!!]"
+.~1 ¢qui" partition " 1 ( + I ) 1 2 ( - I ] 2 (+1)1 ! (-ll+l A~ =0 Not Obs I acou~¢ acou~/¢
+ ! Z~ = O diagonal l ~
+I ,t~ ffi 0 di~oonal2 Not Obs 2 ~ ~
- 1 N o t Obs 4
+1 : _ ~ Not Obs 5 parallel
Fig. i 1. Schematic representation of the systematic scheme used to investigate the symmetries of the system. A given jet is taken as a reference, and the comparative state of its first and second neighbours is explored (comparative direction of rotation: " - 1" if opposite, " + I" if same as reference, and for the latter comparative phase shift with the reference jet AO). The corresponding spatial mode is reported for the three geometries. The degree of complexity increases from top to bottom. When the spatial mode violates the basic hypothesis of invariance by translation, an oblique line is drawn in the corresponding box.
neigbouring jet is, again, characterized by the com- parative direction of rotation of its helical mode and, if same direction, by its phase-shift with the reference jet. The procedure is thus the same as that applied for the observations (Section 4.2.1.), but it is extended here to a systematic and comprehensive investigation. The systematic investigation is summarized in de- tail in Fig. 11. The two columns "first neighbours" and "second neighbours" at the left describe the com- parative state of the first and second neighbours of • the jet of reference. The " + 1" ( " - 1 " ) signify that the neighbouring jets rotate in the same (opposite) direc- tion as that of the reference jet. When in the same direction, their phase-shift with the reference jet is in- dicated by the AO value. When the phase-shift is not isotropic but takes different values along the differ- ent eigendirections of the network, a A0 = AO(dir) designation is used. In the three columns at the right, the corresponding spatial arrangement of the jets is re- ported for the three network geometries. Three cases can be distinguished: (i) when the corresponding spa- tial arrangment violates the basic hypothesis of invari- ance by translation, an oblique line is drawn across the box, (ii) when the spatial arrangement has been observed experimentally and is one of the collective
334 S. Houmd et aLIPhysica D 99 (1996) 318-338 modes descried in Section 4.2.1, the specific name
given in Section 4.2.1 is reported, in italics (iii) when the spatial mode has not been observed, a "Not Obs" designation is used.
The degree of complexity of the pattern defined by the first and second neighbours increases from the top to the bottom of Fig. 11. To begin with, the simplest pattern is considered: all the first neighbours rotate in the same direction as that of the reference jet ("+1") and are in phase with it. The following step towards more complexity is to consider that all the first neigh- bours rotate in the same direction as that of the ref- erence jet, but present a same phase-shift A0 with it. The step further is then to consider that the phase-shift is not the same for all the first neighbours, but takes different values according to the different eigendirec- tions of the network (two in the square geometry, three in both hexagonal and triangular geometries): A0 = AOi. As a consequence of the invariance by translation property, the second neighbours rotate in the same direction as that of the reference ("+1") but can be phase-shifted with it. Actually, the comparative state of the third, fourth and even farther neighbours could also be considered, in the present investigation, only first and second neighbours have been retained, although the analysis has been extended to the third neighbours in some cases. This was motivated by the small size of the experimental system of coupled os- cillators (N ranges from 46 to 89 in Table I).
in a next step, the first neighbours rotate all in the direction opposite to that of the reference C - I " ) whereas the second neighbours still rotate in the same direction as that of the reference ("+l"). In anal- ogy with the previous scheme, different cases can be considered according to the comparative phase-shift of the second neighbours .with the reference jet. The cases of zero, non-zero and direction dependent phase- shifts are thus considered successively for the second neighbours. A logical continuation of the investigation scheme is then to consider that both first and second neighbours rotate in the direction opposite to that of the reference jet ( " - I " , " - I " ) .
Finally, in a last step, the case where the first neigh- bouts of the reference jet do not rotate all in the same direction is examined. A further subdivision is made
depending on whether the two directions of rotation are partitioned equally among the first neighbours or not.
Using Fig. I I, let us now compare our predictions to the observations:
First, on the lO collective modes of Section 4.2.1 (helical instability mode of the jet) eight are predicted using the systematic scheme of Fig. l 1. The complex spatial arrangements presented in Fig. 6 are retrieved exactly, which post-validates the observations. The two collective modes which do not appear in Fig. I I are the
asymmetrical 2d hexagon
modes, observed for the hexagonal and triangular geometries. Actually, these can be recovered using a slightly different inves- tigation scheme. Indeed, if two different types of refer- ence jet are now considered, with a distinct pattern for the first and second neighbours, new collective modes can be predicted, among them theasymmetrical 2d
hexagon
mode, that still satisfy some invariance by translation properties (although in a weaker sense). In theasymmetrical 2d hexagon
mode, one of the two ref- erence jets has the ( " - I * " , " - I * " ) pattern of Fig. I! for the columns "first neighbours" and "second neigh- bours", whereas the other one has the 2 (+ I) / l ( -l)
pattern of Fig. I ! for the column "first neighbours". This can be verified in Fig. 60) for instance, where the blank circle symbols have the ( " - I * " , " - 1 ' " ) pattern, whereas all the grey circle symbols have the 2(+ 1 ) / 1 ( - 1 ) pattern.
Second, using the systematic investigation scheme of Fig. 11, it is possible to explain some of the discrep- ancies observed between the square, hexagonal and triangular geometries. As pointed out above in the text, the
diagonal
(square geometry) andinscribed trian-
gles
(hexagonal geometry) modes have no equivalent in the triangular geometry, whereas thegearing
andsimultaneiO,
modes (square geometry) have no equiv- alent in the hexagonal and triangular geometries.In both the