Decisions are often accompanied by an assessment of how likely it is that a choice will be correct. Such confidence judgments are critical in complex environments in which decisions need to incorporate future, not yet observed outcomes based on previous actions, information and outcomes. Determining whether a stimulus is novel or familiar is a complex decision involving the comparison of sensory information with internal variables. Although the outcome is binary (familiar or not), such memory retrieval decisions in humans are typically accompanied by graded judgments of confidence. Such confidence judgments feel automatic and are often accurate1–3. Despite its ubiquity, the mechanism of confidence judgments about memories is not understood. One model proposes that confidence judgments require separate specialized proc-esses that evaluate decisions after they have been made, thereby drawing on metacognitive abilities that may be unique to humans4. In contrast, other models propose that an assessment of uncertainty is an integral and necessary part of any decision-making process itself5. Confidence can therefore be assessed simultaneously and by the same process that makes the decision in the first place, a core concept of Bayesian models of decision-making6. Although recent studies in non-human primates and rodents have provided evidence for the latter model during perceptual decisions3,7, nothing is known thus far about how confidence judgments for memories are made. It has proven challenging to develop proce-dures for animals to communicate an assessment of confidence in an experimental setting, a problem that is particularly acute for memories. We took advantage of the availability of human neurosurgical patients for single-unit recordings to study this question.
The medial temporal lobe (MTL) is required to make declarative memory-based decisions8, and populations of neurons in the MTL whose interaction is thought to underlie this ability have been identified. For example, the response of some neurons in the pri-mate MTL is selective for visual categories or concepts9–12. Others signal whether a stimulus is novel or familiar13–16, a response that can emerge after a single exposure13,14. Such MS neurons represent a potential substrate for episodic memories by marking stimuli as either novel or familiar. If so, we hypothesize that their activity should corre-late with memory strength and with confidence. In contrast, neurons not directly involved in memory retrieval, such as those representing visual features, should not correlate with memory strength.
We used subjective confidence ratings made by subjects during a memory recognition task to identify groups of neurons that signaled memory strength. Our results make two key contributions. First, we found that MS and VS neurons code orthogonal pieces of infor-mation about visual stimuli. Second, only the activity of MS neu-rons correlated trial-by-trial with memory strength. In contrast, the ability of VS neurons to differentiate different stimuli was not sensitive to memory strength.
RESULTS Task and behavior
Subjects (44 sessions from 28 patients; Supplementary Table 1) performed a recognition memory test during which they rated 100 images as seen before or not17. 50 of the images were familiar (shown
1Department of Neurosurgery, Cedars-Sinai Medical Center, Los Angeles, California, USA. 2Department of Neurology, Cedars-Sinai Medical Center, Los Angeles,
California, USA. 3Department of Biomedical Sciences, Cedars-Sinai Medical Center, Los Angeles, California, USA. 4Computation & Neural Systems Program,
California Institute of Technology, Pasadena, California, USA. 5Division of Biology and Biological Engineering, California Institute of Technology, Pasadena,
California, USA. 6Departement de Biologie, Ecole Normale Superieure de Cachan, Cachan, France. 7Division of Humanities and Social Science, California
Institute of Technology, Pasadena, California, USA. 8Department of Neurosurgery, Huntington Memorial Hospital, Pasadena, California, USA. Correspondence
should be addressed to U.R. (ueli.rutishauser@cshs.org).
Received 1 April; accepted 13 May; published online 8 June 2015; doi:10.1038/nn.4041
Representation of retrieval confidence by single
neurons in the human medial temporal lobe
Ueli Rutishauser
1–5, Shengxuan Ye
1,4, Matthieu Koroma
1,6, Oana Tudusciuc
4,7, Ian B Ross
8, Jeffrey M Chung
2& Adam N Mamelak
1Memory-based decisions are often accompanied by an assessment of choice certainty, but the mechanisms of such confidence judgments remain unknown. We studied the response of 1,065 individual neurons in the human hippocampus and amygdala while neurosurgical patients made memory retrieval decisions together with a confidence judgment. Combining behavioral, neuronal and computational analysis, we identified a population of memory-selective (MS) neurons whose activity signaled stimulus familiarity and confidence, as assessed by subjective report. In contrast, the activity of visually selective (VS) neurons was not sensitive to memory strength. The groups further differed in response latency, tuning and extracellular waveforms. The information provided by MS neurons was sufficient for a race model to decide stimulus familiarity and retrieval confidence. Together, our results indicate a trial-by-trial relationship between a specific group of neurons and declared memory strength in humans. We suggest that VS and MS neurons are a substrate for declarative memories.
npg
© 201
5 Nature
America, Inc.
~30 min before the task during a separate learning session) and the other 50 images were novel (stimulus type, familiar or novel). Images were presented for 1 s each and, after a short delay, subjects were asked to indicate whether they had seen the image before (binary decision, new or old) together with a judgment of confidence in their decision (Fig. 1a). Each image belonged to one of five visual categories (cars, foods, people, landscapes or animals; Online Methods).
Subjects correctly identified 69 ± 13% of familiar stimuli and reported 28 ± 17% of novel stimuli as false positives (Fig. 1b). Confidence ratings were systematically related to accuracy (Goodman-Kruskal gamma correlation, g = 0.36 ± 0.37, t test versus chance
P < 10−6): the higher the confidence, the better the accuracy (Fig. 1c–g).
We computed a receiver operating characteristic (ROC) curve18 for each session to quantify the relationship between accuracy and confi-dence (Fig. 1c). The average area under the curve (AUC) of the ROC was 0.75 ± 0.08 (Fig. 1c,d). Different confidence ratings resulted in performance located in different locations in ROC space (Fig. 1c). The ROC was asymmetric (z-ROC slope = 0.78 ± 0.33, significantly less than 1, P < 10−18; Fig. 1e), as expected for declarative memories19. Subjects performed above chance at all levels of confidence and the majority of decisions were made with high confidence (Fig. 1f,g). Subjects assigned medium and low confidences more rarely and with approximately equal likelihood (Fig. 1f). For a balanced statistical comparison between confidence levels with approximately equal trial numbers, we used two levels of confidence for the neuronal analy-sis: high and low. Trials with intermediate ratings were re-assigned a
high or low confidence rating depending on the proportion of trials (irrespective of performance) made with medium confidence (Online Methods). The resulting two confidence ratings were associated with different retrieval accuracy (Fig. 1h).
The decision time (DT, time from question onset till response) varied systematically as a function of confidence and accuracy (repeated-measure ANOVA model, Fig. 1i–l and Online Methods). Correct high-confidence decisions were faster than low-confidence decisions (1.54 ± 0.11 s versus 2.49 ± 0.20 s, main effect of confidence
F1,30 = 25.74, P < 10−4; Fig. 1i). Correct familiar decisions were faster than correct novel decisions regardless of confidence (Fig. 1i). This was also true for incorrect trials: high-confidence incorrect deci-sions were faster than low-confidence incorrect decideci-sions (Fig. 1j). Correct decisions were made with higher confidence than incorrect decisions (1.95 ± 0.06 s versus 1.65 ± 0.05 s; main effect of correctness,
F1,41 = 58.3, P < 10−8; Wilcoxon signed-rank test correct versus incor-rect, P < 2.74 × 10⁻⁹; Fig. 1k). Also, correct decisions were made quicker than incorrect decisions for familiar stimuli (1.41 ± 0.13 s versus 1.78 ± 0.14 s, significant interaction F1,30 = 8.51, P < 0.05, n = 31 subjects). Because incorrect decisions were made more slowly
and with lower confidence, we matched the average confidence in correct and incorrect trials. We found that correct decisions were made faster even after matching confidence (incorrect versus correct: 1.89 ± 0.15 s versus 2.21 ± 0.19 s, Wilcoxon signed-rank test after matching for confidence P < 0.01; Fig. 1l). Together, these findings show that subjects accurately assessed the quality of their memories
d
0.5 0.7 0.9 0 2 4 6 8 Number of sessionsArea under the curve
e
−1 0 −1 0 1z (false alarm rate)
z (hit rate) Subjects Chance
c
0 0.2 0.4 0.6 0.8 1.0 0 0.2 0.4 0.6 0.8 1.0False alarm rate Average Chance C=6 C=5C=4 Individual session C=3C=2 Hit rate
b
Hit rate 0 0.2 0.4 0.6 0.8 1.0 False alarm rate 0 0.2 0.4 0.6 0.8 1.0 Individual session Chance Image (1 s) Blank (1 s)a
Blank (0.5 s) 2 = new, probably 1 = new, confident 3 = new, guess 4 = old, guess 5 = old, probably 6 = old, confidentHave you seen this image before? [1–6] Response
h
Confidence High Low 0 20 40 60 80 100 Accuracy (% correct)g
50 60 70 80 90 Accuracy (% correct) Response Old lowmedOld highOld NewhighNewmedNewlow
Old responses New responses 0 0.1 0.2 0.3 0.4
f
Response Probability of response Familiar stimuli Novel stimuli Incorrect Correct Old low medOldhighOld NewhighNewmedNewlow Confidence
j
High Low Decision time (s) *** 1 2 3 4 Type of trialk
Low (0.5) Med (1.5) High (2.5) *** Confidence Cor Incor Decision time (s)i
Low High Familiar (TP) Novel (TN) ** *** *** *** Confidence 0 2 4 6l
0 1.0 2.0 3.0 *** ns Decision time (s) FamiliarCor Incor Cor Incor
Novel Figure 1 The recognition memory task and behavioral results. (a) Task. (b) Performance as a function of proportion of trials
correctly and incorrectly identified. Each point is one session (n = 44), black is the mean performance ± s.d. (c) Behavioral ROC curve for individual sessions (gray) and average (red). Each data point is a different confidence. (d) AUC values of all
sessions. (e) z-transform of the average ROC shown in c. The slope of the red line (least-square fit) is the metric used in the
text. (f) Probability of responses, conditional on the ground truth (red or blue). At all levels of confidence, subjects were more
likely to be correct than incorrect (straight and dashed lines, respectively). (g) Choice accuracy as a function of confidence,
shown separately for new and old responses. (h) Accuracy was significantly different between high- and low-confidence trials
(P < 10−10, paired t test). Each color is a different session, with average ± s.d. on the left and right. (i) Decision time was
significantly larger (slower) for low- compared with high-confidence trials (correct trials only; paired Wilcoxon signed rank test, P < 10−5 for both novel and familiar stimuli) and significantly larger for novel compared with familiar stimuli for both
low and high confidences (P = 0.01 and P < 10−4, respectively). (j) Decision time was significantly slower for low- compared
with high-confidence incorrect trials (paired Wilcoxon singed rank test, P < 10−6). (k) Errors were made with less confidence than correct trials
(P < 10−8, paired Wilcoxon signed rank test). (l) Correct familiar decisions were made faster than incorrect decisions (paired comparison matched for
confidence, Online Methods). (i–k) Boxplots represent quartiles (25%, 75%), line is median, whiskers show range up to 1.5 times the interquartile
range, and dots above whiskers show outliers. *P ≤ 0.05, **P ≤ 0.01, ***P ≤ 0.001. P values are uncorrected for multiple comparisons. ns indicates non-significant (P = 0.60). Error bars in f, g and l represent ± s.e.m. across subjects.
npg
© 201
5 Nature
America, Inc.
(Fig. 1h) and that the relationships between DT and confidence were as expected for declarative memory retrieval decisions1.
We selected subsets of sessions for analysis on the basis of behav-ioral metrics alone. Two groups were selected: group 1 (patients with above chance retrieval performance, n = 38 sessions, AUC = 0.81 ± 0.10, g = 0.39 ± 0.29) and group 2 (patients who were able to distinguish between high-and low-confidence memories, 26 sessions, AUC = 0.84 ± 0.08, g = 0.38 ± 0.27).
Electrophysiology
We isolated 1,065 putative single units from the amygdala and hippoc-ampus in 44 sessions (on average 24 per session). Units were carefully isolated17,20 and recording and spike sorting quality were assessed quantitatively (Supplementary Fig. 1). The average firing rate was 1.84 ± 2.66 Hz (Supplementary Table 2). Throughout the manuscript, we use the term neuron to refer to a putative single unit. Neurons were sensitive to the onset of visual stimuli as expected9,17: 30% (321/1,065) of the neurons responded when comparing baseline with post-stimulus periods (P < 0.05, two-tailed t test, 1 s each). Note that the analysis that follows was not restricted to visually responsive neurons. Single-neuron signatures of memory
We first tested whether the neuronal response following stimulus onset depended on whether the stimulus was novel (not seen before) or familiar (seen before) stimuli. We found that the response of 8.5% (81 of 954, P < 10−5, Bernoulli; correct trials only in Group 1, n = 38 ses-sions, Supplementary Table 2 and Supplementary Fig. 2) of all neu-rons differed between novel and familiar stimuli. This was true for both amygdala (43/577, 7.5%) and hippocampal (38/377, 10.1%) neurons.
We refer to these neurons as being MS13. Similar to previous experi-ments13,14,21, we identified two types of MS neurons (Fig. 2). The first had a higher firing rate to novel than to familiar stimuli (45 of 81 neurons; Fig. 2a,b), whereas the second type had an increased fir-ing rate for familiar than novel stimuli (36 of 81 neurons; Fig. 2c,d). We refer to these neurons as novelty- and familiarity-selective (NS and FS) neurons, respectively13.
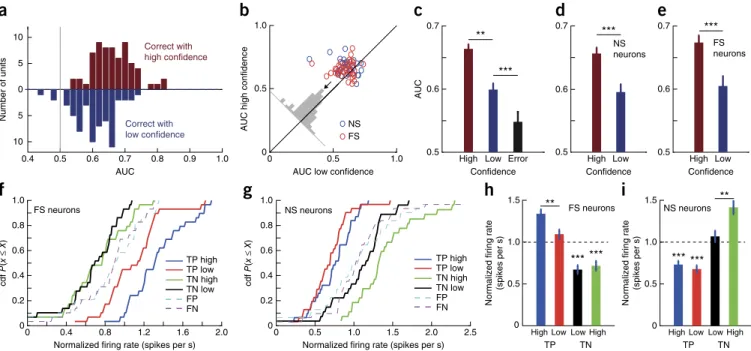
We next performed a single-neuron ROC analysis for every MS neuron and calculated its AUC. The AUC specifies the probability by which an ideal observer could predict the choice (novel or famil-iar) of a subject by counting spikes in an individual trial. Note that some studies refer to this metric as choice probability22. Only MS neurons from patients that were able to differentiate high from low confidences were considered (group 2, 65 of 664 units (9.8%) were MS units; Fig. 2e–h and Supplementary Fig. 4). The average AUC for all MS neurons, considering all correct trials, was 0.64 ± 0.04 (different from chance by design, as the neurons were selected to be different in the first place; what is important here is only the magnitude). We next computed AUC values using only high- or low-confidence trials. Note that the selection of MS neurons does not consider confidence, making this comparison independent. AUC values were significantly larger for high- than for low-confidence trials for all MS neurons together (0.66 ± 0.007 versus 0.60 ± 0.010; Fig. 3a–c) and for NS and FS neurons separately (Fig. 3d,e). This was true for both hippocampal and amy-gdala neurons (Supplementary Table 2), for neurons recorded from the left and right hemisphere alone, and when evaluating the differences using a bootstrap rather than parametric statistics (Supplementary Fig. 3). These differences could not be attributed to different units that might have been merged into one single cluster: the mean
10 20 30 40 50 60 70
Trial number (re-sorted)
0 1,000 2,000 1 2 3 Time (ms) 0 1,000 2,000 Time (ms) 0 1,000 2,000 Time (ms) 1,000 2,000 0.5 1.0 1.5 0 100 200 Time (ms) 0 40 80 0 20 40 60 0 20 40 60 80
Firing rate (spikes per s)
Time (ms) 0 TP++ TP+ TN+ TN++
d
c
b
a
Familiar (TP++ and TP+) Novel (TN++ and TN+)i
j
k
l
Amplitude ( µV) Amplitude ( µV) Amplitude ( µV) Amplitude ( µV) 0 1 2 3 TP ++ TP + TN + TN ++ 0 0.5 1.0 0 0.5 1.0g
High (++) Low (+)Probability of false alarm Behavior 0 1 2 TP ++ TP + TN + TN ++ 0 0.5 1.0 0 0.5 1.0
f
High (++) Low (+)Probability of false alarm Behavior TP ++ TP + TN + TN ++ 0 1 2
Firing rate (spikes per s)
Behavior 0 0.5 1.0 0 0.5 1.0 Probability of correct detection
e
High (++) Low (+)Probability of false alarm
0 1 2 3 TP ++ TP + TN + TN ++ 0 0.5 1.0 0 0.5 1.0
Probability of false alarm
h
High (++) Low (+)
Behavior
Figure 2 MS neurons. (a–d) Raster (top) and post-stimulus time histogram (PSTH) (bottom) of four example neurons, NS (a,b) and FS (c,d). Stimulus
onset was at 1,000 ms (gray). Trials were re-sorted by behavior for display purposes: familiar high confidence (TP++), familiar low confidence (TP+), novel low confidence (TN+) and novel high confidence (TN++). Error trials are not shown. In the PSTH, trials were grouped according to TP and TN. (e–h) Single-neuron ROC curves (left) and mean rate (right) for the neurons shown in a–d. Bar plots show the mean rate in a 1.5-s window starting
200 ms after stimulus onset. Error bars are ± s.e.m. across trials. (i–l) Waveforms of spikes associated with the four different trial types for each neuron, in same order as in a–d. Top, mean waveforms superimposed. Bottom, all individual waveforms associated with the spikes shown in a–d.
Color code is identical to that used in a–d.
npg
© 201
5 Nature
America, Inc.
waveforms associated with each of the four trial types were indis-tinguishable (Fig. 2i–l). Comparing forgotten (false negative, FN) trials with truly novel trials revealed an AUC larger than chance (0.55 ± 0.020, P = 0.0048 versus chance of 0.50; Fig. 3c), but significantly smaller than that for low-confidence correct decisions (0.60 ± 0.010,
P = 0.0056). This indicates that MS neurons carry a memory signal
that is strongest for high-confidence correct trials, intermediate for low-confidence trials and weakest for FN trials (Fig. 3c).
We performed a number of controls to exclude possible confounds. Using MS neurons from non-epileptic areas revealed a similar differ-ence (n = 40, AUC = 0.66 ± 0.01 versus 0.61 ± 0.01, P = 0.00066), as did using only neurons in epileptic tissue (later resected, AUC = 0.67 ± 0.01 versus 0.61 ± 0.02, P = 0.0041). Equalizing the number of tri-als in the high- and low-confidence groups did not change the result (AUC = 0.67 ± 0.01 versus 0.60 ± 0.02, P < 4 × 10⁻⁵). Finally, randomly re-assigning confidences and keeping the novel and familiar labels intact abolished the high and low difference as expected (AUC = 0.65 ± 0.01 versus 0.65 ± 0.01, P = 0.81; Supplementary Fig. 3m–o).
We next compared the response patterns of FS and NS neurons. The previous ROC analysis was not sensitive to whether one or both terms constituting the difference are modulated. We therefore directly compared the normalized number of spikes fired by FS and NS neurons as a function of behavior. By design, FS and NS neurons responded maximally to familiar and novel stimuli, respectively (Fig. 3f,g). The response of FS and NS neurons significantly differed (FS neurons,
P = 0.0094 and P = 0.74; NS neurons, P = 0.22 and P = 0.03; P values are
for TP and TN trials, respectively) between high- and low-confidence
trials, but only for the trial types to which the neurons increased their firing rate. Thus, the response of FS neurons differed between high- and low-confidence trials only for familiar stimuli and vice-versa for NS neurons (Fig. 3f,g). In addition, both FS and NS neurons decreased their firing rate to novel and familiar stimuli, respectively (Fig. 3h,i). The magnitude of this decrease, however, was insensitive to confi-dence. Thus, NS and FS neurons signal confidence asymmetrically because only the trial type to which they increase their firing rate relative to baseline is modulated by confidence. This conclusion relies on an absence of firing rate reduction below baseline, which is difficult to detect as a result of low baseline firing rates. However, note that this very problem would be faced by an imaginary downstream neuron receiving input from FS and NS neurons.
Single-neuron signatures of visual information
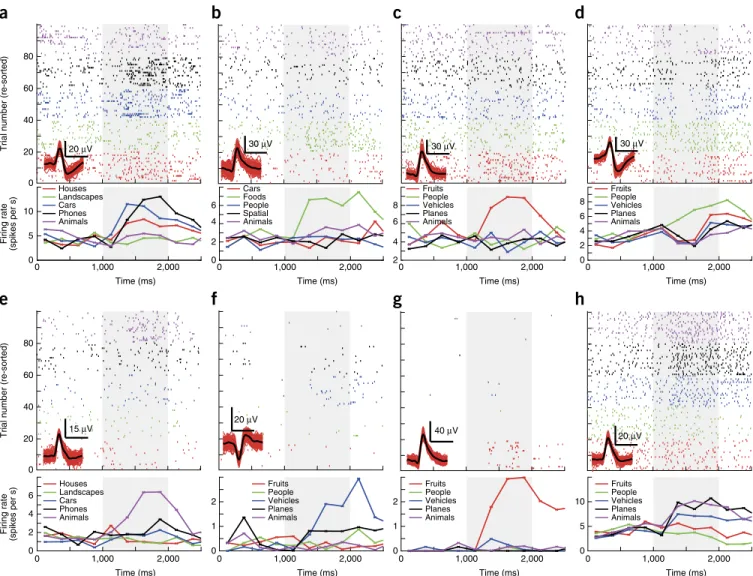
Each image that we showed to the subjects belonged to one of five investigator-defined visual categories (cars, foods, people, land-scapes and animals). The response of 17.5% (186 of 1,065) of units was significantly modulated by category (one-way ANOVA, P < 0.05; Fig. 4), a proportion similar to what has been reported previously9 (Supplementary Table 2 and Supplementary Fig. 2). We refer to this group as VS neurons.
The two populations were independent: 15 of 186 VS neurons were also MS neurons (8%) and 15 of 87 (17%) of MS neurons were also VS neurons (χ2 test of independence, P = 0.91; this also applies when con-sidering only neurons from groups 1 and 2 and when excluding neurons with firing rates <1 Hz). A small group of neurons (15 of 1,065, 1.5%)
0.4 0.5 0.6 0.7 0.8 0.9 1.0 10 5 0 5 10 AUC Number of units
a
Correct with high confidence Correct with low confidenceNormalized firing rate (spikes per s)
0 0.4 0.8 1.2 1.6 2.0 0 0.2 0.4 0.6 0.8 1.0 TP high TP low TN high TN low FP FN
f
cdf P (x ≤ X ) cdf P (x ≤ X ) FS neuronsNormalized firing rate (spikes per s)
0 0.5 1.0 1.5 2.0 2.5 NS neurons
g
0 0.2 0.4 0.6 0.8 1.0 TP high TP low TN high TN low FP FN 0 0.5 1.0 1.5 *** *** ** High Low TP TN High Low NS neurons 0 0.5 1.0 1.5 *** *** ** High Low TP TN High Low FS neurons AUC low confidenceAUC high confidence
0 0.5 1.0 0 0.5 1.0 NS FS
b
High Low Error 0.5 0.6 0.7 Confidence
c
AUC ** *** Confidenced
High Low 0.5 0.6 0.7 NS neurons *** Confidencee
High Low 0.5 0.6 0.7 FS neurons ***Normalized firing rate
(spikes per s)
i
Normalized firing rate
(spikes per s)
h
Figure 3 The response of MS neurons is modulated by subjective confidence. (a–e) Single-neuron ROC analysis. (a) AUC of MS neurons for high (red)
and low (blue) confidence (n = 65 units; the two distributions were significantly different, P = 0.001). (b) Pairwise comparison of AUC values. For 49 of 65 units, the AUC was high > low (P < 10−4, sign test). The average difference was above the diagonal (inset). (c) Average AUC for high- and low-confidence
correct and error trials (FN; FN versus low, P = 0.0056; high versus low, P < 10−5, pairwise t test). (d,e) AUC for high-confidence trials was significantly
larger for both NS (n = 29) and FS (n = 36) neurons (P = 0.0001 and P = 0.0003, respectively). (f–i) Comparison of firing rate using baseline normalized responses and grouped by behavior. (f) Activity of FS neurons differentiated high- from low-confidence familiar trials (n = 29, TP high versus TP low,
P = 0.0094, Kolmogorov-Smirnov test), but not novel trials (n = 30, TN high versus TN low, P = 0.74, Kolmogorov-Smirnov test). (g) Activity of
NS neurons differentiated high- from low-confidence novel trials (TN high versus TN low, P = 0.03, Kolmogorov-Smirnov test), but not high from low familiar trials (TP high versus TP low, P = 0.22, Kolmogorov-Smirnov test). The cumulative distributions function (cdf) is shown in f and g. (h,i) Mean normalized response across neurons. (h) FS neurons had significantly higher firing rate for TP high compared with TP low trials (paired t test, P = 0.0014).
(i) NS neurons had significantly higher firing rate for TN high compared with TN low trials (paired t test, P = 0.0002). *** indicates significant
difference from baseline (P < 10−4). True positive (TP) and negatives (TN) are correctly remembered familiar and novel stimuli. False positives (FP) and
false negatives (FN) are wrongly identified novel and familiar stimuli. Errors are ± s.e.m. across neurons. **P ≤ 0.01, ***P ≤ 0.001.
npg
© 201
5 Nature
America, Inc.
were both MS and VS cells (Supplementary Fig. 4), a proportion larger than would be expected by chance (chance level 0.25%, P = 0.001; Supplementary Fig. 2) and compatible with independence of memory and visual selectivity. We analyzed VS and MS neurons without excluding those that code for both.
Did the response of VS neurons depend on memory strength? To answer this question, we first identified the most and least preferred stimulus category for each VS neuron (for example, the neuron shown in Fig. 4e best differentiates between animals and houses). We then used single-neuron ROC analysis to quantify how well the response of each VS neuron discriminated between these two categories for four different trial types: novel, familiar, and high and low confi-dence. Using only correct trials from neurons in group 2 (128 of 664 were VS neurons; Supplementary Table 2) we found that AUC val-ues did not differ as a function of confidence or familiarity (Fig. 5). The same conclusions held when excluding low-firing rate neurons (Supplementary Fig. 5). This indicates that the ability of a VS cell to identify its preferred category does not depend significantly on stimu-lus familiarity or confidence. This concstimu-lusion relies on the absence of
a significant difference, which does not exclude the possibility that our data does not have enough statistical power to detect an existing difference. However, note that, using the same number of trials and time window, MS neurons showed a strong difference. In addition, the pairwise comparison between the two conditions (high and low, new and old) is based on trials for which the neuron carried information to begin with (the preferred category), assuring that the individual AUC values were well above chance.
VS neurons discriminate before MS neurons
We next estimated the first point of time at which the response of VS and MS neurons differed between different visual categories and novel and familiar stimuli, respectively. We compared the cumu-lative sum of the spike trains, a method that provides an estimate of the differential latency of a neuron with millisecond precision15 (Online Methods). The average differential latencies of VS and MS neurons were 272 and 461 ms, respectively (relative to stimulus onset; Fig. 6a,b). Thus the response of MS neurons was delayed by 189 ms relative to VS neurons. 20 40 60 80
a
b
c
d
e
f
g
h
Trial number (re-sorted)
20 40 60 80
Trial number (re-sorted)
0 1,000 2,000 0 2 4 6 Time (ms) Firing rate (spikes per s) 0 1,000 2,000 0 1 2 Time (ms) 0 1,000 2,000 0 1 2 Time (ms) 0 1,000 2,000 0 5 10 Time (ms) 15 µV 20 µV 30 µV 30 µV 30 µV 20 µV 40 µV 20 µV 0 1,000 2,000 0 5 10 Time (ms) Firing rate (spikes per s) 0 1,000 2,000 0 2 4 6 Time (ms) 0 1,000 2,000 4 6 8 Time (ms) 0 1,000 2,000 0 2 4 6 8 Time (ms) 2 0 0 Houses Landscapes Cars Phones Animals Cars Foods People Spatial Animals Houses Landscapes Cars Phones Animals Fruits People Vehicles Planes Animals Fruits People Vehicles Planes Animals Fruits People Vehicles Planes Animals Fruits People Vehicles Planes Animals Fruits People Vehicles Planes Animals
Figure 4 VS neurons. (a–h) For each, the raster (top) and PSTH (bottom) is shown. Trials are re-sorted for illustration purposes. Visual identity (category)
is indicated by color, and the legends show the corresponding label (variable). The inset (bottom left of raster) shows waveforms associated with the indicated neuron (in red are 100 randomly chosen individual waveforms; in black, mean waveform; horizontal scale bar represents 1 ms). a,b,d,f and c,e,g,h are from the hippocampus and amygdala, respectively. All units are from different sessions. Some units responded with a firing increase only to
one category (b,c,e–g), whereas others showed a mixed response (a,d,h). Stimulus onset was at 1,000 ms (gray). Significance of selection criteria
(1 × 5 ANOVA) was 7 × 10⁻⁵ (a), 10−6 (b), 0.004 (c), 0.003 (d), 5 × 10⁻⁹ (e), 0.0004 (f), 3 × 10⁻¹² (g) and 4 × 10⁻⁹ (h). PSTH bin size was 250 ms.
npg
© 201
5 Nature
America, Inc.
Differential coding of visual category and memory
We next considered all recorded neurons together (n = 664, group 2). We fit a moving-window regression model for every single unit (using correct trials only) to estimate how much of the neuronal variabil-ity could be attributed to the factors visual category and familiarvariabil-ity (Fig. 6). We estimated the effect sizes23 by ω2 as a function of time (Online Methods). The population conveyed information about both the visual categories and the familiarity of the stimuli (Fig. 6c). VS neu-rons signaled information earlier and did not provide novelty infor-mation (Fig. 6g). In contrast, MS neurons signaled inforinfor-mation about
the novelty of the stimulus, but not its categorical identity (Fig. 6f). To analyze neuronal activity regardless of time, we averaged the effect size in a 1.5-s time window starting 0.2 s after stimulus onset. Units classified as MS and VS neurons tended to have high effect sizes only for novelty and familiarity or category, respectively (Fig. 6h–k). The effect sizes were not correlated, indicating that a neuron coded either familiarity and novelty or category, but not both (Fig. 6d,e). This was true for MS, VS and all other neurons (r = 0.04, −0.003 and −0.008, respectively; P > 0.86; Fig. 6e). Thus, a neuron was informative about one, but not both, of the variables. We also used a regression model
a
Low confidence High confidence Number of units 0 0.2 0.4 0.6 0.8 1.0 30 20 10 0 10 20 AUC 0 0.2 0.4 0.6 0.8 1.0 0 0.2 0.4 0.6 0.8 1.0 AUC familiar AUC noveld
b
Familiar Novel Number of units 30 20 10 0 10 20 0 0.2 0.4 0.6 0.8 1.0 AUCc
0 0.2 0.4 0.6 0.8 1.0 AUC low confidenceAUC high confidence
0 0.2 0.4 0.6 0.8 1.0
Figure 5 The ability of VS neurons to differentiate visual stimuli is not influenced by confidence judgment or novelty of the stimulus. (a) AUC of VS
neurons for low- and high-confidence trials (P = 0.31, bootstrap test). (b) AUC of VS neurons for novel and familiar trials (P = 0.54, bootstrap test). (c) Pairwise comparison of AUC values as a function of confidence (P = 0.53, pairwise sign test). (d) Pairwise comparison of AUC values as a function
of familiarity (P = 0.41, pairwise sign test). In c and d, every data point is one VS neuron (n = 128 in total). All pairwise comparisons showed no significant difference. Only correct trials were considered throughout.
−0.01 0 0.01 0.02 0.03 Time (ms) VS neurons Effect size � 2
g
500 1,000 1,500 2,000 2,500b
e
0 100 0 4 −0.001 0 0.0010 10 MS × VS �2 Number of unit s 500 1,000 1,500 2,000 2,500 −0.01 0 0.01 0.02 0.03 0.04 Time (ms) MS neuronsf
Effect size � 2a
500 1,000 1,500 2,000 0 1 2 3 4 5 6 Time (ms) Cumulative firing rate (Hz) 461 ms 272 ms 0 0.05 Significance (P ) VS neurons (preferred) VS neurons (non-preferred) MS neurons (preferred) MS neurons (non-preferred) 0.050 VS MSc
d
Difference in cumulativ e firing rate (Hz ) 0 0.4 0.8 1.2 MS neurons (difference) 1.6 500 1,000 1,500 2,000 Time (ms) VS neurons (difference) Category –0.004 −0.002 0 0.002 0.004 0.006 Time (ms) All neurons Effect size � 2 500 1,000 1,500 2,000 2,500 Novel versus familiar0 0.02 0.04 0.06 0 0.02 0.04 0.06 VS MS
Mean effect size of
novel versus familiar
�
2
Mean effect size category �2 Other
Nov/fam High onlyNov/famLow only
i
0 0.01 0.02 0.03 Categoryh
Mean effect size
�
2
Novel versusfamiliar Category High only Novel versus familiar
0 0.005 0.010 0.015
Category Category Low only
Mean effect size
�
2
j
k
Figure 6 MS and VS neurons signal at different times and only MS neurons are sensitive to confidence. (a,b) Cumulative firing rate for MS and VS
neurons. Pairwise comparison (a, bottom; cluster-corrected P values) between the preferred and non-preferred stimulus revealed differences in time
course. (b) Pairwise difference for both populations. (c–k) Effect size estimation for populations of neurons based on a regression model. ω2 is used
to estimate effect size. (c) Time course of effect size, averaged across all neurons (N = 664) and computed separately for the variable category (blue)
and novel and familiar (yellow). Dashed horizontal lines indicate the 99% confidence intervals of the null distribution. Dashed vertical lines indicate first time point significantly above the 99% confidence interval. Stimulus onset was at 1,000 ms (gray line). (d) Average effect size (1.5-s window
starting 200 ms after stimulus onset) of category and novel versus familiar regressors for each neuron. (e) Product of ω2 for regressors novel and familiar
and category for MS, VS and other neurons. There was no significant correlation (P > 0.86 for all, t test versus 0). (f) Data presented as in c, but for MS neurons only. MS neurons did not distinguish categories. (g) Data are presented as in c, but for VS neurons only. VS neurons did not distinguish
novel from familiar stimuli. Grayscale horizontal line in f and g indicates proportion of significant units (from white to black) at every point of time,
based on the 99% confidence interval. (h) MS neurons had significantly larger effect size for regressor novel and familiar compared with category
(P = 0). (i) Effect size of MS neurons was significantly modulated by confidence (P = 0.0049). (j,k) Average effect size for VS neurons was significantly larger for category information (P = 0.0049, j) and was not sensitive to confidence (P = 0.81, k). All P values are paired t tests. Bin size was 500 ms, step size was 50 ms, error bars and shaded regions represent ±s.e.m. across neurons.
npg
© 201
5 Nature
America, Inc.
with an interaction term, which did not explain any additional variance (Supplementary Fig. 6). Comparing the effect size between trials that were recognized with high and low confidence revealed that the information conveyed by MS neurons (Fig. 6h,i) was sensitive to subjective confidence, whereas that conveyed by VS neurons was not (Fig. 6j,k). Note that the estimated effect size of a neuron did not depend on spike sorting quality (Supplementary Fig. 1h,i). Estimate of information content
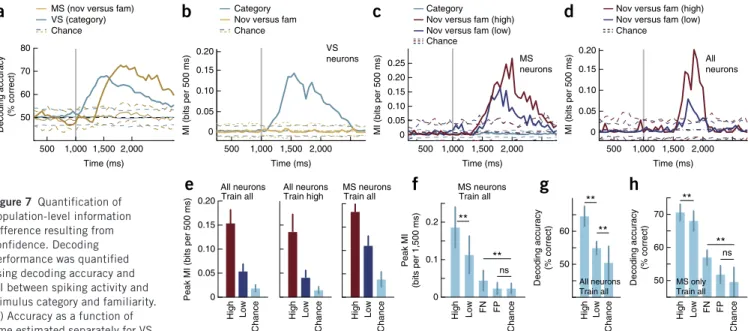
What distinguishes a high- from a low-confidence memory? We used a population decoder to estimate the amount of information provided in single trials as a function of confidence and accuracy. The decoder had access to a pseudo-population of neurons and was trained and tested on subsets of independent trials. The resulting estimates are generalization errors, permitting comparisons such as whether training the decoder with a condition (that is, high confidence) generalizes to other conditions (that is, low confidence). Applying this method to all recorded VS and MS neurons revealed that visual information carried by VS neurons could be decoded earlier than memory information carried by MS neurons (Fig. 7a). This extends the earlier finding to single-trial decoding. To quantify the informa-tion available we used the mutual informainforma-tion (MI) between the spik-ing response and stimulus identity and familiarity (Online Methods). This again revealed an early and late component that was carried by VS and MS neurons (Fig. 7b,c). We next trained a decoder that had access to all recorded neurons using only high-confidence trials and tested its performance on both high- and low-confidence trials (Fig. 7c,d). Although this decoder based its decisions on neurons signaling high-confidence memories, low-confidence trials could still be decoded, albeit the amount of information available was reduced by
~70% (0.14 ± 0.04 versus 0.04 ± 0.02 bits; Fig. 7e). Thus, the popula-tion response identified for high-confidence trials is still informative for low-confidence memories. Training a decoder on all trials regardless of confidence and testing it on high and low confidence trials separately revealed similar results (0.15 ± 0.03 versus 0.05 ± 0.02 bits; Fig. 7e). This result also holds when only considering MS neurons (Fig. 7e). We conclude that the amount of information available in the entire population, in bits, is approximately threefold higher for high- than for low-confidence memories. We next estimated the MI during error trials. This revealed that, when a stimulus was forgot-ten (false negative, FN), the spiking activity of MS neurons still con-tained information about the familiarity of the stimulus (Fig. 7f). Although more than expected by chance (0.044 versus 0.023 bits, 1.97-fold more information), this was less than that available for low- confidence correct trials (Fig. 7e). Forgotten trials thus form a con-tinuum with the low- and high-confidence correct trials, a property that is expected of a memory strength signal. Note that, in contrast with MI, decoding accuracy cannot be used to compare amounts of information. Nevertheless, a similar qualitative pattern of readout ability was revealed by decoding accuracy (Fig. 7g,h).
Differences in electrophysiological signatures
We next compared the shape of the extracellular waveforms (EWs) associated with each neuron to investigate whether VS and MS cells might be physiologically different. The trough-to-peak time d (Supplementary Fig. 7a) was bimodally distributed across all recorded neurons (Supplementary Fig. 7a,b), indicating at least two types of EWs: short and long (mode 0.3 ms and 0.8 ms; Supplementary Fig. 7b,c). Considering d separately for particularly well-isolated MS and VS neurons (projection test distance > 10 s.d.; all conclusions
MI (bits per 500 ms) All neurons 0 0.05 0.10 0.15 0.20
Nov versus fam (high) Nov versus fam (low) Chance 1,000 2,000 Time (ms) 500 1,500
d
MI (bits per 500 ms) MS neurons 0 0.05 0.10 0.15 0.20 0.25 CategoryNov versus fam (high) Nov versus fam (low) Chance Time (ms) 500 1,000 1,500 2,000
c
0 0.05 MI (bits per 500 ms) 0.10 0.15 0.20 Category Nov versus famVS neurons Chance 1,000 2,000 Time (ms) 500 1,500
b
Decoding accuracy (% correct) 50 60 70 80 VS (category) MS (nov versus fam) Chance Time (ms) 1,000 2,000 500 1,500a
MS neurons Train allPeak MI (bits per 500 ms)
High Low Chance 0 0.05 0.10 0.15 0.20 All neurons Train all
e
All neurons Train high High Low Chance High Low Chancef
High Low FN Chance FP 0 0.1 0.2 Peak MI (bits per 1,500 ms) MS neurons Train all ns 50 60 Decoding accuracy (% correct) All neurons Train all 50 60 70 Decoding accuracy (% correct) MS only Train all High Low Chance High Low FN Chance FPg
h
** ** ** ** ** ** ns Figure 7 Quantification of population-level information difference resulting from confidence. Decoding performance was quantified using decoding accuracy and MI between spiking activity and stimulus category and familiarity. (a) Accuracy as a function oftime estimated separately for VS
and MS neurons while decoding visual category and familiarity, respectively. (b,c) VS neurons (n = 128) and MS (n = 59) neurons only signaled
category and familiarity information, respectively. (c) Spiking of MS neurons contained more information about familiarity for high-confidence trials.
(d) Spiking activity of all recorded neurons (n = 606) together contained more information for high-confidence trials. (e) Statistical comparison of MI
for high- and low-confidence trials. A subset of n = 200 (all) and n = 20 (MS) units was chosen at random from the entire population (bootstrap, 50 runs) and the peak MI was estimated for each run. More information was available for all neurons (left) as well as for MS neurons only (right), regardless of whether the decoder was trained with all (left) or only high-confidence (middle) trials (high versus low and low versus chance is P < 0.001 for all). (f) Decoding of error trials using a subset of n = 30 MS neurons chosen at random from the population. Decoder was trained on all correct trials
and separately evaluated on high and low confidence as well as forgotten (FN) and false positive (FP) trials. Performance for FN was above chance (P = 0.003), but FP was not (P = 0.98). FN performance was significantly lower than low confidence (P < 10−5). (g,h) Quantification of overall readout
ability (1.5-s window), regardless of time, for all neurons (g) and MS neurons only (h; ns, P = 0.06). (e–h) Error bars represent ±s.d. across bootstrap runs. Dashed lines in a–d show the mean ± 99% confidence interval of the null distribution. **P < 0.01, ns indicates not significant (P > 0.05).
npg
© 201
5 Nature
America, Inc.
performance. The model’s ability to distinguish between novel and familiar stimuli was better for high- than for low-confidence trials (Fig. 8h). In addition, ∆E was correlated trial by trial with confidence, both for behaviorally correct and incorrect trials (Spearman correla-tion; correct, 0.042 ± 0.13, P < 10−20, n = 957 pairs; incorrect trials 0.047 ± 0.17, P = 0.0033 versus 0, n = 130 pairs). Of the two EV values, only the larger value (the winner) correlated with confidence (0.05 ± 0.13, P < 10−30), whereas the EV value of the smaller (looser) value did not (0.002 ± 0.16, P = 0.68). We also used the model to evalu-ate the decision levalu-atency by setting for each cell pair, a fixed decision threshold ∆ETh (Online Methods). The first time when ∆E exceeded this threshold, the race was aborted and the latency noted. This model made decisions more quickly for trials that were made with high confidence (Fig. 8i) and made familiar decisions more quickly than novel decisions (Fig. 8j). This pattern is similar to that observed behaviorally (Fig. 1i). Together, our findings show that a simple read-out mechanism can reliably, and on single trials, make two decisions simultaneously using only information provided by MS neurons. DISCUSSION
We systematically compared two populations of neurons in the human MTL: VS and MS neurons. The former signaled information about the identity of the visual stimuli, whereas the latter signaled the familiarity of the stimuli. VS neurons discriminated between stimuli ~190 ms earlier than MS neurons and only the activity of MS neurons was correlated with memory strength, as expressed by a confidence judg-ment. Together, our results suggest that only MS neurons are directly involved in memory retrieval. The proportion of MS neurons identi-fied here was similar to those identiidenti-fied previously13,14,26. However, using confidence ratings revealed several important new aspects of remain valid without this criteria) revealed that only the EWs of
VS neurons were significant bimodally distributed (Hartigan’s dip test, P = 0.004 for VS neurons and P = 0.34 for MS neurons; Supplementary Fig. 7d). In contrast, 72% of all EWs of MS neurons were short (Supplementary Fig. 7f). The proportion of long and short EWs was significantly different for MS, but not VS, neurons (χ2 comparison of proportions, P = 2.2 × 10⁻⁵ and P = 0.12 for MS and VS neurons, respectively; Supplementary Fig. 7f). At the same time, both VS and MS neurons had low firing rates and did not differ according to other spike train metrics (modified coefficient of variation (CV2) and burst index; Supplementary Tables 2 and 4). In conclusion, both MS and VS neurons had low firing rates, but MS neurons had mostly short EWs. Thus, we hypothesize that MS neurons are anatomically distinct from VS neurons.
Decision-making model
Is the information provided by MS neurons sufficient to decide both whether a stimulus is familiar as well as the confidence in that deci-sion? To answer this question, we constructed a biologically plausi-ble race model24. The model evaluates whether the difference D(t) between one FS and NS neuron is negative or positive (Fig. 8a). If positive, the accumulated evidence (EV) for the stimulus being famil-iar is increased and vice-versa for negative D(t). At the end of the trial, the decision is familiar if EVfam > EVnov, and novel if otherwise. The confidence in the decision is proportional to the ‘balance of evidence’ ∆E = |EVfam − EVnov| (ref. 25). We evaluated the performance of this model for all n = 954 pairs of NS and FS neurons, separately for correctly recognized familiar (TP) and novel (TN) items (Fig. 8b–h). The model reliably distinguished between high- and low-confidence trials (Fig. 8c–f) and EV and ∆E were correlated with behavioral
1,000 1,500 2,000 2,500 −10 −5 0 5 10
Balance of evidence ∆EV
Low confidence High confidence TN trials TP trials 1,000 1,500 2,000 2,500 10 20 ∆EV Time (ms) EV stim is familiar EV stim is novel 1,000 1,500 2,000 2,500 10 20 Time (ms) 0.5 0.6 0.7 Accuracy of model (% correct) ++ + ++ + −10 0 10 Trial types 1,000 1,500 2,000 2,500 0 20 40 Evidence (EV) Time (ms) Trial 1 Trial 2 Trial 3 EV for familiar EV for novel
b
c
d
0 0 EV stim is familiar EV stim is novel ∆EVEvidence (EV) Evidence (EV)
TN++ trials TN+ trials
a
NS FS Subtract Integrate + – + – Time (ms) ∫ EV familiar EV novele
Balance of evidence ∆EV
TP TN ** ** −10 0 10
Balance of evidence ∆EV
++ + ++ + Trial types TP TN ns ns
f
g
++ + ++ + Trial types TP TN ** **h
Rectify f(x) f(x) 0 400 800 Latency of decision (ms) 0 400 800 ++ + ++ + Trial types TP TNi
j
Latency of decision (ms) ** ** Trial types TP TN ** ∫Figure 8 Computational model to decide the familiarity and confidence of a stimulus. (a) Circuit diagram of a race model that integrates the difference
of the output of an NS and FS neuron. (b) Model output for three familiar (TP) trials for an example pair of neurons. Decision was made correctly for
trials 1 and 2, incorrectly for trial 3. (c,d) Model output for all (FS,NS) neuron pairs (n = 951) for novel (TN) trials for high (c) and low confidence (d),
respectively. Note how the balance of evidence, ∆E, was larger for high-confidence trials. Shading represents 99% confidence intervals across pairs of neurons. Marked time points are the centers of each bin (bin size = 250 ms). (e) ∆E as a function of time for all four trial types. Here, ∆E = EVfam − EVnov,
making ∆E negative for TN trials. (f) Average ∆E for the last time point in e for all neuron pairs (n = 951). ∆E was significantly larger for high- relative to low-confidence trials (pairwise t test, P < 10−6). (g) Control, random reassignment of confidences abolished the difference while keeping new and old
performance intact (P = 0.56 and 0.45, respectively). (h) Single-trial model performance for determining the familiarity of a stimulus. Performance was higher for high- compared with low-confidence trials (pairwise t test, P < 10−5). (i) Latency to reach a decision, as a function of confidence.
High-confidence trials had significantly shorter latency (P < 10−14 and P = 0.00022 for TN and TP, respectively; paired t test across all cell pairs).
(j) Familiar (TP) trials were faster than novel (TN) trials (P < 10−11, paired t test). All error bars represent ± s.e.m. across all neuron pairs.
**P < 0.01, ns indicates not significant.
npg
© 201
5 Nature
America, Inc.
these neurons. In particular, this revealed that NS and FS neurons coded information asymmetrically: their firing rate is only informa-tive about the confidence of the trial types to which they increase their firing rate (Fig. 3). In contrast, we found that the activity of the VS neurons was not sensitive to memory strength and that they were functionally distinct from MS neurons. In addition, our data is an independent reproduction of the initial description of VS neurons9. 1.5% of all neurons qualified as both VS and MS neurons. Although rare, our large data set shows that the probabilities of a neuron to become a VS or MS neuron are independent of each other. Such neu-rons have been hypothesized to represent a distributed sparse code for memories27,28, but, given their rarity, it will be necessary to use closed-loop procedures to investigate them systematically.
Our conclusions rest on single-neuron ROC analysis, a sensi-tive method for quantifying the amount of information available in individual trials29. ROC analysis does not assume a particular distri-bution of the spike counts, which is important because spike counts are Poisson distributed. Using mutual information, we further estimated that the amount of information present in the population is about threefold higher in high- relative to a low-confidence trials. Note that low-confidence decisions were nevertheless correct; what was missing was additional information required to reach a high- confidence choice. In addition, low-confidence decisions were slower, a signature of recognition memory that has been observed even when not asking for a confidence1.
Confidence judgments are subjective. Consequently, the strength associated with a certain confidence varies between subjects. Our analy-sis, however, is insensitive to this because it relies on a within-neuron comparison between high- and low-confidence trials. As a result, all that is required for our analysis to be valid is that subjects apply a threshold regardless of its value. For statistical reasons, we focused our analysis on two levels of confidence only. A third level is FN trials, which can be considered a ‘very low’ confidence. Our results indicate that these three levels are represented by MS neurons. Clearly, subjects are capable of using more than two confidence levels1 and it remains an open question whether each of these can be separated by MS neurons.
Could the neuronal differences between high and low confidence be attributed to fluctuations in attention during retrieval? The specificity of the neuronal effects argues against this possibility, as a global attentional effect would affect all neurons equally. In particu-lar, it would be expected to improve the reliability of visual category information30. Instead, we found no difference in the coding reli-ability of VS neurons.
In psychology, global models of recognition memory1,31,32 have as their underlying decision variable a familiarity or strength sig-nal that pools memory strength among many associations or items. In these models, the familiarity signal itself does not contain infor-mation about the memory apart from signaling its familiarity. MS neurons had the same property and are therefore candidates for the familiarity signal predicted by these models. This will make it possible to directly test key hypothesis made by these influential quantitative models of memory32.
We used a simple integrator-type model to explore which decisions could be supported by the difference in firing rate between a pair of FS and NS neurons. Integration of the difference of two neurons with opposite tuning is statistically optimal in many situations24. Our model differs from drift-diffusion (DDM) models24,33 because it has two integrators, only one of which increases its value depending on the sign of the difference. FS and NS neurons are not anti-correlated (Fig. 3f–i), and the two integrators are therefore not redundant, as is assumed in DDM models. The difference of the two integrators is
the ‘balance of evidence’5,7,25. In contrast, a standard DDM model has only one decision variable34 and therefore has no mechanism for estimating the quality of a decision beyond the time taken to reach the decision threshold3. We found that integration-to-bound decision models are applicable to memory-based decisions because this model can make confidence decisions based only on the activity of MS neurons. No human neurons that represent the difference FS-NS or the integrator values EV have yet been identified, but our model makes specific predictions that will facilitate their discovery. A key technique to identify signatures of evidence accumulation has been to present sensory stimuli of different strength22,35. We relied on internal variability in memory strength only, but we expect that combing these two approaches will be an important future avenue.
EWs have been used to classify cells as inhibitory or excitatory36–38, but no definitive data on the validity of this distinction exists for humans. The EW differs as a function of the location of the electrode relative to the cell, but, given that our electrodes were implanted blindly, this is unlikely to account for the difference. Large pyramidal cells can have shorter waveforms than smaller pyramids39, and in rats particularly short waveforms are hypothesized to represent axonal activity40. In addition, backpropagation of action potentials widens the EW41 and the propensity for backpropagation varies between cell types. Consequently, an intriguing possibility is that MS cells are morphologically and/or physiologically different from VS cells, but this hypothesis remains to be confirmed.
In addition to the hippocampus, we identified VS and MS cells in the amygdala, confirming previous reports of memory signals in the human amygdala13,14,26. Although the amygdala is not necessary for declarative memory, it is crucial for many aspects of learning42 and is sensitive to stimulus novelty43. Given this, it is not surprising that VS and MS cells are also present in the amygdala. We used natural scenes as stimuli, some with emotional content. It remains an open question whether MS cells in the amygdala are specifically modulated by the emotional content of the stimuli. It also remains an open question whether MS cells are modulated by recency rather than novelty. Lists of words are frequently used in recognition memory1 tests, but most physiological studies thus far have used natural scenes. Notably, a recent study using words reported cells tuned to recently seen words, but not broadly tuned cells of the kind we observed27.
Assessing the quality of one’s own memory (an internal state) is thought to require metacognition44, the existence of which in animals is debated5,45,46. Although only humans can verbally declare their confidence, experiments with indirect measures reveal that several species can utilize a ‘don’t know’ option3,7,47,48 alone or in combination with post-decision wagering3,49 to prevent the learning of an associa-tion instead of a confidence judgment. The amount of effort expended has also been used to infer confidence50. Theoretically, degrees of uncertainty are central components of neural computation5,6. Together, there is emerging evidence that an assessment of uncertainty is an integral part of neuronal decision making in general. Here, we found that MS neurons in humans support assessments of uncertainty in memory-based decisions because they carry a graded representa-tion of memory strength that is reflected in the subjective confidence ratings made by the subjects.
METhODS
Methods and any associated references are available in the online
version of the paper.
Note: Any Supplementary Information and Source Data files are available in the
online version of the paper.
npg
© 201
5 Nature
America, Inc.
AcknowledgmenTS
We thank J. Kaminski, R. Adolphs, C. Anastassiou, U. Maoz, J. Wertheimer and W. Einhaeuser for discussion, Z. Fu for spike sorting, C. Heller for performing some of the surgeries, the staff of the Epilepsy Monitoring Units at Huntington Memorial Hospital and Cedars-Sinai for invaluable assistance, particularly J. Schmidt. We thank K. Birch and H. Babu for assistance with patient care and surgery, and L. Philpott and M.-T. Le for neuropsychological testing. This work was supported by the Cedars-Sinai Medical Center Department of Neurosurgery (to U.R.), National Institute of Mental Health Conte Center at Caltech (P50 MH094258), and the Gustavus and Louise Pfeiffer Research Foundation (to U.R.).
AUTHoR conTRIBUTIonS
U.R. and A.N.M. designed the experiments. U.R. and O.T. performed experiments. U.R., M.K. and S.Y. performed analysis. A.N.M. and I.B.R. performed surgery. J.M.C. provided patient care. U.R. and A.N.M. wrote the paper. All of the authors discussed the results at all stages of the project.
comPeTIng FInAncIAl InTeReSTS
The authors declare no competing financial interests.
Reprints and permissions information is available online at http://www.nature.com/ reprints/index.html.
1. Kahana, M.J. Foundations of Human Memory (Oxford University Press, New York, 2012).
2. Petrusic, W.M. & Baranski, J.V. Judging confidence influences decision processing in comparative judgments. Psychon. Bull. Rev. 10, 177–183 (2003).
3. Kiani, R. & Shadlen, M.N. Representation of confidence associated with a decision by neurons in the parietal cortex. Science 324, 759–764 (2009).
4. Smith, J.D., Shields, W.E. & Washburn, D.A. The comparative psychology of uncertainty monitoring and metacognition. Behav. Brain Sci. 26, 317–339, discussion 340–373 (2003).
5. Kepecs, A. & Mainen, Z.F. A computational framework for the study of confidence in humans and animals. Philos. Trans. R. Soc. Lond. B Biol. Sci. 367, 1322–1337 (2012). 6. Pouget, A., Dayan, P. & Zemel, R.S. Inference and computation with population
codes. Annu. Rev. Neurosci. 26, 381–410 (2003).
7. Kepecs, A., Uchida, N., Zariwala, H.A. & Mainen, Z.F. Neural correlates, computation and behavioural impact of decision confidence. Nature 455, 227–231 (2008). 8. Squire, L.R., Stark, C.E. & Clark, R.E. The medial temporal lobe. Annu. Rev.
Neurosci. 27, 279–306 (2004).
9. Kreiman, G., Koch, C. & Fried, I. Category-specific visual responses of single neurons in the human medial temporal lobe. Nat. Neurosci. 3, 946–953 (2000). 10. Viskontas, I.V., Quiroga, R.Q. & Fried, I. Human medial temporal lobe neurons
respond preferentially to personally relevant images. Proc. Natl. Acad. Sci. USA
106, 21329–21334 (2009).
11. Logothetis, N.K. & Sheinberg, D.L. Visual object recognition. Annu. Rev. Neurosci.
19, 577–621 (1996).
12. Rolls, E.T. Functions of the primate temporal lobe cortical visual areas in invariant visual object and face recognition. Neuron 27, 205–218 (2000).
13. Rutishauser, U., Mamelak, A.N. & Schuman, E.M. Single-trial learning of novel stimuli by individual neurons of the human hippocampus-amygdala complex. Neuron
49, 805–813 (2006).
14. Rutishauser, U., Schuman, E.M. & Mamelak, A.N. Activity of human hippocampal and amygdala neurons during retrieval of declarative memories. Proc. Natl. Acad.
Sci. USA 105, 329–334 (2008).
15. Xiang, J.Z. & Brown, M.W. Differential neuronal encoding of novelty, familiarity and recency in regions of the anterior temporal lobe. Neuropharmacology 37, 657–676 (1998). 16. Wilson, F.A. & Rolls, E.T. The effects of stimulus novelty and familiarity on neuronal
activity in the amygdala of monkeys performing recognition memory tasks.
Exp. Brain Res. 93, 367–382 (1993).
17. Rutishauser, U., Ross, I.B., Mamelak, A.N. & Schuman, E.M. Human memory strength is predicted by theta-frequency phase-locking of single neurons.
Nature 464, 903–907 (2010).
18. Green, D. & Swets, J. Signal Detection Theory and Psychophysics (Wiley, 1966). 19. Manns, J.R., Hopkins, R.O., Reed, J.M., Kitchener, E.G. & Squire, L.R. Recognition
memory and the human hippocampus. Neuron 37, 171–180 (2003).
20. Rutishauser, U., Schuman, E.M. & Mamelak, A.N. Online detection and sorting of extracellularly recorded action potentials in human medial temporal lobe recordings,
in vivo. J. Neurosci. Methods 154, 204–224 (2006).
21. Viskontas, I.V., Knowlton, B.J., Steinmetz, P.N. & Fried, I. Differences in mnemonic processing by neurons in the human hippocampus and parahippocampal regions.
J. Cogn. Neurosci. 18, 1654–1662 (2006).
22. Britten, K.H., Newsome, W.T., Shadlen, M.N., Celebrini, S. & Movshon, J.A. A relationship between behavioral choice and the visual responses of neurons in macaque MT. Vis. Neurosci. 13, 87–100 (1996).
23. Hentschke, H. & Stuttgen, M.C. Computation of measures of effect size for neuroscience data sets. Eur. J. Neurosci. 34, 1887–1894 (2011).
24. Bogacz, R., Brown, E., Moehlis, J., Holmes, P. & Cohen, J.D. The physics of optimal decision making: a formal analysis of models of performance in two-alternative forced-choice tasks. Psychol. Rev. 113, 700–765 (2006).
25. Vickers, D. Decision Processes in Visual Perception (Academic Press, New York, 1979). 26. Fried, I., MacDonald, K.A. & Wilson, C.L. Single neuron activity in human
hippocampus and amygdala during recognition of faces and objects. Neuron 18, 753–765 (1997).
27. Wixted, J.T. et al. Sparse and distributed coding of episodic memory in neurons of the human hippocampus. Proc. Natl. Acad. Sci. USA 111, 9621–9626 (2014). 28. Marr, D. Simple memory: a theory for archicortex. Philos. Trans. R. Soc. Lond. B
Biol. Sci. 262, 23–81 (1971).
29. Macmillan, N.A. & Creelman, C.D. Detection Theory (Lawrence Associates, Mahwah, New Jersey, 2005).
30. Zhang, Y. et al. Object decoding with attention in inferior temporal cortex.
Proc. Natl. Acad. Sci. USA 108, 8850–8855 (2011).
31. Wixted, J.T. Dual-process theory and signal-detection theory of recognition memory.
Psychol. Rev. 114, 152–176 (2007).
32. Clark, S.E. & Gronlund, S.D. Global matching models of recognition memory: How the models match the data. Psychon. Bull. Rev. 3, 37–60 (1996).
33. Gold, J.I. & Shadlen, M.N. The neural basis of decision making. Annu. Rev.
Neurosci. 30, 535–574 (2007).
34. Ratcliff, R. A theory of memory retrieval. Psychol. Rev. 85, 59–108 (1978). 35. Hanks, T.D. et al. Distinct relationships of parietal and prefrontal cortices to
evidence accumulation. Nature 520, 220–223 (2015).
36. Viskontas, I.V., Ekstrom, A.D., Wilson, C.L. & Fried, I. Characterizing interneuron and pyramidal cells in the human medial temporal lobe in vivo using extracellular recordings. Hippocampus 17, 49–57 (2007).
37. Mitchell, J.F., Sundberg, K.A. & Reynolds, J.H. Differential attention-dependent response modulation across cell classes in macaque visual area V4. Neuron 55, 131–141 (2007).
38. Peyrache, A. et al. Spatiotemporal dynamics of neocortical excitation and inhibition during human sleep. Proc. Natl. Acad. Sci. USA 109, 1731–1736 (2012). 39. Vigneswaran, G., Kraskov, A. & Lemon, R.N. Large identified pyramidal cells in
macaque motor and premotor cortex exhibit “thin spikes”: implications for cell type classification. J. Neurosci. 31, 14235–14242 (2011).
40. Robbins, A.A., Fox, S.E., Holmes, G.L., Scott, R.C. & Barry, J.M. Short duration waveforms recorded extracellularly from freely moving rats are representative of axonal activity. Front. Neural Circ. 7, 181 (2013).
41. Stuart, G., Schiller, J. & Sakmann, B. Action potential initiation and propagation in rat neocortical pyramidal neurons. J. Physiol. (Lond.) 505, 617–632 (1997). 42. Hamann, S. The human amygdala and Memory. in The Human Amydala (eds.
Whalen, P.J. & Phelps, E.A.) 177–203 (The Guilford Press, New York, 2009). 43. Weierich, M.R., Wright, C.I., Negreira, A., Dickerson, B.C. & Barrett, L.F. Novelty
as a dimension in the affective brain. Neuroimage 49, 2871–2878 (2010). 44. Metcalfe, J. Metamemory. in Learning and Memory: a Comprehensive Reference
(ed. Roediger, H.L.) 349–362 (Elsevier, Oxford, 2008).
45. Metcalfe, J. Evolution of metacognition. in Handbook of Metamemory and Memory (eds. Dunlovsky, J. & Bjork, R.) 29–46 (Psychology Press, New York, 2008). 46. Hampton, R.R. Rhesus monkeys know when they remember. Proc. Natl. Acad. Sci.
USA 98, 5359–5362 (2001).
47. Perry, C.J. & Barron, A.B. Honey bees selectively avoid difficult choices. Proc. Natl.
Acad. Sci. USA 110, 19155–19159 (2013).
48. Foote, A.L. & Crystal, J.D. Metacognition in the rat. Curr. Biol. 17, 551–555 (2007).
49. Middlebrooks, P.G. & Sommer, M.A. Metacognition in monkeys during an oculomotor task. J. Exp. Psychol. Learn. Mem. Cogn. 37, 325–337 (2011).
50. Fortin, N.J., Wright, S.P. & Eichenbaum, H. Recollection-like memory retrieval in rats is dependent on the hippocampus. Nature 431, 188–191 (2004).
npg
© 201
5 Nature
America, Inc.