HAL Id: hal-01773713
https://hal.uca.fr/hal-01773713
Submitted on 19 Oct 2018
HAL is a multi-disciplinary open access
archive for the deposit and dissemination of
sci-entific research documents, whether they are
pub-lished or not. The documents may come from
teaching and research institutions in France or
abroad, or from public or private research centers.
L’archive ouverte pluridisciplinaire HAL, est
destinée au dépôt et à la diffusion de documents
scientifiques de niveau recherche, publiés ou non,
émanant des établissements d’enseignement et de
recherche français ou étrangers, des laboratoires
publics ou privés.
Effect of the fcc-hcp martensitic transition on the
equation of state of solid krypton up to 140 GPa
A. Rosa, G. Garbarino, R. Briggs, V. Svitlyk, Guillaume Morard, Mohamed
Ali Bouhifd, J. Jacobs, T. Irifune, O. Mathon, S. Pascarelli
To cite this version:
A. Rosa, G. Garbarino, R. Briggs, V. Svitlyk, Guillaume Morard, et al.. Effect of the fcc-hcp
marten-sitic transition on the equation of state of solid krypton up to 140 GPa. Physical Review B: Condensed
Matter and Materials Physics (1998-2015), American Physical Society, 2018, 97 (9),
�10.1103/Phys-RevB.97.094115�. �hal-01773713�
Effect
of the fcc-hcp martensitic transition
on
the equation of state of solid krypton up to 140 GPa
A. D. Rosa,1,* G. Garbarino,1 R. Briggs,1 V. Svitlyk,1 G. Morard,2 M. A. Bouhifd,3 J. Jacobs,1 T. Irifune,4 O. Mathon,1 and S. Pascarelli1
Solid krypton (Kr) undergoes a pressure-induced martensitic phase transition from a face-centered cubic (fcc) to a hexagonal close-packed (hcp) structure. These two phases coexist in a very wide pressure domain inducing important modifications of the bulk properties of the resulting mixed phase system. Here, we report a detailed in situ x-ray diffraction and absorption study of the influence of the fcc-hcp phase transition on the compression behavior of solid krypton in an extended pressure domain up to 140 GPa. The onset of the hcp-fcc transformation was observed in this study at around 2.7 GPa and the coexistence of these two phases up to 140 GPa, the maximum investigated pressure. The appearance of the hcp phase is also evidenced by the pressure-induced broadening and splitting of the first peak in the XANES spectra. We demonstrate that the transition is driven by a continuous nucleation and intergrowth of nanometric hcp stacking faults that evolve in the fcc phase. These hcp stacking faults are unaffected by high-temperature annealing, suggesting that plastic deformation is not at their origin. The apparent small Gibbs free-energy differences between the two structures that decrease upon compression may explain the nucleation of hcp stacking faults and the large coexistence domain of fcc and hcp krypton. We observe a clear anomaly in the equation of state of the fcc solid at ∼20 GPa when the proportion of the hcp form reaches ∼20%. We demonstrate that this anomaly is related to the difference in stiffness between the fcc and hcp phases and propose two distinct equation of states for the low and high-pressure regimes.
I. INTRODUCTION
Martensitic transformations are an important class of tem-perature or stress-induced solid-solid phase transitions of displacive nature with widespread applications. For example, they are at the origin of steel hardening by temperature quenching and responsible for shape memory effects in alloys such as Au-Cd and In-Tl [1]. Among the rare gas solids, a pressure-induced fcc to hcp martensitic transformation has been first experimentally reported in solid xenon [2]. This transformation is explained in earlier theoretical studies [3], which consider that the electronic s, p to d transition at the origin of the metallization of xenon also drives the gradual fcc to hcp conversion. In this process, the low-pressure fcc form of xenon transforms to an hcp phase by the progressive introduction of stacking disorder in the fcc lattice, which grows into hcp domains with increasing pressure. This transformation proceeds through a very large fcc-hcp coexistence pressure domain of ∼50 GPa in xenon [2,4]. This coexistence interval is drastically increased to 90 GPa in the presence of oxygen impurities [4] and marginally affected if xenon is temperature annealed [5]. In this latter case, the complete transformation to hcp xenon is reported at ∼65 GPa [5], attesting that the transformation is not kinetically hindered.
*angelika.rosa@esrf.fr
An fcc-hcp martensitic transition exhibiting a large coexis-tence field was also reported in solid krypton upon compression and decompression [5]. Similar to xenon, this large fcc-hcp pressure field of coexistence is explained by the small energy difference between the hcp and the fcc structures [6], which both have a packing factor of 74% and a coordination number of 12. The two structures only differ by the stacking sequence of their crystal lattices. However, this minor structural dif-ference could induce distinct mechanical behavior. Indeed, it is expected that the difference in stiffness between the fcc and hcp phases should affect their equation of state in the coexistence domain. However, no detailed studies have been devoted to this subject. Most of the experimental works were focused on the confirmation of the martensitic nature of the transformation and the determination of the equation of state (EoS) of individual solid krypton phases without giving consideration to the impact of the phase coexistence on individual compression behaviors. The EoS of fcc and hcp Kr have been determined using angular dispersive x-ray diffraction (XRD) up to 50 GPa [5] and in earlier works using energy-dispersive XRD techniques up to 128 GPa [7–9]. The reported EoS parameters V0(unit cell volume at ambient pressure), K0 (bulk modulus), and K′(first derivative of K0) exhibits a large dispersion (e.g., more 100% between K0values reported in Refs. [8] and [9]). Extended x-ray absorption fine structure spectroscopy (EXAFS) studies have been performed on solid krypton up to 30 GPa [10,11], but no significant effects
1European Synchrotron Radiation Facility (ESRF), 71, Avenue des Martyrs, Grenoble, France
2Sorbonne Université, Muséum National d’Histoire Naturelle, UMR CNRS 7590, IRD, Institut de Minéralogie, de Physique des Matériaux et de
Cosmochimie, IMPMC, 75005 Paris, France
3Laboratoire Magmas et Volcans, Université Clermont Auvergne, CNRS, IRD, OPGC, F-63000 Clermont-Ferrand, France 4Geodynamics Research Center, Ehime University, 2-5 Bunkyo-cho, Matsuyama 790-8577, Japan
on the local atomic arrangement related to the martensitic phase transition have been reported. This could be due to the structural proximity between the hcp and fcc polymorphs in the investigated low-pressure domain.
The object of this work is to study in detail the effect of the martensitic transition on the bulk mechanical properties (compressibility) of krypton. We report the EoS of fcc and hcp krypton in an extended pressure range up to 140 GPa using x-ray diffraction. Additionally, we performed extended x-ray absorption spectroscopy (XAS) measurements up to 110 GPa to confirm the fcc to hcp transformation and to extract the fraction of the hcp phase, as XAS measurements are less sensitive to variations of grain size and preferred orientations. We demonstrate that fcc Kr is stiffer than hcp Kr. This difference in stiffness strongly affects the fcc compressional behavior when the hcp volume fraction reaches ∼20% and the hcp clusters interconnect.
II. EXPERIMENTAL DETAILS
High purity (99.99%) krypton gas from the company Air Products was used as starting material. Two independent x-ray diffraction (XRD) runs referred as runs 1 and 2 were performed using two membrane diamond anvil cells (m-DACs) [12] equipped with diamonds of culet size of 250 and 150 µm. These m-DACs were employed to generate very high pressures up to 102 and 140 GPa, respectively. The krypton gas pressurized to 230 bars was loaded in a microcavity drilled at the center of a preindented rhenium gasket using a gas loading device from the company Sanchez Technology. The initial diameter of the microcavity was 100 and 70 µm for runs 1 and 2, respectively. A small ruby sphere of less than 5 µm in diameter and a 5-µm-thick nickel foil were placed in the sample cavity prior to gas loading in the two m-DACs. Ruby was used as internal pressure sensor using the ruby luminescence technique [13] and the pressure scale reported by Ref. [14]. The sample in run 1 was laser heated indirectly at regular pressure steps by irradiating the nickel foil using an infrared laser (TEM00 mode, λ =1.064 µm), while the sample in run 2 was kept at ambient temperature to evaluate the effect of strain and kinetics on the fcc-hcp transformation. Annealing temperatures in run 1 were measured by spectroradiometry as described in Ref. [15]. After temperature annealing nickel could not be used anymore as pressure sensor because of the penetration of krypton and possible chemical reactions with the diamonds (expansion of the lattice parameter due to Kr incorporation and later formation of NiC). Therefore, only the nickel foil in run 2, which was kept at room temperature (no annealing), could be used as XRD pressure marker up to the maximum investigated pressure using the equation of state reported by Ref. [14].
We performed XRD and XAS measurements at the beam-lines ID27 and ID24 of the European Synchrotron Radiation Facility (ESRF) [16,17]. These beamlines provide very intense and highly focused x rays well suited for high-pressure ex-periments. At ID27, monochromatic high energy x rays of 33.16 keV were selected using a silicon (111) double-crystal monochromator. A pair of mirrors in the Kirkpatrick-Baez geometry was employed for focusing the x-ray beam down to 3 × 3 µm2. A 15-µm pinhole located at ∼50 mm distance from the sample was used to limit the contamination of the sample
XRD images from parasitic signals such as rhenium gasket. Clean XRD patterns of liquid and solid krypton have been obtained from 0.3 to 140 GPa. The XRD signal was collected in transmission geometry on a MAR165 large area CCD detector. The sample to detector distance, detector tilt angles and beam center position were calibrated with high precision using a cerium oxide powder standard. The diffraction images were sliced and integrated along the azimuth into 72 spectra every 5° using the software FIT2D [18]. The unit cell volumes of krypton and nickel, and fcc-hcp phase proportion were obtained by Rietveld refinement using the software MAUD [19].
At the energy-dispersive XAS beamline ID24 extended x-ray absorption data were collected in an energy range between 14.2 to 15.2 keV containing the K-edge energy of krypton (14.385 keV) using a Si (111) polychromator [17]. Two rhodium-coated mirrors and one silicon-coated mirror were employed for beam focusing as well as for harmonic rejection. The x-ray beam was focused down to 10 × 10 µm2 (FWHM) in the horizontal and vertical directions.
Two independent XAS runs, named run 3 and run 4, were performed using two m-DACs. In run 3 a cell equipped with nanopolycrystalline diamonds of 250-µm culet size was employed, allowing collection of glitch-free clean XAS data [20]. In run 4 the m-DAC was equipped with single crystal diamonds of 150 µm. Rhenium gaskets preindented to 33- and 28-µm thickness were used. Laser-drilled holes of 105- and 75-µm diameter served as sample cavities for the 250- and 150-µm culet size diamonds, respectively. Krypton was gas loaded in the sample chamber together with a small ruby sphere serving as pressure sensor up to 70 GPa. Beyond this pressure, the Raman shift of the single crystal diamond anvils was used [21] for pressure measurements.
High-quality Kr-XAS spectra were acquired with an expo-sure time of 50 ms using a FReLoN CCD camera [17] from 0.5 to 110 GPa. For each pressure point at least three XAS spectra were collected and averaged. The m-DAC equipped with single-crystal diamonds was rotated to eliminate the glitches in the XANES spectra due to the diffraction of the diamond anvils.
III. RESULTS AND DISCUSSION
The low-pressure regime and the effect of temperature annealing were investigated in detail in the XRD run 1, while run 2 was more focused on the high-pressure regime. For direct comparison, the XRD data collected in both runs are overlapping in a wide pressure interval (∼80 GPa). A series of diffraction images collected in run 1 between 0.95 and 15 GPa is shown in Fig.1. We found that liquid krypton solidifies at 0.97 (2) GPa, which is in good agreement with previous studies [5,22,23]. At this pressure, a good quality single crystal of pure fcc krypton is obtained.
With increasing pressure to ∼2.7 GPa, an additional weak diffuse scattering signal is observed in the XRD images [see zoomed inlets in Fig. 1(a)] in the vicinity of the (111) fcc reflection (here referred to as (111)FKr). This observation suggests that similar to xenon [2] stacking faults occur along the fcc [111] direction in Kr. As demonstrated in Refs. [2,5], the appearance of x-ray diffuse scattering signals corresponds
FIG. 1. (a) Series of diffraction images from run 1 showing the formation of fcc krypton (first row) and the progressive appearance of diffuse x-ray scattering from the hcp phase (second row). Intense reflections or diffractions lines of fcc and hcp Kr as well as Ni are labelled as F, H, and Ni. (b) zoomed regions of selected images from A showing the evolution of diffused scattering around the fcc (111)F reflection (green rectangles in (a)). (c) Integrated (111)F and (100)H reflections before and after annealing (black and red lines, respectively) at different pressures.
to the onset of the fcc to hcp martensitic transition due to the presence of an increasing concentration of stacking faults upon compression. The pressure at which the diffuse scattering appears upon compression is in good agreement with the pressure reported in Ref. [5] for the complete back transformation of hcp to fcc Kr on decompression at ∼3.2 GPa. However, a recent dynamic compression study reported a lower onset pressure of 0.8 GPa for the fcc-hcp transition [22]. They observed only a slight compression rate dependency of this transition for rates between 0.004 to 0.13 GPa/s. This suggests a low kinetic barrier associated with the transition.
The diffuse scattering signal persisted after temperature treatment at > 1500 K, confirming that the occurrence of the hcp-fcc transition is not induced by nonhomogeneous stress conditions. The sample was further temperature annealed at regular pressure intervals resulting in a reduction of the diffrac-tion peaks width and a sample recrystallizadiffrac-tion [Fig.1(b)] but without affecting significantly the fcc/hcp phase ratio.
A series of integrated patterns are presented in Fig.2. As expected from pressure-induced disorder of the stacking of close-packed atomic layers, we observe a transfer of diffracted intensity mainly from the (111) and (200) peaks of the fcc lattice to the (100), (101) peaks of the hcp phase, respectively.
The fcc-hcp transition was also studied by XAS. Figure3(a)
shows the evolution of Kr K-edge XANES spectra from runs 3 and 4. XAS is indeed only sensitive to the local order around individual krypton atoms and is not affected by the nanometric
FIG. 2. (a) Series of integrated diffraction patterns with most intense peaks labelled from 2.7 to 137 GPa. The labels F, H, and Ni indicate the diffraction peaks from fcc krypton, hcp krypton, and fcc nickel, respectively. Lines are guidelines for the eyes to indicate the evolution of diffraction peak positions. (b) Rietveld refinement of a typical diffraction pattern collected at 135 GPa. C. Azimuthally enrolled image showing the sample texture at 135 GPa (images were sliced and integrated along the azimuth into 72 spectra every 5°).
domain size as well as by crystallographic preferred orientation at least for optical uniaxial materials (i.e., cubic, hexagonal, and trigonal) responsible for the peak broadening in the XRD data. At pressures above 30 GPa, we observed an enlargement followed by a splitting of the first oscillation in the XANES spectra related to the increase of volume fraction of the hcp phase. This splitting is explained in the full-multiple scattering (FMS) ab initio simulation of solid fcc and hcp Kr presented in Fig.3(b)(Feff9 code [24]). Full multiple scattering XANES
FIG. 3. (a, b) Experimental and calculated normalized krypton K-edge XANES spectra and their evolution with pressure up to 110 GPa (numbers indicate the pressure). (a) Dashed lines labeled with A and B denote the broadening and splitting of the first XANES peak, while the dashed line labeled as C highlights changes in the second XANES oscillations. (b) Solid black, gray, and blue dotted lines are XANES calculations of fcc, hcp, and mixed fcc-hcp signals (calculated using volume fractions presented in Fig.4) of Kr at different pressures, respectively.
spectra were computed for fcc and hcp Kr for a sphere with a FMS radius of 6 ˚A using the lattice parameters from the XRD data at three different pressures (25, 55, and 103 GPa). For the self-consistent loop a cluster of 4 ˚A and a convergence after 30 iterations was chosen. The core hole was calculated after the final state rule and the scattering amplitude was fixed to 1 for all calculations. The XANES spectra were calculated with a fine grid of 0.5 eV. The exchange potential for the fine structure and the atomic background were calculated using the Hedin-Lundquist formalism and the ground state, respectively. Already at low pressure, the fcc and hcp contributions to the XANES spectra exhibit different features. In fact, the first XANES peak of fcc and hcp are shifted in energy. This explains the observed broadening, splitting, and intensity reduction of first XANES shoulder of the experimental XANES spectra with increasing volume fraction of the hcp phase as shown for the calculated mixed fcc-hcp spectra [blue dotted lines in Fig. 3(b)]. For fcc krypton detailed full multiple scattering simulations combined with Monte-Carlo calculations have revealed a direct relation between white line position and the next-nearest neighbour distance [10] in agreement with our experimental observations and calculations. Such an analysis is not available for the hcp structure, but would be required together with experimental XAS data of the pure hcp phase for a deeper understanding of hcp XANES features and therefore its electronic structure.
The pressure dependence of the hcp volume fraction (VFhcp) is reported in Fig. 4. For XRD runs 1 and 2, the VFhcp is obtained from the Rietveld refinement by phase proportion
FIG. 4. Pressure evolution of the hcp phase’s volume fractions (VFhcp) extracted from the XRD runs 1 (black empty circles) and 2
(black gray circles), as well as the XAS runs 3 and 4 (red empty circles). Red circles indicate annealed points in run 1. The gray and black lines are guidelines for the eye to distinguish run 1 with temperature annealing from runs 2, 3, and 4 without. Pressure uncertainties vary between 2% and 6% at the minimum and maximum pressure, respectively. The error on the extracted volume fraction for the hcp phase (VFhcp) are in the order of 6% at pressures beyond 20 GPa. At lower pressures uncertainties are slightly higher due to the weak diffraction signal. Uncertainties on VFhcp are smaller than the symbol size.
analysis of the XRD patterns using the intensity ratio of all reflections. For the XAS runs 3 and 4 the volumetric proportion of the hcp phase was determined from the width, area, and height ratios of two Lorentzian peak functions fitted to the first XANES peak. At pressures below ∼20 GPa, the weak intensity of the hcp diffraction signal did not allow to accurately determine VFhcp. As mentioned in Refs. [2,5], the observed difference in VFhcpvariations between the two XRD runs can be due to the presence of preferential orientation of crystallites and different thermal treatment. However, VFhcp follows the same trend for both runs and reaches ∼40% at 140 GPa in run 2. The pressure evolution VFhcpobtained in the XAS runs 3 and 4, which is less sensitive to preferred orientations is in better agreement with run 2.
The completion of the fcc-hcp transformation derived by linear extrapolation is estimated to occur at ∼400 GPa, sug-gesting a very wide coexistence domain of more than 300 GPa. The extrapolated transition pressure is much higher than the calculated complete fcc-hcp transition pressure of 130 GPa [6] and also exceeds the predicted hcp metallization pressure of 337 GPa [25]. It is worth noting that the quantity of the hcp polymorph slightly increases after temperature annealing at 1500 K attesting that the pressure evolution of the VFhcp is marginally affected by temperature treatment. In agreement with Ref. [5], this demonstrates that the hcp phase is not stabilized by nonuniform stress conditions and that there is no large kinetics barrier that would inhibit the completion of the hcp-fcc transformation in the investigated pressure range. Moreover, this result may also support the suggestion of Ref. [5] that the Clapeyron slope of the fcc-hcp transition is negative as the hcp phase is stabilized over the fcc form with increasing temperature.
We also refined the average crystallite domain size of hcp (CDShcp) and fcc (CDSfcc) krypton from peak profile analysis using an anisotropic size-strain model of the diffraction line broadening according to Popa’s model integrated in MAUD [26]. Refined microstrain were in the order 1.24 − 4.15 × 10⁻³
FIG. 5. Evolution of the crystallite domain size (CDS) for the fcc and hcp phases with pressure. Pressure uncertainties vary between 2% and 6% at the minimum and maximum pressure, respectively. Uncertainties on CDS extracted from Rietveld refinement are in the order of 0.5 ˚A and are smaller than the symbol sizes.
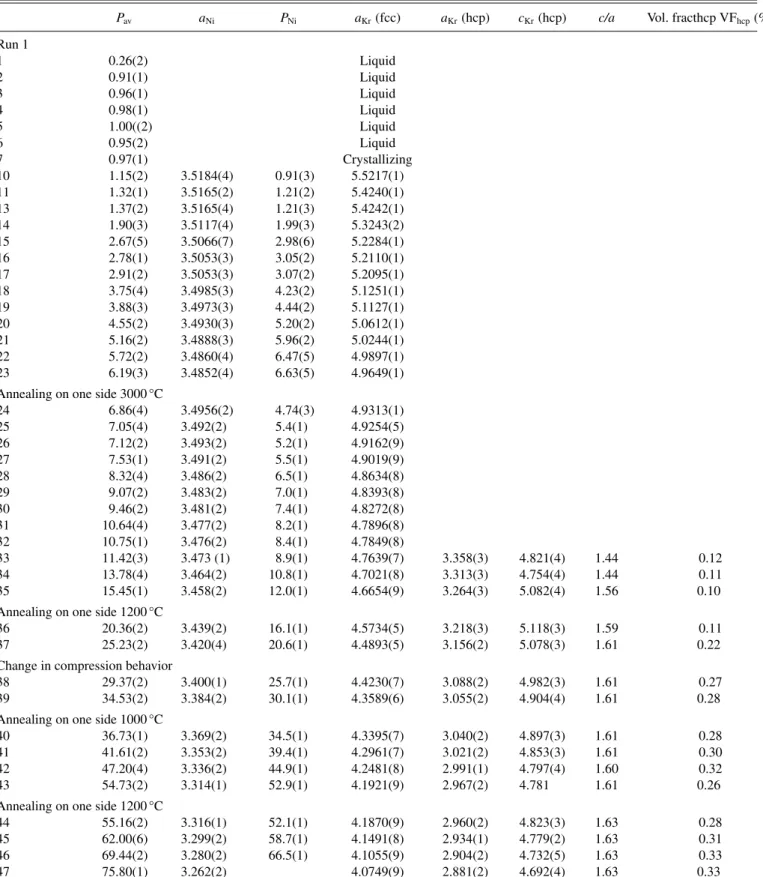
TABLE I. Pressure evolution of the unit cell parameters a and c, c/a ratio, and volume fraction of the hcp phase VFhcpextracted from Rietveld
refinement of two independent experimental runs (run 1 and run 2). The uncertainties on pressure, evaluated from the pressure differences before and after an acquisition, measured with the ruby luminescence gauge14, is smaller than 0.5% up to 100 GPa. The intrinsic uncertainties of
the ruby and Ni metal pressure gauges vary between 2% and 6% at the minimum and maximum pressure after14and are ploted in Figs.4–8;
the relative uncertainty on unite cell volume is smaller than 10−3over the entire pressure range. The error on the extracted volume fraction for
the hcp phase (VFhcp) are in the order of 6% at pressures beyond 20 GPa, while at lower pressures uncertainties are slightly higher due to the
weak diffraction signal.
Pav aNi PNi aKr(fcc) aKr(hcp) cKr(hcp) c/a Vol. fracthcp VFhcp(%)
Run 1 1 0.26(2) Liquid 2 0.91(1) Liquid 3 0.96(1) Liquid 4 0.98(1) Liquid 5 1.00((2) Liquid 6 0.95(2) Liquid 7 0.97(1) Crystallizing 10 1.15(2) 3.5184(4) 0.91(3) 5.5217(1) 11 1.32(1) 3.5165(2) 1.21(2) 5.4240(1) 13 1.37(2) 3.5165(4) 1.21(3) 5.4242(1) 14 1.90(3) 3.5117(4) 1.99(3) 5.3243(2) 15 2.67(5) 3.5066(7) 2.98(6) 5.2284(1) 16 2.78(1) 3.5053(3) 3.05(2) 5.2110(1) 17 2.91(2) 3.5053(3) 3.07(2) 5.2095(1) 18 3.75(4) 3.4985(3) 4.23(2) 5.1251(1) 19 3.88(3) 3.4973(3) 4.44(2) 5.1127(1) 20 4.55(2) 3.4930(3) 5.20(2) 5.0612(1) 21 5.16(2) 3.4888(3) 5.96(2) 5.0244(1) 22 5.72(2) 3.4860(4) 6.47(5) 4.9897(1) 23 6.19(3) 3.4852(4) 6.63(5) 4.9649(1) Annealing on one side 3000 °C
24 6.86(4) 3.4956(2) 4.74(3) 4.9313(1) 25 7.05(4) 3.492(2) 5.4(1) 4.9254(5) 26 7.12(2) 3.493(2) 5.2(1) 4.9162(9) 27 7.53(1) 3.491(2) 5.5(1) 4.9019(9) 28 8.32(4) 3.486(2) 6.5(1) 4.8634(8) 29 9.07(2) 3.483(2) 7.0(1) 4.8393(8) 30 9.46(2) 3.481(2) 7.4(1) 4.8272(8) 31 10.64(4) 3.477(2) 8.2(1) 4.7896(8) 32 10.75(1) 3.476(2) 8.4(1) 4.7849(8) 33 11.42(3) 3.473 (1) 8.9(1) 4.7639(7) 3.358(3) 4.821(4) 1.44 0.12 34 13.78(4) 3.464(2) 10.8(1) 4.7021(8) 3.313(3) 4.754(4) 1.44 0.11 35 15.45(1) 3.458(2) 12.0(1) 4.6654(9) 3.264(3) 5.082(4) 1.56 0.10 Annealing on one side 1200 °C
36 20.36(2) 3.439(2) 16.1(1) 4.5734(5) 3.218(3) 5.118(3) 1.59 0.11 37 25.23(2) 3.420(4) 20.6(1) 4.4893(5) 3.156(2) 5.078(3) 1.61 0.22 Change in compression behavior
38 29.37(2) 3.400(1) 25.7(1) 4.4230(7) 3.088(2) 4.982(3) 1.61 0.27 39 34.53(2) 3.384(2) 30.1(1) 4.3589(6) 3.055(2) 4.904(4) 1.61 0.28 Annealing on one side 1000 °C
40 36.73(1) 3.369(2) 34.5(1) 4.3395(7) 3.040(2) 4.897(3) 1.61 0.28 41 41.61(2) 3.353(2) 39.4(1) 4.2961(7) 3.021(2) 4.853(3) 1.61 0.30 42 47.20(4) 3.336(2) 44.9(1) 4.2481(8) 2.991(1) 4.797(4) 1.60 0.32 43 54.73(2) 3.314(1) 52.9(1) 4.1921(9) 2.967(2) 4.781 1.61 0.26 Annealing on one side 1200 °C
44 55.16(2) 3.316(1) 52.1(1) 4.1870(9) 2.960(2) 4.823(3) 1.63 0.28 45 62.00(6) 3.299(2) 58.7(1) 4.1491(8) 2.934(1) 4.779(2) 1.63 0.31 46 69.44(2) 3.280(2) 66.5(1) 4.1055(9) 2.904(2) 4.732(5) 1.63 0.33 47 75.80(1) 3.262(2) 4.0749(9) 2.881(2) 4.692(4) 1.63 0.33
TABLE I. (Continued.)
Pav aNi PNi aKr(fcc) aKr(hcp) cKr(hcp) c/a Vol. fracthcp VFhcp(%)
Annealing on one side 1200 °C
48 76.16(2) 3.265(2) 73.0(1) 4.0675(9) 2.876(2) 4.689(3) 1.63 0.35 49 82.76(1) 3.249(2) 80.5(1) 4.0402(9) 2.856(3) 4.655(3) 1.63 0.36 50 89.41(1) 3.232(2) 88.8(1) 4.0114(8) 2.836(2) 4.622(3) 1.63 0.38 51 95.90(2) 3.219(2) 95.8(1) 3.9854(9) 2.818(2) 4.592(4) 1.63 0.39 52 102.77(5) 3.206(2) 103.0(1) 3.9597(9) 2.800(2) 4.563(4) 1.63 0.41 Run 2 1 18.16(1) 3.4375(1) 19.43(3) 4.5824(3) 3.218(3) 5.020(5) 1.56 0.16 2 18.97(7) 3.4363(1) 19.71(3) 4.5796(3) 3.208(4) 5.049(5) 1.57 0.17 3 19.50(1) 3.4330(1) 20.48(4) 4.5682(3) 3.201(3) 5.015(4) 1.57 0.17 4 20.19(3) 3.4306(1) 21.02(4) 4.5588(3) 3.204(5) 5.082(4) 1.59 0.19 5 21.07(2) 3.4266(1) 21.96(4) 4.5416(3) 3.186(3) 5.033(5) 1.58 0.20 6 24.33(4) 3.4149(1) 24.82(5) 4.4924(3) 3.156(3) 5.025(4) 1.59 0.20 7 29.84(5) 3.3973(1) 29.37(5) 4.4260(2) 3.118(3) 4.948(4) 1.59 0.20 8 34.09(4) 3.3827(1) 33.40(5) 4.3769(2) 3.081(3) 4.904(4) 1.59 0.21 10 47.33(9) 3.3358(1) 48.10(5) 4.2497(2) 2.998(2) 4.765(3) 1.59 0.21 11 55.37(6) 3.3124(1) 56.49(5) 4.1785(2) 2.944(2) 4.694(3) 1.60 0.25 12 66.5(2) 3.2806(1) 69.19(5) 4.1048(3) 2.902(2) 4.700(3) 1.62 0.31 13 74.82(8) 3.2638(1) 76.56(5) 4.0624(3) 2.874(2) 4.688(3) 1.63 0.21 14 82.2(5) 3.2515(1) 82.29(6) 4.0354(3) 2.855(3) 4.657(3) 1.63 0.28 15 90.44(2) 3.2336(1) 91.04(6) 3.9978(3) 2.827(2) 4.613(3) 1.63 0.30 16 98.8(4) 3.2201(1) 98.05(6) 3.9704(3) 2.809(2) 4.582(3) 1.63 0.30 17 3.2078(1) 104.7(1) 3.9477(3) 2.788(3) 4.542(4) 1.63 0.34 18 3.1971(1) 110.9(1) 3.9266(3) 2.775(3) 4.528(4) 1.63 0.36 19 3.1925(1) 113.5(1) 3.9173(3) 2.769(3) 4.518(4) 1.63 0.37 20 3.1825(1) 119.4(1) 3.8977(3) 2.759(4) 4.500(5) 1.63 0.34 21 3.1740(1) 124.9(1) 3.8806(4) 2.748(4) 4.480(5) 1.63 0.33 22 3.1662(1) 129.9(1) 3.8658(4) 2.738(4) 4.462(5) 1.63 0.29 23 3.1585(1) 134.9(1) 3.8557(4) 2.730(4) 4.449(5) 1.63 0.40 24 3.1512(1) 139.9(1) 3.8413(5) 2.718(4) 4.431(5) 1.63 0.43
with an average uncertainty of 5 × 10⁻⁴. We observed a drastic reduction with pressure of CDSfcc concomitant to a slight increase of CDShcp (Fig. 5). This evolution suggests that the hcp phase nucleates and grows around nanometric
stacking fault domains and gradually fills the sample volume by interconnection of these nanodomains.
We have measured a large number of pressure-volume (P -V ) points for the fcc and hcp phases in a very wide pressure
FIG. 6. (a) Pressure evolution of the Vat( ˚A 3
) atomic volume for the fcc and hcp phases. (b) Evolution of Vat( ˚A 3
) for the fcc phase from this study and previous works as indicated in the legend. The arrow indicates the pressure were an anomaly in the compression behavior of fcc Kr was observed. Pressure uncertainties vary between 2% and 6% at the minimum and maximum pressure, respectively. Uncertainties on Vatare
TABLE II. Equation of state parameters V0, K0, and K′and pressure range investigated from this work and the literature.
V0( ˚A 3
) K0(GPa) K′ Pressure range (GPa)
This study 219.25(1) 1.55(4) 7.10(5) 1–140 Jephcoat et al. (1998) 180.0 3.32(5) 7.23(5) 3–136 Polian et al. (1989) 240.1(3) 1.4(5) 4.3(1) 2–30 Errandonea et al. (2002) 197.3 2.7(9) 5.4(7) 1–50 Tian et al. (2012)—Calculation 182.3 4.37(3) 5.70(2) 0–300
domain to evaluate the effect of the martensitic transition on the equation of state of krypton. The P -V data obtained from the XRD data by refinement of the atomic volume are reported in Table I. As already mentioned, run 1 was used to finely explore the low-pressure regime below 20 GPa and run 2 to extend the investigated domain to very high-pressures up to 140 GPa. In run 1, the pressure is obtained from the shift of the R1 ruby luminescence line maximum and using the modified expression of Mao’s equation with the refined parameters of Ref. [14]. The tabulated pressures Pav.are the average of the measured pressures before and after every XRD data collection. In run 2 (no annealing), the pressure is also measured from the unit cell variation of nickel and using the equation of state from Ref. [14]. An excellent agreement is found between the two resulting P -V datasets for fcc and hcp krypton in the wide overlapping pressure domain from 20 to 105 GPa. In good agreement with Ref. [5], we observe, for hcp krypton, a small variation of the c/ a ratio around its ideal value 1.633 indicative of a nearly similar compressibility of both crystallographic axes. This is additional evidence that the fcc phase gradually converts to hcp because of the increasing num-ber of stacking faults in the structure. As already reported [2,5]
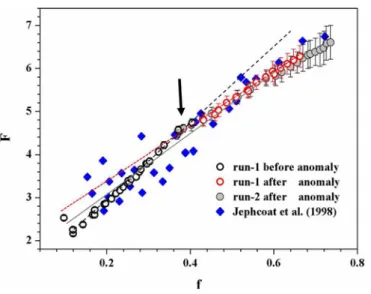
FIG. 7. Normalized pressure, F , vs. Eulerian strain, f , for the fcc phase showing an anomaly when VFhcpreaches ∼20%. The dashed
black and red lines correspond to the linear fits for the pressure regions before and after the anomaly, respectively, while the solid gray line shows the fitting result over the entire P range. The arrow indicates the pressure were an anomaly in the compression behavior of fcc Kr was observed. Pressure uncertainties vary between 2% and 6% at the minimum and maximum pressure, respectively. Uncertainties on the Eulerian strain f are within the symbol size.
for xenon and krypton, this discards the scenario where the fcc/hcp transformation proceeds through an intermediate close packed phase induced by shear deformation [27].
The measured P -V points for fcc and hcp krypton are presented in Fig.6(a)and, for clarity, the P -V relationship for the fcc phase only are reported in Fig.6(b)together with previous literature data [5,7–9,11]. The P -V points for the fcc and hcp phase obtained in runs 1 and 2 are in excellent agreement [Fig. 6(a)]. At pressures below ∼20 GPa, the precision on the determination of the atomic volume Vat(hcp) of the hcp phase is low because, in this pressure regime, weak and broad hcp reflections from nanometric domains are overlapping with intense fcc reflections. At higher pressures as the domain size and volume fractions of the hcp phase increase (see Figs.2and4), its atomic volume Vat(hcp)could be determined with a similar precision as the fcc phase (typically below 10−3). In this case, the difference between V
at(hcp) and Vat(fcc) is smaller than the error bars and the datasets of the two phases become indistinguishable. There is also no
FIG. 8. Evolution of V /V0 of fcc Kr with pressure in run 1.
Black and red symbols present data points before and after anomaly, respectively. Black and red lines present third-order Birch-Murnaghan EoS fits to data points only before and after the anomaly, while the gray line shows the fit to the entire data points. Pressure uncertainties vary between 2% and 6% at the minimum and maximum pressure, respectively. Uncertainties on the reduced volumes are smaller than the symbol sizes.
TABLE III. Equation of state parameters V0, K0, and K′for the fcc krypton from data collected before and after the anomaly and for the
entire pressure range investigated in run 1.
V0(A3) K0(GPa) K′ Pressure range (GPa)
Before anomaly 220.10(1) 1.04(3) 9.9(1) 1.4–13 After anomaly 220.61(1) 2.05(3) 6.06(5) 35–103 Entire P range 219.25(1) 1.55(4) 7.10(5) 1.4–103
noticeable effect of temperature annealing on the obtained atomic volumes as shown in Fig.6(a).
The ambient-pressure unit cell volume V0, the bulk modulus K0, and its first derivative K′
are derived from the fit to the P -V data using a third-order Birch-Murnaghan equation of state (EoS) and the software EoSFit [28]. The values of V0, K0, and K′for the fcc phase are reported together with literature data in TableII. The EoS parameters from this work strongly deviates from the values reported by [5] that have been obtained using a similar technique (monochromatic XRD) and from earlier works [7–9] using energy-dispersive XRD (EDX). This is explained by the larger number of data points measured in this study, especially in the low-pressure regime, which enables a more accurate determination of V0and K0. Moreover, the smaller investigated pressure domain in [5] and the lower energy resolution of EDX as compared to monochromatic XRD induces a higher dispersion in the reported P -V points [see Figs.6(b)and7].
The dispersion in the EoS parameters from different works could also be related to the progressive martensitic transfor-mation. A classical method to identify subtle anomalies in the compression behavior of a material is provided by the normal-ized pressure, F , versus Eulerian strain, f [29,30], where f = [(V /V 0) − 2/3 − 1]/2 and F = P /[3f (1 + 2f )5/2]. The F −f plot for the fcc phase of krypton together with literature data [9] are presented in Fig.7. A clear deviation to a linear behavior is evidenced between 25 and 29 GPa (f ∼ 0.4−0.43) when the volume fraction of the hcp phase reaches ∼20% (TableI and Fig.4). Two pressure regimes were then fitted separately to a third-order Birch-Murnaghan EoS for run 1 (best data obtained with temperature annealing) using as a first estimation of the EoS input parameters a linear fitting of the normalized pressure. The results are presented in Fig.8and TableIII.
The low-pressure regime EoS of fcc krypton extrapolated to pressures beyond 30 GPa is clearly above the high-pressure regime EoS of fcc krypton suggesting that the krypton sample becomes softer. This behavior can also be explained by the increase of the hcp stacking fault fraction. At lower pressures, the presence of a smaller hcp volume fraction (<20%) does not substantially affect the fcc compression behavior. As
shown in the F −f plot (Fig.7), the deviation from a linear behavior occurs in a small pressure interval of ∼4 GPa. The anomaly in the fcc compression behavior can be explained by the interconnection of nanometric hcp domains once the hcp fraction reaches ∼20%, as this value corresponds to the ob-served anomaly in the F-f plot and may correspond to the percolation threshold for this system. In this scenario, the softer fcc grains are surrounded by a stiffer network of hcp stacking faults, that only absorb a fraction of the applied load. The fcc grains therefore have to accommodate a higher load which induces a greater volume reduction of the fcc phase after the anomaly (Fig.8). This transition mechanism through nucleation and growth of hcp stacking faults is consistent with the one proposed for the fcc-hcp in argon from molecular dynamics simulations [31].
IV. CONCLUSIONS
The equation of state of krypton has been obtained with unprecedented accuracy in a very wide pressure domain. Due to the proximity of their Gibbs free energy, the fcc and hcp polymorphs coexist in a very wide pressure domain of 135 GPa, which may extend up to 400 GPa by extrapo-lation of the volume fraction evolution. XRD and XANES measurements evidence the nucleation of the hcp phase as nanometric faults, ruling out the formation of an orthorhombic intermediate phase. The transformation is progressive with a regular increase of the hcp volume fraction and domain size. A deviation from a normal behavior is observed in the equation of state of krypton at ∼20 GPa when the hcp volume fraction reaches ∼20%. Two regimes with different EoS parameters are identified and explained by the increasing concentration of hcp stacking faults. A similar behavior is expected at lower pressure in solid xenon.
ACKNOWLEDGMENT
We thank the European Synchrotron Radiation Facility (ESRF) for providing beamtime for this project as well as the editor for fast editorial handling and the two anonymous referees for their helpful and constructive comments.
[1] Z. Nishiyama, Martensitic Transformation (Academic Press, New York, 1978).
[2] H. Cynn, C. S. Yoo, B. Baer, V. Iota-Herbei, A. K. McMahan, M. Nicol, and S. Carlson,Phys. Rev. Lett. 86,4552(2001). [3] A. K. McMahan,Phys. Rev. B 33,5344(1986).
[4] A. Dewaele, P. Loubeyre, P. Dumas, and M. Mezouar,Phys. Rev. B 86,014103(2012).
[5] D. Errandonea, B. Schwager, R. Boehler, and M. Ross,Phys. Rev. B 65,214110(2002).
[6] I. Kwon, L. A. Collins, J. D. Kress, and N. Troullier,Phys. Rev. B 52,15165(1995).
[7] I. V. Aleksandrov, A. N. Zisman, and S. M. Stishov, Zh. Eksp. Teor. Fiz. 92, 657 (1987) [Sov. Phys.-JETP 65, 371 (1987)].
[8] A. Polian, J. M. Besson, M. Grimsditch, and W. A. Grosshans,
Phys. Rev. B 39,1332(1989).
[9] A. Jephcoat,Nature (London) 393,355(1998).
[10] A. Di Cicco, A. Filipponi, J. P. Itie, and A. Polian,Phys. Rev. B
54,9086(1996).
[11] A. Polian, J. P. Itié, E. Dartyge, A. Fontaine, and G. Tourillon,
Phys. Rev. B 39,3369(1989).
[12] R. Le Toullec, J. P. Pinceaux, and P. Loubeyre,High Press. Res.
1,77(1988)
[13] H.-K. Mao, J. Xu, and P. Bell,J. Geophys. Res. 91,4673(1986). [14] A. Dewaele, M. Torrent, P. Loubeyre, and M. Mezouar,Phys.
Rev. B 78,104102(2008).
[15] M. Mezouar, R. Giampaoli, G. Garbarino, I. Kantor, A. De-waele, S. Boccato, V. Svitlyk, A. D. Rosa, R. Torchio, O. Mathon, O. Hignette, and S. Bauchau,High Press. Res. 37,170
(2017).
[16] M. Mezouar, W. A. Crichton, S. Bauchau, F. Thurel, H. Witsch, F. Torrecillas, G. Blattmann, P. Marion, Y. Dabin, J. Chavanne, O. Hignette, C. Morawe, and C. Borel,J. Synch. Rad. 12,659
(2005).
[17] S. Pascarelli, O. Mathon, T. Mairs, I. Kantor, G. Agostini, C. Strohm, S. Pasternak, F. Perrin, G. Berruyer, P. Chappelet, C. Clavel, and M. C. Dominguez,J. Synch. Rad. 23,353(2016). [18] A. P. Hammersley, S. O. Svensson, M. Hanfland, A.N. Fitch,
and D. Hausermann,High Press. Res. 14,235(1996).
[19] L. Lutterotti, S. Matthies, H.-R. Wenk, A. J. Schultz, and J. Richardson,J. Appl. Phys. 81,594(1997).
[20] N. Ishimatsu, K. Matsumoto, H. Maruyama, N. Kawamura, M. Mizumaki, H. Sumiya, and T. Irifune,J. Synchr. Rad. 19,768
(2012).
[21] Y. Akawama and H. Kawamura,J. Appl. Phys. 96,3748(2004). [22] J.-Y. Chen, C.-S. Yoo, W. J. Evans, H.-P. Liermann, H. Cynn,
M. Kim, and Z. Jenei,Phys. Rev. B 90,144104(2014). [23] R. K. Crawford and C. A. Swenson,J. Phys. Chem. Solids 36,
145(1975).
[24] J. J. Rehr, J. J. Kas, F. D. Vila, M. P. Prange, and K. Jorissen,
Phys. Chem. Chem. Phys. 12,5503(2010)
[25] A. P. Koufos and D. A. Papaconstantopoulos,J. Supercond. Nov. Magn. 28,3525(2015).
[26] N. C. Popa and D. Balzar, J. Appl. Crystallogr. 35, 338
(2002).
[27] A. P. Jephcoat, H.-k. Mao, L. W. Finger, D. E. Cox, R. J. Hemley, and C.-s. Zha,Phys. Rev. Lett. 59,2670(1987).
[28] R. J. Angel, J. Gonzalez-Platas, and M. Alvaro,Z. Kristallogr.
229, 405 (2014).
[29] R. Jeanloz and R. M. Hazen,Am. Mineral. 76, 1765 (1991). [30] K. Godwal, S. V. Raju, Z. Geballe, and R. Jeanloz,J. Phys. Conf.
Ser. 377,012033(2012).
[31] B. Li, G. Qian, A. Oganov, S. Ed. Boulfelfel, and R. Faller,