HAL Id: hal-02446123
https://hal.archives-ouvertes.fr/hal-02446123
Submitted on 28 Aug 2020
HAL is a multi-disciplinary open access
archive for the deposit and dissemination of
sci-entific research documents, whether they are
pub-lished or not. The documents may come from
teaching and research institutions in France or
abroad, or from public or private research centers.
L’archive ouverte pluridisciplinaire HAL, est
destinée au dépôt et à la diffusion de documents
scientifiques de niveau recherche, publiés ou non,
émanant des établissements d’enseignement et de
recherche français ou étrangers, des laboratoires
publics ou privés.
Distributed under a Creative Commons Attribution| 4.0 International License
free troposphere at the La Paz/El Alto (Bolivia)
metropolitan area based on the Day of Census (2012)
A. Wiedensohler, Marcos Andrade, K. Weinhold, T. Müller, W. Birmili, F.
Velarde, I. Moreno, R. Forno, M.F. Sanchez, P. Laj, et al.
To cite this version:
A. Wiedensohler, Marcos Andrade, K. Weinhold, T. Müller, W. Birmili, et al.. Black carbon emission
and transport mechanisms to the free troposphere at the La Paz/El Alto (Bolivia) metropolitan area
based on the Day of Census (2012). Atmospheric Environment, Elsevier, 2018, 194 (19), pp.158-169.
�10.1016/j.atmosenv.2018.09.032�. �hal-02446123�
Contents lists available atScienceDirect
Atmospheric Environment
journal homepage:www.elsevier.com/locate/atmosenvBlack carbon emission and transport mechanisms to the free troposphere at the
La Paz/El Alto (Bolivia) metropolitan area based on the Day of Census (2012)
A. Wiedensohler
a,∗, M. Andrade
b,e, K. Weinhold
a, T. Müller
a, W. Birmili
a, F. Velarde
b, I. Moreno
b,
R. Forno
b, M.F. Sanchez
b, P. Laj
c,g,h, P. Ginot
c, D.N. Whiteman
d, R. Krejci
f, K. Sellegri
i,
T. Reichler
jaLeibniz Institute for Tropospheric Research, Leipzig, Germany
bLaboratory for Atmospheric Physics, Institute for Physics Research, Universidad Mayor de San Andres, La Paz, Bolivia cUniversity Grenoble Alpes, CNRS, IRD, IGE, Grenoble, France
dNASA/Goddard Space Flight Center, Greenbelt, MD, USA
eDepartment of Atmospheric and Oceanic Sciences, University of Maryland, College Park, MD, USA
fDepartment Environmental Science and Analytical Chemistry (ACES), Atmospheric Science Unit, Stockholm University, Stockholm, Sweden gDepartment of Physics, University of Helsinki, 0 0014, Helsinki, Finland
hInstitute for Atmospheric Sciences and Climate of the National Research Council, (ISAC-CNR), Bologna, Italy
iLaboratoire de Météorologie Physique CNRS UMR 6016, Observatoire de Physique du Globe de Clermont-Ferrand, Université Blaise Pascal, 63171, Aubière, France jDepartment of Atmospheric Sciences, University of Utah, Salt Lake City, UT, 84112, USA
A R T I C L E I N F O Keywords: Black carbon Traffic emissions Pollution transport Free troposphere A B S T R A C T
Urban development, growing industrialization, and increasing demand for mobility have led to elevated levels of air pollution in many large cities in Latin America, where air quality standards and WHO guidelines are fre-quently exceeded. The conurbation of the metropolitan area of La Paz/El Alto is one of the fastest growing urban settlements in South America with the particularity of being located in a very complex terrain at a high altitude. As many large cities or metropolitan areas, the metropolitan area of La Paz/El Alto and the Altiplano region are facing air quality deterioration. Long-term measurement data of the equivalent black carbon (eBC) mass con-centrations and particle number size distributions (PNSD) from the Global Atmosphere Watch Observatory Chacaltaya (CHC; 5240 m a.s.l., above sea level) indicated a systematic transport of particle matter from the metropolitan area of La Paz/El Alto to this high altitude station and subsequently to the lower free troposphere. To better understand the sources and the transport mechanisms, we conducted eBC and PNSDs measurements during an intensive campaign at two locations in the urban area of La Paz/El Alto from September to November 2012. While the airport of El Alto site (4040 m a.s.l.) can be seen as representative of the urban and Altiplano background, the road site located in Central La Paz (3590 m a.s.l.) is representative for heavy traffic-dominated conditions. Peaks of eBC mass concentrations up to 5 μg m−3were observed at the El Alto background site in the
early morning and evening, while minimum values were detected in the early afternoon, mainly due to thermal convection and change of the planetary boundary layer height. The traffic-related eBC mass concentrations at the road site reached maximum values of 10–20 μg m−3. A complete traffic ban on the specific Bolivian Day of
Census (November 21, 2012) led to a decrease of eBC below 1 μg m−3at the road site for the entire day.
Compared to the day before and after, particle number concentrations decreased by a factor between 5 and 25 over the particle size range from 10 to 800 nm, while the submicrometer particle mass concentration dropped by approximately 80%. These results indicate that traffic is the dominating source of BC and particulate air pol-lution in the metropolitan area of La Paz/El Alto. In general, the diurnal cycle of eBC mass concentration at the Chacaltaya observatory is anti-correlated to the observations at the El Alto background site. This pattern in-dicates that the traffic-related particulate matter, including BC, is transported to higher altitudes with the de-veloping of the boundary layer during daytime. The metropolitan area of La Paz/El Alto seems to be a significant source for BC of the regional lower free troposphere. From there, BC can be transported over long distances and exert impact on climate and composition of remote southern hemisphere.
https://doi.org/10.1016/j.atmosenv.2018.09.032
Received 30 October 2017; Received in revised form 13 September 2018; Accepted 17 September 2018
∗Corresponding author.
E-mail address:ali@tropos.de(A. Wiedensohler).
Available online 20 September 2018
1352-2310/ © 2018 The Author(s). Published by Elsevier Ltd. This is an open access article under the CC BY-NC-ND license (http://creativecommons.org/licenses/BY-NC-ND/4.0/).
1. Introduction
Particulate black carbon (BC) plays an important role in air quality and in the radiative balance of the Earth (Bond et al., 2013). Besides the harmfulness of BC particles as carriers of toxic trace compounds such as metals and polycyclic aromatic hydrocarbons, particulate BC is the strongest anthropogenic absorber of solar light in the atmosphere. However, the quantification of climate forcing due to atmospheric BC as a light-absorbing compound reveals to be still limited (IPCC; https:// ar5-syr.ipcc.ch/). Uncertainties in emission inventories imply that predicting particle mass concentrations of elemental carbon (or BC) as well as its temporal and spatial resolution remain a major problem. Furthermore, an improved knowledge of BC emitted and/or transported into the free troposphere might be of importance due to its significantly long residence time there. This could therefore also affect regions lo-cated far away through long-range transport. In addition to emission fluxes, quantifying radiative forcing from BC also requires knowledge of its vertical distribution.
Although transport of particulate matter and especially BC in mountainous regions has been studied in the past, e.g. in the Himalayas, Nepal (e.g.Bonasoni et al., 2010a,b), at Jungfraujoch, Switzerland (Liu et al., 2010), or Pico Espejo, Venezuela (Hamburger et al., 2013), there is currently still a rather incomplete picture about sources contributing to elevated BC concentrations in the free troposphere. This is especially valid for the Southern Hemisphere. Particulate biomass-burning emis-sions, including BC, in tropical regions of Africa, Asia, and South America can be transported into the free troposphere (e.g.Bourgeois et al., 2015; Dong and Fu, 2015) through different processes. In
mountainous regions, however, orography and specific local processes play an important role. Mountain valley breezes transport air masses up and down following terrain slopes. During daytime, they can transport pollutants from the boundary layer into the lower free troposphere, if the mountain ridge has a sufficient elevation (Lu and Turco, 1994). This process is also called the Mountain Chimney Effect. In this context, large metropolitan areas located at high altitudes are of special interest. Latin American major cities such as Bogota (capital of Colombia; 2640 m a.s.l.; approximately 6.7 million of inhabitants), Quito (capital of Ecuador; 2850 m a.s.l.; approximately 1.6 million of inhabitants) and La Paz (seat of government of Bolivia; ∼3200–4000 m a.s.l., approxi-mately 1.7 million of inhabitants together with El Alto) are fast growing sources of air pollution. With respect to regional topography, emissions are likely to be transported to even higher altitudes through local thermal convection and the mountain chimney effect (Chen et al., 2009). Generally, data on aerosol particle mass concentrations, and especially on BC, is rather scarce for the Southern Hemisphere, espe-cially for high altitudes. Presently, only few observatories such as at Chacaltaya in Bolivia (http://www.chacaltaya.edu.bo/) and Tololo in Chile (https://www.psi.ch/catcos/tll-last-24h) are available to follow trends of BC at high altitudes.
In the present case study, we attempted to answer the following scientific questions: 1) What is the major contributor of BC in the me-tropolitan area of La Paz/El Alto? 2) What is the fate of pollutants emitted within the urban area? 3) What is the mechanisms by which they are lifted into the lower free troposphere?
To investigate these questions, we used an intensive study in the metropolitan area of La Paz/El Alto conducted from September to
Fig. 1. Google Earth®satellite images of the sampling sites for this investigation. i) The Global Atmosphere Watch Station Chacaltaya. ii) The Meteorological station
at El Alto International Airport. This station was used as background site of El Alto/Altiplano in terms of aerosol particle concentrations. iii) The Planetarium of the University. This location was used to perform the road site measurements at the city center of La Paz. iv) The LFA (Laboratory for Atmospheric Physics) of the Universidad Mayor San Andres. Relative distances among the sites as well as their altitudes above sea level are also displayed.
December 2012 together with continuous observations at the Global Atmosphere Watch Chacaltaya (CHC) Observatory.
2. Experimental set-up 2.1. Observational sites 2.1.1. Intensive study sites
For the intensive aerosol study, we established two observational sites within the urban area of La Paz/El Alto. Those sites are com-plementing the long-term GAW measurements installed at CHC and at the Cota-Cota University Mayor de San Andrés Campus in La Paz. A general overview of the metropolitan area of El Alto and La Paz is shown inFig. 1. A list of the measurements and instruments at all sites is given inTable 1:
2.1.1.1. El Alto/Altiplano background site. The aim was to study aerosol properties of the urban and Altiplano background. The instruments were set up at the meteorological station of El Alto International Airport (Aeropuerto Internacional El Alto) located at 4040 m a.s.l. at the edge of the Altiplano plateau. This airport can clearly be seen in the middle of the settlements of El Alto. Distance from the El Alto International Airport meteorological station to the Planetarium site in La Paz is approximately 7.5 km, although their altitudes differ by approximately 450 m, with the Planetarium being lower.
A closer view on the El Alto International Airport is shown in
Fig. 2a. The distances from the meteorological station to the city edges are approximately 820, 600 and 590 m to the North, North-west, and South, respectively. The runway of the airport is about 330 m away from the meteorological station. It should be noted that airport traffic is low and we have not detected significant spikes in the signal at the meteorological station, corresponding to aircrafts landings or taking offs. The El Alto airport site is representative for urban Altiplano background conditions. The atmospheric aerosol was sampled through a PM10aerosol inlet at a height of approximately 8 m above the ground
and about 1 m above the roof of the meteorological station.
2.1.1.2. La Paz road site. In contrast to El Alto site, the observations at the road site aimed on understand the influence of traffic on BC loadings and particle number size distribution (PNSD). The La Paz road site measurements were performed at the Planetarium of the University Mayor de San Andrés in the city center of La Paz at 3590 m a.s.l. The Planetarium sampling site, shown inFig. 2b, is located in a complex urban development structure. The measurements were acquired at a distance of approximately 5 m horizontally from the street “Federico Zuazo”, at a height of 4 m at the 2nd floor of the building. This road is one of the busiest in the city with mainly vans used for public transportation and passenger cars, while trucks or big
buses are in the minority. As we will show later, the entire metropolitan area of La Paz/El Alto is generally dominated by heavy traffic including trucks and old buses, many of them using diesel as fuel, and a large fleet of minivans running on natural gas. Similarly to El Alto site, aerosol was sampled through a PM10inlet.
2.1.2. Continuous observational sites
2.1.2.1. GAW Chacaltaya Observatory (CHC). The Chacaltaya Observatory belongs to the GAW (Global Atmosphere Watch) network of the WMO (World Meteorological Organization) and has been in operation since December, 2011 (Andrade et al., 2015). The observatory (16.3505 S, 68.1314 W, 5240 m a.s.l.) is located about 140 m below the peak of Mount Chacaltaya. Due to complex terrain, the observations at CHC are influenced by air masses from several directions, including the Altiplano highlands (high plateau at around 3800 m a.s.l.; in a Northwest to West direction from Chacaltaya), the Lowlands (200–400 m a.s.l; Northeast to East), and the metropolitan area of La Paz/El Alto (South). The distance from El Alto Airport to CHC is approximately 19 km, while the distance to the Planetarium site is approximately 17 km (seeFig. 1).
2.1.2.2. Cota Cota. The Laboratory for Atmospheric Physics (LFA is the acronym of the Spanish name) is located at the University campus in the Cota-Cota neighborhood of La Paz, southeast of the city center and at an altitude of 3420 m a.s.l. (seeFig. 1). A backscatter lidar system is operated at Cota-Cota on a weekly schedule as a part of the LaLiNet network (Antuna-Marrero et al., 2017). Additional measurements are carried out during special events. A CIMEL sunphotometer, part of the AERONET network (Holben et al., 1998) and a Brewer spectrophotometer as well as UVB pyranometers are located on the roof of the Edificio Facultativo. Although the distance between CotaCota and city center is only 8 km, due to the topography of the region, the air masses arriving to Cota Cota are often decoupled from air masses passing through the city center.
2.2. Aerosol measurements
The instrumental set-up for the long-term aerosol measurements performed at the Chacaltaya Observatory (http://www.chacaltaya.edu. bo/instruments–data.html) was already described in detail inRose et al. (2015) and Rose et al. (2017), including measurements of sub-micrometer PNSD and equivalent BC (eBC) mass concentrations. In following sections, a description of measurements at El Alto and La Paz road site is presented.
2.2.1. Particle number size distribution
A Mobility Particle Size Spectrometer (MPSS - TROPOS-type;
Wiedensohler et al., 2012) was deployed to determine the PNSD in the
Table 1
Instruments and measurement variables at the different observational sites (La Paz, El Alto, Chacaltaya, and Cota Cota) used in this investigation.
Site Instrument Instrument Variable Particle Size Range
La Paz
Mobility Particle Size Spectrometer TROPOS-type MPSS Particle number size distribution 10–800 nm Absorption Photometer Multi-Angle Absorption Photometer Equivalent black carbon mass concentration PM10 CO Monitor Horiba APMA
−370 Carbon monoxide concentration –
El Alto Mobility Particle Size Spectrometer TROPOS-type Particle number size distribution 10–800 nm
Absorption Photometer Multi-Angle Absortion Photometer Equivalent black carbon mass concentration PM10
Chacaltaya
Mobility Particle Size Spectrometer TROPOS-type MPSS Particle number size distribution 10–800 nm Absorption Photometer Multi-Angle Absortion Photometer Equivalent black carbon mass concentration PM10 CO Monitor Horiba APMA
−370 Carbon monoxide concentration –
Cota Cota Elastic lidar LFA-UMSA-NASA/GSFC-type backscatter &
size range from about 10 to 500 nm at CHC and 10–800 nm at the La Paz and El Alto sites. The time resolution was 5 min. These instruments consist of a bipolar diffusion charger, a Differential Mobility Analyzer (DMA; Hauke-type, 28 cm effective length) and a Condensation Particle counter (CPC, TSI-model 3772). The data inversion code byPfeifer et al. (2014) was employed to calculate the PNSD from the raw electrical mobility distribution using the bipolar charge distribution of
Wiedensohler (1988). Corrections for diffusion losses were done, fol-lowing the method of the equivalent length described inWiedensohler et al. (2012). Particle size calibrations were performed weekly, using a latex particle standard with a certified size of 203 nm as described in
Wiedensohler et al. (2018). The aerosol inlet and CPC flow rates were also checked weekly. All PNSDs have been converted to STP conditions (standard temperature and pressure; 0 °C and 1013 hPa).
2.2.2. Mass concentration of equivalent black carbon
A Multi-Angle Absorption Photometer (MAAP - Thermo-Scientific model 5012; Petzold and Schönlinner, 2004) determines the particle light absorption coefficient with a time resolution of 1 min. Aerosol particles are collected on a filter, and the light absorption coefficient is determined by radiative transfer considerations, including effects of multiple scattering and absorption enhancement due to the reflection at two angles from the filter. The determination of the particle light ab-sorption coefficient is based on the transmitted and reflected phase functions, which are defined by directly measured values of the light transmission, as well as direct and diffuse backscattering. The particle eBC mass concentration is internally calculated, using a constant Mass Absorption Cross-Section (MAC) of 6.6 m2/g. The inlet flow rate of the
MAAP was checked weekly for ambient conditions. All particle mass concentrations of eBC are given for STP conditions (0 °C and 1013 hPa). 2.3. Additional measurements
2.3.1. Carbon monoxide
Carbon monoxide (CO) was measured by a Horiba APMA-370 in-strument, using a non-dispersive infrared absorptiometry (NDIR) tech-nique. Here, an infrared beam passes through the sample in the mea-surement cell. The energy absorbed by the detector displaces the membrane in the cell. This displacement is converted into an electrical signal. Data were obtained with a time resolution of 1 s and have been averaged to 1 min values.
2.3.2. Meteorological data
Meteorological data were obtained from instruments at the El Alto meteorological station at the airport with a time resolution of 1 min. A much simpler Davis automatic weather station (AWS) was set up in parallel at the same locations where the aerosol instrumentation was deployed. In the case of the Planetarium, the representativeness of meteorological data is more limited not only for having a simple AWS,
but also due to the location of the instrumentation in the middle of the built-up area where buildings are channeling the airflow and con-tributing to local heat island with respect to temperatures.
2.3.3. Lidar
An elastic lidar system, developed at the LFA-UMSA in collaboration with NASA/GSFC, functions with a single channel configured for the emission of a Nd: YAG laser (QUANTEL - BRIO) emitting in the second harmonic (532 nm). The maximum energy emitted per pulse at 532 nm is 80 mJ. The system has a Newtonian telescope, whose primary mirror has a diameter of 250 mm and a focal length of 700 mm. A diaphragm of 0.8 mm in diameter, located at the focal plane of the primary mirror of the telescope, determines a field of view of 0.6 mrad. The back-scattered light is focused on the photocathode of a Hamamatsu H6573 photomultiplier (PMT) using two plano-convex lenses with a focal length of 50 mm and an interference filter with a central wavelength of (532 ± 0.6) nm and a FWHM of (3 ± 0.6) nm. The signal generated by the PMT is acquired by a Tektronix TDS350 oscilloscope via the GPIB port of the oscilloscope and a PCI-GPIB card in a Windows com-puter. A subsequent analysis of the data gathered by the system allows the estimation of the backscatter and extinction coefficients as functions of height and time using the standardKlett (1981)algorithm. In addi-tion, the height of the boundary layer is obtained using the wavelet covariance transform technique (Brooks, 2003).
3. Variability of black carbon in La Paz/El Alto and source identification
3.1. Variability of BC at the road site
The eBC mass concentration shows a clear weekly and diurnal cycles (Fig. 3, blue curve), which reflects the traffic intensity (Fig. 3, red curve). The eBC mass concentrations vary between 1 μg*m−3during
nighttime and up to 23 μg*m−3during daytime. The lowest eBC mass
concentrations were observed on Sundays, with concentrations of about a factor of two lower compared to weekdays (Monday through Friday). Mass concentrations of eBC are higher on Saturdays than on Sundays, but lower compared to the other weekdays. The traffic frequency (number of cars in 5 min interval,Fig. 3) has been measured at a later period than the BC, but the results are representative also for the si-tuation during the intensive field study. A dominant contribution of the traffic to the eBC mass concentration is shown by a close covariance to the traffic density.
3.2. Observations during the Day of Census at road site
The Bolivian Day of Census on November 21, 2012, gave us the unique opportunity to perform an unplanned experiment. During the Day of Census, all people were required to stay at their homes in order
Fig. 2. Sampling sites for the La Paz/El Alto intensive aerosol study (September–December 2012). (a) The meteorological station is located within of El Alto International Airport and b) the Planetarium of the University is located in the city center of La Paz. Images were also obtained from Google Earth®.
to be counted. Private or business-related traffic was prohibited for 24 h. Only emergency and activities related to the census itself were allowed. Although nighttime minimum temperatures were around freezing during the campaign (especially in El Alto), almost no domestic heating was practiced in the urban area at that time (austral spring). Exceptions were heating systems at hospitals and a few other places, where it is mainly electricity-based. Cooking is based dominantly on use of liquefied natural gas. We can thus safely assume that during the Day of Census, eBC mass concentrations and CO concentrations represented regional background conditions.
The results of this unplanned experiment during the Bolivian Day of Census are plotted inFig. 4. The weekly and diurnal variation of the carbon monoxide and eBC mass concentrations are shown inFig. 4a and b, respectively. As expected, both concentrations vary according to the traffic intensity in the beginning of the week. On November 21, the CO concentration, however, dropped drastically within a few hours to va-lues near zero due to the traffic ban, and rose quickly to normal vava-lues on November 22, 2012 and the following days. Values of the eBC mass concentration were observed to be less than 1 μg*m−3during the Day
of Census, while during rest of the week the concentrations peaked around 10–20 μg*m−3. To illustrate further these unique results, the
weekly and diurnal variation of the PNSD is plotted as a contour plot in
Fig. 4c. There is a clear reduction of the particle number concentration on the Day of Census across the entire submicrometer PNSD range. For curiosity, the weekly variations of the CO concentration (blue) and eBC mass concentration (black) of at CHC are shown inFig. 4d, showing no signal of anthropogenic influence during the Day of Census.
To further investigate the effect of the traffic ban on the PNSD at the road site in La Paz and at Chacaltaya station, we averaged the values from November 20 and 22, 2012 and compared those to the average values for November 21, 2012 (Fig. 5a and c). The averaged PNSDs of November 20 and 22, 2012 are plotted in blue, while the average of the Day of Census is shown in red. InFig. 5b and d, the differences between the PNSDs are shown (black dot). At a first glance, these PNSDs do not differ much to the averaged ones of November 20 and 22, 2012. The ratios of the averaged PNSDs of the Day of Census to the ones of No-vember 20 and 22, 2012 are also plotted inFig. 5b and d (red triangles). The remaining fraction over the whole particle size range was in the range from 5 to 25% and 25–50% at the road site in La Paz and Cha-caltaya, respectively. The most pronounced decrease is in the particle size range between 20 nm and 200 nm, which is the typical particle size range for traffic-related aerosol particles. The accumulation mode
aerosol larger than 200 nm have shown the smallest reduction. This can be likely linked to the regional background, which was not immediately influenced by the Day of Census. The observations during Day of Census are an unambiguous proof that traffic is the dominant source of BC and other combustion-related particles in the metropolitan area of La Paz.
Fig. 3. Weekly and diurnal variation of the near-road particle mass con-centration of equivalent BC measured at the Planetarium of the University in the city center of La Paz (blue) were taken in November 2012. The frequency of the car traffic (red) in vehicles per 5 min in the same street was determined at the beginning of December 2012. The particle mass concentration of equivalent BC (blue) is given for STP conditions (0 °C and 1013 hPa). (For interpretation of the references to colour in this figure legend, the reader is referred to the Web version of this article.)
Fig. 4. Weekly and diurnal variation of a) carbon monoxide concentration, b) particle mass concentration of eBC, and c) PNSD (contour plot) at the University near-road sampling site, and d) carbon monoxide concentration and eBC mass concentration at Chacaltaya, during the week of the Day of Census (November 18–24, 2012). The Bolivian Day of Census was conducted on Wednesday, November 21, 2012.
3.3. Comparison of the La Paz road to El Alto/Alti Plano background sites In previous the sections, we have shown that traffic is the dom-inating source of the particle number concentration and the particulate mass concentration in the urban environment of La Paz. Here, we will explore the influence of the urban air pollution on regional scale of the Altiplano. We calculated particle number concentrations from the PNSDs (Fig. 6a) and submicrometer particle mass concentrations (Fig. 6b) for the La Paz road and El Alto urban background site for the corresponding intensive measurement periods. We compared these parameters with corresponding eBC mass concentrations (Fig. 6c). Particle number concentrations reached values up to 60,000 cm−3and
40,000 m−3at the road site during weekdays and weekends,
respec-tively. For the El Alto background site, these values are lower, below 10,000 cm−3for both, weekdays and weekends. The variability is less
pronounced. The submicrometer particle mass concentrations (calcu-lated from the PNSD) can reach up to values around 100 μg m−3and
40 μg m−3at the La Paz road site and El Alto background sites during
weekdays, respectively. The corresponding weekend values are up to 60 μg m−3 and 35 μg m−3, respectively. Compared to the
sub-micrometer particle mass concentration at the La Paz and El Alto sites, the eBC values seems to be generally lower by a factor of approximately 8. Considering that the remaining particle mass fraction during the Day
of Census is approximately 20% (also estimated from the PNSD), the traffic-related particle mass fraction of other material beside BC is significant. We can only assume at this stage, but it probably consists to large degree of organic carbon compounds. The eBC mass concentration correlates with the submicrometer particle mass concentration. This is valid especially at the La Paz road site. Less clear covariance at El Alto background site still reflects the traffic-related emissions during traffic peak time, however, also other processes seems to play a role. Further studies might be needed in future to better understand differences in the diurnal behavior of the eBC mass concentration and PNSD at urban and urban background sites in an environment heavily dominated by traffic related emissions.
4. Transport of BC to chacaltaya
4.1. Origin of air masses at Chacaltaya station
Expanding the focus from the urban to the regional scale, our aim was to look at transport of anthropogenic urban emissions from La Paz/ El Alto metropolitan are to CHC station. The Weather Research and Forecasting (WRF) model was used to calculate air mass back trajec-tories. Due to complex terrain, the model was nested four times in order to reach 1-km horizontal resolution near CHC station. The original
Fig. 5. Averaged PNSD for the weekdays November 20 and 22, 2012 (blue) and for the Day of Census on November 21, 2012 (red) are plotted for the La Paz road site (a) and Chacaltaya (c), respectively. The difference of the PNSDs (black) between regular conditions (the days before and after the census) and the special case (Day of Census) and the ratios (red) of the PNSD of Day of census to the PNSDS of the days before and afterwards are shown for the La Paz road site (b) and Chacaltaya (d), respectively. (For interpretation of the references to colour in this figure legend, the reader is referred to the Web version of this article.)
resolutions began at 38 km. ERA-Interim reanalysis (Dee et al., 2011) was used as boundary and initial conditions for the original large do-main. With increased resolution, the model domain decreased accord-ingly and it was 75 × 75 km at 1 km resolution. The model output was then converted and imported to HYSPLIT model (Stein et al., 2015) for air mass back trajectory calculations and analysis. Four hours air mass back trajectories were classified on a grid of 10 × 10 km.Fig. 7shows air mass trajectories density map for years 2012–2014 period. The scale is from low (blue) to high (red) frequency occurrence. The predominant transport pathways of ten correspond to canyons and valleys among the different mountain chains in the region. Air masses reaching the CHC Observatory are classified to three major groups: arriving from the highlands, the lowlands, and the metropolitan area of La Paz/El Alto, respectively.
The frequency occurrence of these three major groups of air mass
origin during 2012–2014 period is plotted inFig. 8. The share of air masses arriving Chacaltaya directly from the metropolitan area La Laz/ El Alto is about 10–15% during all seasons.
4.2. Observations of black Carbon at Chacaltaya (2012–2014)
In the first step, we analyzed the long-term eBC mass concentrations at the Chacaltaya Observatory, looking at the period 2012–2014. The mean weekly variation of the measured eBC for the period (Fig. 9), while the gray shaded area corresponds to one standard deviation. The weekly variation indicates two main features. First, there are repeating steep increases of eBC mass concentrations before noon occurring all days of the week. Second, the weekly variation shows the lowest noon peak in eBC mass concentration on Sundays and maximum daily values during weekdays with higher values at the second part of the week (Thursdays to Saturdays). There is also a regular pattern in the ob-servations from the Planetarium and El Alto sites but with peaks asso-ciated to the morning and evening rush hours. The first one 2 h before of the peak observed at Chacaltaya indicating strong influence of an-thropogenic air pollution at CHC, and the second peak around 6 h after noon when subsidence due to cooling of the atmosphere prevents pol-luted air masses to reach CHC.
In the second step, we determined the mean weekly variation of the eBC mass concentration, distinguishing the three air mass categories (Fig. 10). Air masses arriving from the lowlands (Fig. 10a) and high-lands (Fig. 10b) show in average weaker weekly variation and the lower noon peak of the eBC mass concentrations than the air mass passing through the metropolitan area. The highest eBC mass concentrations with the largest diurnal amplitude occur for cases of direct transport from the metropolitan area of La Paz/El Alto (Fig. 10c). Interestingly, the Sunday noon peak of the eBC mass concentration is lowest for all three air mass origin categories. This implies that transport up to the higher altitudes is more complex than simple boundary layer growth or chimney effects. One could thus assume that the Altiplano residual layer may act as a buffer, influencing the measurement at Chacaltaya with some delay. A summary for all three major source regions is shown inFig. 10d.
5. Impact of La Paz/El Alto on black carbon mass concentrations at chacaltaya
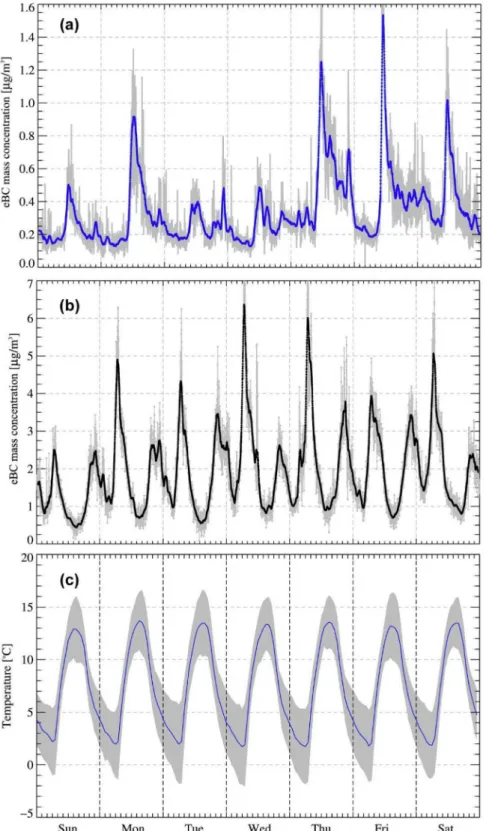
The aerosol observations at both, CHC and the meteorological sta-tion of the El Alto airport, were used to better understand the diurnal behavior of the Altiplano boundary layer in terms of dilution and ac-cumulation of BC. Comparison of the diurnal variation of the eBC mass concentration at CHC and El Alto airport shows clear opposite trends, especially during daytime (Fig. 11a and b). The late night-early morning period, coinciding with morning traffic rush hours, shows the lowest concentrations at CHC, and in contrast, the highest concentra-tions at the El Alto airport. Before noon, the pattern changes and while the eBC mass concentration at El Alto decreases, a sharp increase is clearly visible at the CHC observatory. This repeating trend has a very plausible explanation in the boundary layer height diurnal cycle. During nighttime and early morning, anthropogenic emissions are trapped within a shallow nocturnal boundary layer over the Altiplano. Later during the daytime, thermal convection and dilution due to an increasing boundary layer depth are likely the major process behind decreasing eBC mass concentrations. At the same time, heating of the Altiplano surface and mountain slopes increase the thermal upslope winds, enhancing the transport of polluted air to CHC. Diurnal variation of the air temperature (Fig. 11c) measured at the meteorological station of the El Alto International airport supports this interpretation. The evening rush hour peak of the eBC mass concentration that occurs in El Alto has then only limited influence on CHC, because the boundary layer top slowly descends as the temperature drops with less available solar radiation.
Fig. 6. Averaged diurnal variation of the particle number concentration (a), calculated particle mass concentration (b), and eBC mass concentration (c) for the La Paz (solid lines) and El Alto sites (open symbols) and for workdays (black) and weekends (blue). (For interpretation of the references to colour in this figure legend, the reader is referred to the Web version of this article.)
Co-located Lidar measurements with aerosol measurements will be ideal to support the link between diurnal boundary layer height evo-lution and transport of particulate matter from the Altiplano to higher elevations. For the period of the intensive campaign in 2012, lidar observations were performed occasionally at the Cota Cota University
Fig. 7. Density map of all points corresponding to 4-h backtrajectories distributed in a grid with resolution of 10 × 10 km2. Three major pathways arriving to
Chacaltaya can be observed: from Northwest to West (Highlands) Northeast to east (Lowlands), and south (metropolitan area of El Alto and La Paz).
Fig. 8. Frequency of the air mass categories Highlands (Blue), Lowlands (red), and Metropolitan La Paz/El Alto (black) for the years 2012–2014. (For inter-pretation of the references to colour in this figure legend, the reader is referred to the Web version of this article.)
Fig. 9. Mean weekly variation of equivalent BC at the Chacaltaya Observatory for the period 2012–2014.
Campus (16°32′17.02″S, 68° 4′11.56″W, 3400 m a.s.l.) at around 14 km east from the airport. These measurements provide only a snapshot of the diurnal boundary development in La Paz/El Alto region. Fig. 12
shows an example of the boundary layer development determined by the lidar for September 14, 2012. Since there are no lidar measurements available for the week, when the Day of Census took place, we have chosen 14 September, 2012, as it is a good example of typical diurnal
boundary layer evolution. The top of the boundary layer (marked by black dots) was derived using the backscatter normalized signal and an adapted version of the Haar wavelet method (Brooks, 2003). The boundary layer depth increased from around 10:00 a.m. local time. Shortly before noon, this increase accelerates towards its maximum in early afternoon. Around 15:30, a decrease of the boundary layer began and continued until 18:00 when measurements stopped. The white
Fig. 10. Weekly variation of equivalent BC at the Chacaltaya Observatory for the air masses a) Highlands, b) Lowlands, and c) the metropolitan area of La Paz/El Alto for the period 2012–2014. Dark lines are running averages and gray shadow regions show the variability expressed as one standard deviation. Box-Whiskers-Plots (d) of the three air mass categories.
region inFig. 12corresponds to the period when the sun is at its highest angle, contaminating the signal from the lidar in its acquisition system. The corresponding altitude of CHC station is indicated by a black horizontal line. The lower panel inFig. 12shows corresponding eBC mass concentrations at El Alto airport site and at CHC observatory. The gray shaded area corresponds to the period of the lidar observations.
6. Conclusions
The Bolivian Day of Census in November 2012 and its 24-h traffic ban was a unique opportunity to answer the following scientific ques-tions. a) What is the major contributor of BC in the metropolitan area of La Paz/El Alto, b) what is the fate of these pollutants emitted within the urban area, and c) what are the mechanisms by which they are lifted into the lower free troposphere?
Fig. 11. Averaged weekly variation of a) the particle mass concentration of eBC at Chacaltaya Observatory for the time period of El Alto intensive aerosol study, b) of the particle mass concentration of eBC at the El Alto site, and c) the temperature at the El Alto site.
Traffic-related emissions are strongly influenced by inefficient combustion related to high altitude, complex topography and an old passenger car, as well as light and heavy-duty vehicles. We studied therefore the influence of traffic on anthropogenic emissions and air quality in the metropolitan area of La Paz/El Alto located at an altitude between 3400 and 4100 m a.s.l. We analyzed the observations of par-ticle number size distribution (PNSD) and equivalent black carbon (eBC) mass concentrations from high altitude urban environment. The results showed that eBC mass concentrations up to 20 μg m−3are
fre-quently observed on hourly basis. Measurements performed during the Bolivian Day of Census on 21 November 2012 showed unequivocally that road traffic is a major source of the carbon monoxide concentra-tion, the eBC mass concentraconcentra-tion, the particle number concentraconcentra-tion, and the submicrometer particle mass concentration. The eBC mass concentrations at the road site decreased from typical levels of 10–20 μg m−3at weekdays to values below 1 μg m−3during the Day of
Census. Particle number concentrations decreased by a factor of 5–25 over the particle size range from 10 to 800 nm, while the sub-micrometer particle mass concentration dropped by approximately 80%.
The diurnal cycle of eBC mass concentrations at El Alto urban and Altiplano background sites showed repeating patterns with intense peaks corresponding to morning and late afternoon rush hours, while
concentrations can fall to less than 1 μg m−3in between at El Alto. The
diurnal cycle of the eBC mass concentration measured at the Global Atmosphere Watch Observatory Chacaltaya is generally anti-correlated with that observed at the urban and Altiplano background site of El Alto. These results indicate that anthropogenic emissions of the me-tropolitan area are transported during daytime to higher altitudes with the growing depth of the boundary layer over the Altiplano. This transport seems to be modified by orographic-driven flows due to mountain slope heating and local and regional scale topography-driven circulations. However, the exact transport mechanisms are rather complex and cannot be entirely explained by observations only. Mitigation of traffic-related particulate matter, especially BC, should be therefore of a high priority to decrease the transport to the tropical lower free troposphere, from where BC can be transported over long distances and exert impact on climate and composition of remote southern hemisphere.
Acknowledgements
This campaign was supported by UMSA, La Paz, Bolivia, through the Institute for Physics Research. Our appreciation goes to the Planetarium of UMSA for their help and understanding during the campaign.
We would also gratefully acknowledge the collaboration of the
Fig. 12. Boundary Layer development over the me-tropolitan region of La Paz as determined by lidar ob-servations on September 14, 2012 (upper panel), per-formed at the Department of Physics, UMSA in Cota-Cota at 3400 m a.s.l. and approximately 14 km from the El Alto site in a straight line. The top of the boundary layer is shown by the black dots after a wavelet tech-nique was applied to the data. The region in white roughly corresponds to a period of the day when the signal-to-noise is too low due to sunlight contamination into the lidar telescope. Mass concentration of eBC at Chacaltaya and at the El Alto background site are shown in the ower panel for September 14, 2012.
airport administration of El Alto, Bolivia, (AASANA - Administración de Aeropuertos y Servicios Auxiliares a la Navegación Aérea) for their help during the campaign and for hosting our instruments and allowing the LFA personnel to access their infrastructure.
Back trajectory analysis was possible due to the help of Dr. Ariel Stein at National Oceanic and Atmospheric Administration (NOAA), USA.
This work was also accomplished in the frame of the project ACTRIS-2 (Aerosols, Clouds, and Trace gases Research InfraStructure) under the European Union – Research Infrastructure Action in the frame of the H2020 program for “Integrating and opening existing national and regional research infrastructures of European interest” under Grant Agreement N°654109.
We also acknowledge the WCCAP (World Calibration Center for Aerosol Physics) as part of the WMO-GAW programme. The WCCAP is base-funded by the German Federal Environmental Agency (Umweltbundesamt), Germany.
Furthermore, the measurements have been supported by IRD, France, (Institut de Recherche pour le Développement) under the Jeune Equipe program CHARME awarded to LFA and by Labex OSUG@2020 (Investissements d'avenir – ANR10 LABX56).
The FORMAS and STINT, Sweden, funding agencies supported the Swedish participation in this study.
References
Andrade, M., Zaratti, F., Forno, R., Gutierrez, R., Moreno, I., Velarde, F., Avila, F., Roca, M., Sanches, M.F., Laj, P., Jafferezo, J.L., Ginot, P., Sellegri, K., Ramonet, M., Laurent, O., Weinhold, K., Wiedensohler, A., Krejci, R., Bonasoni, P., Cristofanelli, P., Whiteman, D., Vimeux, F., Dommergue, A., Magand, O., 2015. Puesta en Marcha de Una Nueva Estacion de Monitoreo Climatico en los Andes Centrales de Bolivia: La Estacion GAW/Chacaltaya Set to Work of of a New Climate Monitoring Station in the Central Andes of Bolivia: the GAW/Chacaltaya Station. Revista Boliviana de Fisica 25, 6–15.
Antuna-Marrero, J.C., Landulfo, E., Estevan, R., Barja, B., Robock, A., Wolfram, E., Ristori, P., Clemesha, B., Zaratti, F., Forno, R., Armandillo, E., Bastidas, A.E., Baraja, A.M.D., Whiteman, D.N., Quel, E., Barbosa, H.M.J., Lopes, F., Montilla-Rosero, E., Guerrero-Rascado, J.L., 2017. LALINET the first Latin american-born regional at-mospheric observational network. Bull. Am. Meteorol. Soc. 98 (6), 1255–1275.
Bonasoni, P., Laj, P., Marinoni, A., Sprenger, M., Angelini, F., Arduini, J., Bonafe, U., Calzolari, F., Colombo, T., Decesari, S., Di Biagio, C., di Sarra, A.G., Evangelisti, F., Duchi, R., Facchini, M.C., Fuzzi, S., Gobbi, G.P., Maione, M., Panday, A., Roccato, F., Sellegri, K., Venzac, H., Verza, G.P., Villani, P., Vuillermoz, E., Cristofanelli, P., 2010a. Atmospheric Brown Clouds in the Himalayas: first two years of continuous observations at the Nepal Climate Observatory-Pyramid (5079 m). Atmos. Chem. Phys. 10 (15), 7515–7531.
Bonasoni, P., Laj, P., Marinoni, A., Sprenger, M., Angelini, F., Arduini, J., Bonafe, U., Calzolari, F., Colombo, T., Decesari, S., Di Biagio, C., di Sarra, A.G., Evangelisti, F., Duchi, R., Facchini, M.C., Fuzzi, S., Gobbi, G.P., Maione, M., Panday, A., Roccato, F., Sellegri, K., Venzac, H., Verza, G.P., Villani, P., Vuillermoz, E., Cristofanelli, P., 2010b. Atmospheric Brown Clouds in the Himalayas: first two years of continuous observations at the Nepal Climate Observatory-Pyramid (5079 m). Atmos. Chem. Phys. 10, 7515–7531.https://doi.org/10.5194/acp-10-7515-2010.
Bond, T.C., Doherty, S.J., Fahey, D.W., Forster, P.M., Berntsen, T., DeAngelo, B.J., Flanner, M.G., Ghan, S., Karcher, B., Koch, D., Kinne, S., Kondo, Y., Quinn, P.K., Sarofim, M.C., Schultz, M.G., Schulz, M., Venkataraman, C., Zhang, H., Zhang, S., Bellouin, N., Guttikunda, S.K., Hopke, P.K., Jacobson, M.Z., Kaiser, J.W., Klimont, Z., Lohmann, U., Schwarz, J.P., Shindell, D., Storelvmo, T., Warren, S.G., Zender, C.S., 2013. Bounding the role of black carbon in the climate system: a scientific assess-ment. J. Geophys. Res.-Atmos. 118 (11), 5380–5552.
Brooks, I.A., 2003. Finding boundary layer top: application of a wavelet covariance transform to lidar backscatter profiles. J. Atmos. Ocean. Technol. 20, 1092–1105. Bourgeois, Q., Ekman, A.M.L., Krejci, R., 2015. Aerosol transport over the andes from the
amazon basin to the remote pacific ocean: a multiyear caliop assessment. J. Geophys. Res. Atmos. 120.https://doi.org/10.1002/2015JD023254.
Chen, Y., Zhao, C., Zhang, Q., Deng, Z., Huang, M., Ma, X., 2009. Aircraft study of mountain chimney effect of beijing, China. J. Geophys. Res. 114, D08306.https:// doi.org/10.1029/2008JD010610.
Dee, D.P., Uppala, S.M., Simmons, A.J., Berrisford, P., Poli, P., Kobayashi, S., Andrae, U., Balmaseda, M.A., Balsamo, G., Bauer, P., Bechtold, P., Beljaars, A.C.M., van de Berg, L., Bidlot, J., Bormann, N., Delsol, C., Dragani, R., Fuentes, M., Geer, A.J., Haimberger, L., Healy, S.B., Hersbach, H., Holm, E.V., Isaksen, L., Kallberg, P., Kohler, M., Matricardi, M., McNally, A.P., Monge-Sanz, B.M., Morcrette, J.J., Park, B.K., Peubey, C., de Rosnay, P., Tavolato, C., Thepaut, J.N., Vitart, F., 2011. The ERA-Interim reanalysis: configuration and performance of the data assimilation system. Q. J. R. Meteorol. Soc. 137 (656), 553–597.
Dong, X., Fu, J., 2015. Understanding interannual variations of biomass burning from Peninsular Southeast Asia, part II: variability and different influences in lower and higher atmosphere levels. Atmos. Environ. 115, 9–18.
Hamburger, T., Matisans, M., Tunved, P., Strom, J., Calderon, S., Hoffmann, P., Hochschild, G., Gross, J., Schmeissner, T., Wiedensohler, A., Krejci, R., 2013. Long-term in situ observations of biomass burning aerosol at a high altitude station in Venezuela - sources, impacts and interannual variability. Atmos. Chem. Phys. 13 (19), 9837–9853.
Holben, B.N., Eck, T.F., Slutsker, I., Tanre, D., Buis, J.P., Setzer, A., Vermote, E., Reagan, J.A., Kaufman, Y.J., Nakajima, T., Lavenu, F., Jankowiak, I., Smirnov, A., 1998. AERONET- A federated instrument network and data archive for aero-solcharacterization. Remote Sens. Environ. 66, 1–16.
Klett, J.D., 1981. Stable analytical inversion solution for processing lidar returns. Appl. Optic. 20 (2), 211–220.
Liu, D., Flynn, M., Gysel, M., Targino, A., Crawford, I., Bower, K., Choularton, T., Juranyi, Z., Steinbacher, M., Huglin, C., Curtius, J., Kampus, M., Petzold, A., Weingartner, E., Baltensperger, U., Coe, H., 2010. Single particle characterization of black carbon aerosols at a tropospheric alpine site in Switzerland. Atmos. Chem. Phys. 10 (15), 7389–7407.
Lu, R., Turco, R.P., 1994. Air pollutant transport in a coastal environment.part I: two-dimensional simulations of the sea-breeze and mountain effects. J. Atmos. Sci. 51, 2285–2308.
Petzold, A., Schönlinner, M., 2004. The Multi-angle absorption photometer – a new method for the measurement of aerosol light absorption and atmospheric BC. J. Aerosol Sci. 35, 421–441.
Pfeifer, S., Birmili, W., Schladitz, A., Müller, T., Nowak, A., Wiedensohler, A., 2014. A fast and easy-to-implement inversion algorithm for mobility particle size spectrometers considering particle number size distribution information outside of the detection range. Atmos. Meas. Tech. 7, 95–105.
Rose, C., Sellegri, K., Velarde, F., Moreno, I., Ramonet, M., Weinhold, K., Krejci, R., Ginot, P., Andrade, M., Wiedensohler, A., Laj, P., 2015. Frequent nucleation events at the high altitude station of Chacaltaya (5240 m a.s.l.), Bolivia. Atmos. Environ. 102, 18–29.
Rose, C., Sellegri, K., Moreno, I., Velarde, F., Ramonet, M., Weinhold, K., Krejci, R., Andrade, M., Wiedensohler, A., Ginot, P., Laj, P., 2017. New Particle Formation and impact on CCN concentrations in the boundary layer and free troposphere at the high altitude station of Chacaltaya (5240 m a.s.l.), Bolivia. Atmos. Chem. Phys. 17, 1529–1541.
Stein, A.F., Draxler, R.R., Rolph, G.D., Stunder, B.J.B., Cohen, M.D., Ngan, F., 2015. NOAA'S HYSPLIT atmospheric transport and dispersion modeling system. Bull. Am. Meteorol. Soc. 96, 2059–2077.
Wiedensohler, A., 1988. An approximation of the bipolar charge distribution for particles in the submicron size range. J. Aerosol Sci. 19, 387–389.
Wiedensohler, A., Birmili, W., Nowak, A., Sonntag, A., Weinhold, K., Merkel, M., Wehner, B., Tuch, T., Pfeifer, S., Fiebig, M., Fjäraa, A.M., Asmi, E., Sellegri, K., Venzac, H., Villani, P., Laj, P., Aalto, P., Ogren, J.A., Swietlicki, E., Roldin, P., Williams, P., Quincey, P., Hüglin, C., Fierz-Schmidhauser, R., Gysel, M., Weingartner, E., Riccobono, F., Santos, S., Grüning, C., Faloon, K., Beddows, D., Harrison, R., Monahan, C., Jennings, S.G., O'Dowd, C.D., Marioni, A., Horn, H.-G., Keck, L., Jiang, J., Scheckman, J., McMurry, P.H., Deng, Z., Zhao, C.S., Moerman, M., Henzing, B., Leeuw, G. d., Löschau, G., Bastian, S., 2012. Mobility particle size spectrometers: harmonization of technical standards and data structure to facilitate high quality long-term observations of atmospheric particle number size distributions. Atmos. Meas. Tech. 5, 657–685.
Wiedensohler, A., Wiesner, A., Weinhold, K., Birmili, W., Hermann, M., Merkel, M., Müller, T., Pfeifer, S., Schmidt, A., Tuch, T., Velarde, F., Quincey, P., Seeger, S., Nowak, A., 2018. Mobility particle size spectrometers: calibration procedures and measurement uncertainties. Aerosol Sci. Technol. 52 (2), 146–164.