© The Author 2013. Published by Oxford University Press.
This is an Open Access article distributed under the terms of the Creative Commons Attribution Non-Commercial License (http://
creativecommons.org/licenses/by-nc/3.0/), which permits unrestricted non-commercial use, distribution, and reproduction in any medium, provided the original work is properly cited.
Weaker Ligands Can Dominate an Odor Blend due to Syntopic Interactions
Daniel Münch
1, Benjamin Schmeichel
1, Ana F. Silbering
2and C. Giovanni Galizia
11
Neurobiology, University of Konstanz, D-78457 Konstanz, Germany and
2Center for
Integrative Genomics, University of Lausanne, CH-1015 Lausanne, Switzerland
Correspondence to be sent to: Daniel Münch, Neurobiology, University of Konstanz, D-78457 Konstanz, Germany. e-mail: daniel. [email protected]
Accepted December 3, 2012
Abstract
Most odors in natural environments are mixtures of several compounds. Perceptually, these can blend into a new “perfume,” or some components may dominate as elements of the mixture. In order to understand such mixture interactions, it is neces-sary to study the events at the olfactory periphery, down to the level of single-odorant receptor cells. Does a strong ligand present at a low concentration outweigh the effect of weak ligands present at high concentrations? We used the fruit fly receptor dOr22a and a banana-like odor mixture as a model system. We show that an intermediate ligand at an intermediate concentration alone elicits the neuron’s blend response, despite the presence of both weaker ligands at higher concentration, and of better ligands at lower concentration in the mixture. Because all of these components, when given alone, elicited significant responses, this reveals specific mixture processing already at the periphery. By measuring complete dose–response curves we show that these mixture effects can be fully explained by a model of syntopic interaction at a single-receptor bind-ing site. Our data have important implications for how odor mixtures are processed in general, and what preprocessbind-ing occurs before the information reaches the brain.
Key words: Drosophila melanogaster, mixture interaction, mixture processing, olfaction, olfactory receptor neuron, Or22a
Introduction
Naturally occurring odors usually consist of tens or even hundreds of different components at varying concentrations (Knudsen et al. 1993). Depending on the olfactory recep-tor (OR) it expresses, an olfacrecep-tory receprecep-tor neuron (ORN) is able to respond to a large set of odorants (Hallem et al. 2004). Odor response profiles overlap, thereby leading to an ensemble of activated ORNs upon odorant presentation (de Bruyne et al. 2001; Hallem and Carlson 2006; Galizia et al. 2010). Because even a single ligand is able to elicit an ensemble response across ORNs, in a mixture, the ensemble responses of the different components overlap and generate a novel mixture activation pattern (Johnson et al. 2010). On a perceptional level, humans have difficulties to recognize individual components with increasing mixture complex-ity and instead perceive the stimulus as a new odor qualcomplex-ity (Jinks and Laing 2001). In other cases, honeybees have been shown to learn odor mixtures via selection of only a few key components (Reinhard et al. 2010). These, and similar, mix-ture effects are thought to derive from mixmix-ture interactions in odor coding. In the brain network, the overlapping input channels influence each other laterally via neural circuits,
resulting in mixture interactions (Silbering and Galizia 2007; Lei and Vickers 2008; Olsen and Wilson 2008; Root et al. 2008; Ignell et al. 2009). The presence of one compo-nent might for example suppress the response to the other (suppression or hypoadditivity) or enhance it (synergism;
Duchamp-Viret et al. 2003; Silbering and Galizia 2007;
Kuebler et al. 2011).
However, mixture interactions can also be found prior to any brain network at a single ORN level in the olfac-tory periphery (Cromarty and Derby 1998; Duchamp-Viret et al. 2003; Rospars et al. 2008; Hillier and Vickers 2011). Thus, these effects directly shape the sensory input the brain receives. Studying the mechanisms underlying mixture inter-actions in the periphery is therefore important to understand how natural odors are perceived.
Here, we measured odor-evoked calcium responses in the dendrites and somata of Drosophila ORNs. We used the well-characterized receptor dOR22a (Pelz et al. 2006;
Galizia et al. 2010), which responds strongly to banana extract (Hallem and Carlson 2006), and an artificial banana-like odor blend (Jordán et al. 2001), which allowed us to
dissect the contribution to the odor response of different components. As not only the quality of components but also their relative concentration is an important feature of a mixture, we used different concentrations and recorded full dose–response curves. We found that mixture responses are hypoadditive in dOR22a. Responses to odor-concentration series demonstrate that the observed hypoadditivity is likely due to syntopic interactions at a single-odorant receptor-binding site (Rospars et al. 2008). Thus, a relatively simple peripheral mechanism already explains a large part of mixture interactions that render odor mixtures unique and identifiable “perfumes.”
Materials and methods
We recorded odor-evoked responses in dOr22a ORNs using Ca2+ imaging. In each animal, up to 31 stimulus responses
were recorded aiming at 1) screening for responses toward 15 selected banana-scent components, 2) measuring mixture interactions, or 3) characterizing full dose–response curves. All measurements were performed at the same experimental setup using the same strain of flies. A total of 40 animals were used for this study.
Animals
Flies were kept at 25 °C in a 12/12 light/dark cycle. Animals were reared on standard medium (100 mL contain 2.2 g yeast, 11.8 g of sugar beet syrup, 0.9 g of agar, 5.5 g of cornmeal, 1 g of coarse cornmeal, and 0.5 mL of propionic acid). Female Drosophila melanogaster were used for experi-ments 1–3 weeks after eclosion. Flies were of genotype P[UAS:GCaMP];P[Gal4:dOr22a]/CyO, expressing the Ca2+
reporter G-CaMP 1.3 in dOr22a-bearing cells (crossed from wP[UAS:G-CaMP];CyO/Sp;+ flies provided by Jing Wang, University of California, San Diego, La Jolla,CA; Nakai et al. 2001; Wang et al. 2003).
Flies were mounted in custom-made holders, placed with their neck into a slit; the head was fixed to the holder with a drop of dental glue (Tetric EvoFlow, Ivoclar Vivadent, Ellwangen, Germany). A half electron microscopy grid was placed on top of the head, stabilizing the antenna by touch-ing the second but not the third antennal segment.
Odorant preparation
Odorants were purchased from Sigma–Aldrich in the high-est purity available (Table 1). Pure substances were diluted in 5 mL mineral oil (Sigma–Aldrich, Steinheim, Germany), dilutions ranged from 10−2 to 10−8. Odors were prepared in
20–mL headspace vials sealed with a Teflon septum (Axel Semrau, Germany).
Information and abbreviations for all odorants used are given in Table 1, the tested mixtures were MIX15 (all 15 com-ponents: 1-butanol [BO], 1-hexanol [HO], 2-pentanol [PO],
2-pentanone [PN], 3-hydroxy-2-butanon [BN], 3-methyl-1-butanol [MO], butyl acetate [BA], butyl butyrate [BB], E-2-hexenal [HE], ethyl butyrate [EB], hexanal [HL], hexyl acetate [HA], isoamyl butyrate [IAB], isobutyl acetate [IBA], and isopentyl acetate [IA]); MIX4 (IA, BA, EB, and PO); MIX3 (BA, EB, and PO); IA.BA (IA and BA); IA.EB (IA and EB); and IA.PO (IA and PO).
Odorant dilutions for the artificial banana blend and its components were prepared in order to match the concentra-tions appearing in natural banana fruit reported by Jordán et al. (2001). For producing the desired headspace con-centrations in ppm, the corresponding vol/vol dilutions in mineral oil were estimated using the published information about the relation of liquid- and vapor-phase concentra-tions of volatile compounds in mineral oil (Cometto-Muñiz et al. 2003) and interpolating based on available vapor-pressure information (Pelz 2005; Pelz et al. 2006).
For dose–response curves pure odorants were diluted in mineral oil in decadic steps from 10−2 to 10−8, headspace
concentrations in ppm were calculated as explained above. The ratios of the single components within the binary mixtures were 1:1 (vol/vol), which corresponds to the fol-lowing ppm ratios in the headspace: ratioPO/IA = 0.78 and
ratioEB/IA = 3.34.
Compound concentrations in all mixtures are the same as in single odors, for example, mixture AB contains A + B and not 0.5 A + 0.5 B.
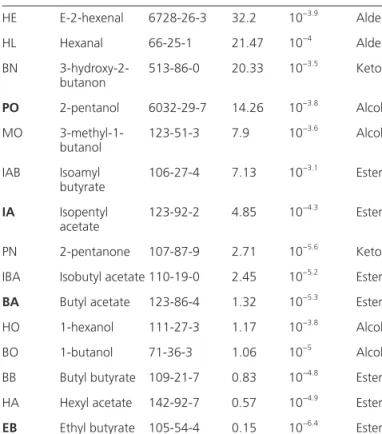
Table 1 Table of odorants and concentrations used in the experiments
together with their Chemical Abstracts Service (CAS) number and the abbreviated code used in the text
CODE Name CAS ppm Dilution Class
HE E-2-hexenal 6728-26-3 32.2 10−3.9 Aldehyde HL Hexanal 66-25-1 21.47 10−4 Aldehyde BN 3-hydroxy-2-butanon 513-86-0 20.33 10 −3.5 Ketone PO 2-pentanol 6032-29-7 14.26 10−3.8 Alcohol MO 3-methyl-1-butanol 123-51-3 7.9 10 −3.6 Alcohol IAB Isoamyl butyrate 106-27-4 7.13 10 −3.1 Ester IA Isopentyl acetate 123-92-2 4.85 10 −4.3 Ester PN 2-pentanone 107-87-9 2.71 10−5.6 Ketone IBA Isobutyl acetate 110-19-0 2.45 10−5.2 Ester
BA Butyl acetate 123-86-4 1.32 10−5.3 Ester HO 1-hexanol 111-27-3 1.17 10−3.8 Alcohol BO 1-butanol 71-36-3 1.06 10−5 Alcohol BB Butyl butyrate 109-21-7 0.83 10−4.8 Ester HA Hexyl acetate 142-92-7 0.57 10−4.9 Ester
EB Ethyl butyrate 105-54-4 0.15 10−6.4
Stimulus application
A computer-controlled autosampler (PAL, CTC Switzerland) was used for automatic odor application. A headspace of 2 mL was injected in two 1 mL portions at time points 6 s and 9 s with an injection speed of 1 mL∕s into a continuous flow of purified air flowing at 60 mL∕min. The stimulus was directed to the antenna of the animal via a Teflon tube (inner diameter 2 mm, and length 39.5 cm).
The interstimulus interval was approximately 2 min. Solvent control, room air control, and reference odorant were meas-ured after every 7 or 8 stimuli (1 block). The autosampler syringe was flushed with purified air for 30 s after each injec-tion. After each block of stimuli, the syringe was washed with hexane (Merck, Darmstadt, Germany), heated up to 48 °C, and rinsed with continuous clean air for 6 min. Gas chromatography
A gas chromatography–mass spectrometry system (GC– MS, Trace GC Ultra & DSQ II, Thermo Fisher Scientific, equipped with a 60 m × 0.25 mm forte bpx5 nonpolar cap-illary column, SGE International, Australia) was used to measure headspace concentrations of compounds in mix-tures and single compounds. Headspace of 1 mL was injected with an autosampler (PAL, CTC, Switzerland), the GC run started at 40 °C and increased 10 °C/min up to 250 °C. MS profile identification and GC peak measurement was per-formed in Xcalibur (Thermo Fisher Scientific).
Ca2+ imaging
Ca2+ imaging was performed with a fluorescence microscope
(BX51WI, Olympus, Tokyo, Japan) equipped with a ×50 air lens (Olympus LM Plan FI 50×/0.5). A CCD camera (TILL Imago, TILL Photonics, Gräfelfing, Germany) was mounted on the microscope recording with 8 × 8 pixel on-chip binning resulting in 80 × 60 pixel sized images. For each stimulus recordings of 20 s at a rate of 4 Hz were performed using TILLvisION (TILL Photonics, Gräfelfing, Germany).
A monochromator (Polychrome II, TILL Photonics, Gräfelfing, Germany) produced excitation light of 470 nm wavelength that was directed onto the antenna via a 500 nm low-pass filter and a 495 nm dichroic mirror, emission light was filtered through a 505 nm high-pass emission filter. Data analysis
Data were analyzed in custom written routines using IDL (ITT VIS), R (http://www.r-project.org), and LibreOffice (http://www.libreoffice.org). Statistics were done in SigmaStat (Systad Software).
Animals that showed stable responses to the reference odor (ethyl propionate) throughout the experiment were included into the analysis. Recorded movies were manually
corrected for movement artifacts, and an area of interest was defined for the parts of the antenna that showed fluorescence increase upon stimulation. All calculations were done within that area.
Relative fluorescence change was calculated as ΔF∕F = ((Fi
− F0)∕F0) × 100 with Fi being the fluorescence at framei
and F0 being the mean fluorescence of 19 frames before
stimulus onset.
We corrected for bleaching artifacts by fitting a logarith-mic function for frames 4–22 and 70–80 to the ΔF trace leav-ing out 12 s after stimulus onset and weightleav-ing frames 4–22, 3-fold compared with after-response end (see Silbering and Galizia 2007 for details).
The response amplitude was calculated as the average of 3 frames around the response maximum within 2 s after stimulus onset.
To compare across animals, responses were normalized as follows: within each animal response to solvent control was set to 0 and response to reference odor ethyl propionate was set to 1. Because responses decrease over time, all other responses were calculated by linear interpolation.
A Hill function as shown in Formula 1 was fitted to the concentration series of odors using the CURVEFIT func-tion in IDL (Sachse and Galizia 2003; Pelz et al. 2006). The obtained parameters of the single odor-concentration series (hill [slope], Rmax [maximum response], and EC50 [concen-tration eliciting the half maximal response]) were used to predict the mixture parameters according to Rospars et al. (2008). The Hill parameter (slope) was estimated from the best 2 fits within an animal.
R x x
x EC R
( )= .
+ ×
hill
hill 50hill max
(1) Response estimation
Two models for binary mixture response prediction were compared with our data. Tabor et al. (2004) used the meas-ured responses to the single and double concentration of the individual compounds to gather local information on their dose–response curves. The logic is that if a stimulus A elicits a response, adding molecules of B to it that are also excitatory should increase the response, if we assume that no interaction happens between the odorants. Mathematically, a mixture response can be estimated using a “linear interpo-lation” of this local dose–response data.
Rpred =max1x(R RA, B)+ ∆2x−1xRA×∆2x x−1 RB. (2) With Rpred, RA, and RB being the predicted response and the
responses toward odorant A and B, respectively. For the pur-pose of this study, we define a measured response that differs from this prediction as a mixture interaction.
Rospars et al. (2008) argue that if the 2 substances A and B interact with the same binding pocket of interaction site,
then the presence of molecules B in addition to A will fere with the response. In order to predict this syntopic inter-action mathematically, it is necessary to know the complete dose–response curve for both mixture components. The model then predicts the parameters EC50 and Rmax of the dose–response curves for the mixtures as:
EC EC EC EC EC A B B A 50 1 50 50 1 50 pred = +( r) n rn n + 50n . (3) R R r R r pred n n n n n n
max max EC max EC
EC EC A B B A A B = + + 50 50 50 50 . (4)
With r being the ratio of the 2 components, n being the Hill value, EC50 the dose that elicits the half maximal response, and Rmax the maximum response a ligand elicits. It is impor-tant to note that this model only works with concentrations measured as molecular concentrations in ppm and not for dilution units.
Results
Which odor component does dOr22a respond to when a banana-like mixture is presented?
The D. melanogaster olfactory receptor dOr22a is an espe-cially well-described receptor that is tuned to fruity odors and strongly activated by banana (de Bruyne et al. 2001;
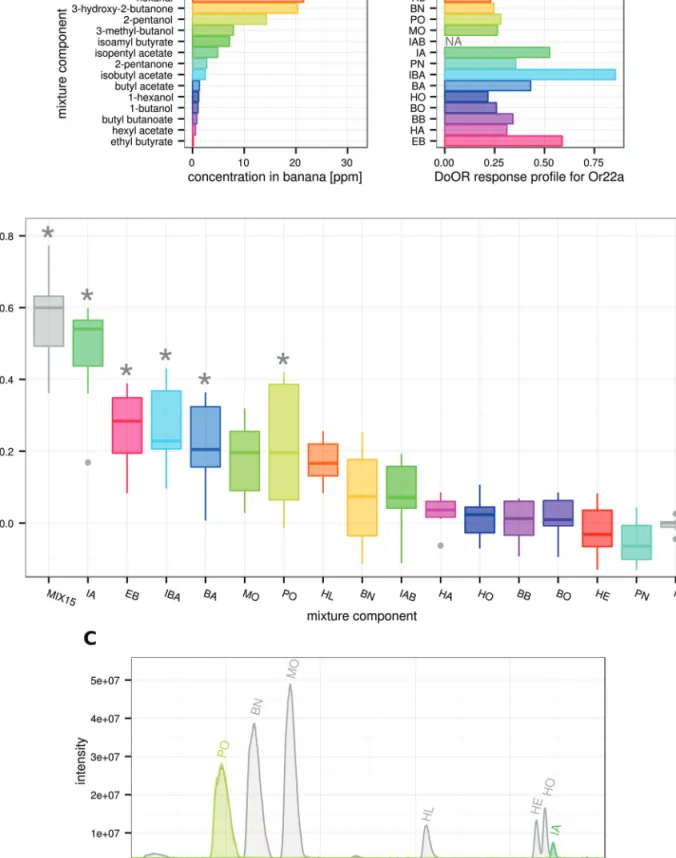
Dobritsa et al. 2003; Stensmyr et al. 2003; Hallem and Carlson 2006; Pelz et al. 2006). Interestingly, when com-paring the dOr22a response profile to the aromatic profile of banana fruit (Jordán et al. 2001), we recognized that the most abundant banana component HE is only a weak ligand, whereas the low concentrated EB strongly activates dOr22a (Figure 1A).
In order to analyze the role of single components in the banana blend response, we created an artificial banana mix-ture containing 15 prominent components from banana scent (MIX15). We used published data about the rela-tionship between liquid- and vapor-phase concentrations (Cometto-Muñiz et al. 2003) to prepare the single banana components and their mixture by diluting odorants in min-eral oil in a way that vapor-phase concentrations matched those of the aromatic banana profile reported by Jordán et al. (2001; Table 1).
We performed GC–MS analyses of MIX15 and the single components alone to exclude possible interactions at a chemical level that could prevent compounds from evaporation. For those peaks that were detectable, we could show that the GC–MS peak areas were the same whether diluted individually or in the mixture. Figure 1C shows the GC–MS measurement for the mixture overlaid with those of IA and PO alone (see online supplementary Figure S1 for comparison of all detected peaks).
dOr22a responds to many components in the mixture We performed Ca2+ imaging of sensory neuron dendrites
using the Ca2+ indicator G-CaMP (Nakai et al. 2001) in
dOr22a neurons. The mixture MIX15 and 5 of the 15 com-ponents elicited responses that were significantly different from the solvent control (mineral oil (MOL); Figure 1B). The artificial banana blend lead to the strongest activation followed by IA, EB, IBA, BA, and PO (Kruskal–Wallis,
P < 0.001; multiple comparisons vs. control group, Dunn’s
method, P < 0.05).
Mixture responses are hypoadditive
We compared the responses elicited by the 5 active compo-nents from above to those elicited by the complete 15-com-ponent mixture. The response of dOr22a toward IA alone was not different from the response elicited by the com-plete mixture that was very surprising as there were at least 4 other active compounds in the mixture (Kruskal– Wallis, P < 0.001; multiple comparisons vs. control group, Dunn’s method, P < 0.05). We therefore asked whether IA somehow suppresses the activity of the other mixture components.
Out of the effective banana components, we selected the 2 at lowest concentration (EB and BA) and the most abundant (PO) for the creation of binary mixtures with IA. We also composed 1 mixture containing all 3 components (MIX3) and 1 mixture containing the 3 components and IA (MIX4). Again we performed Ca2+ imaging of dOr22a ORNs on the
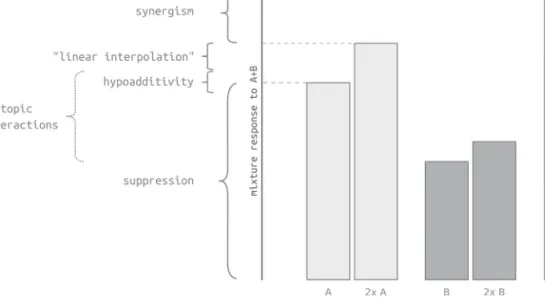
antenna of D. melanogaster with the odors at their natural banana blend concentration (Figure 2A). IA and MIX15 gave the same responses, and all the other responses of mix-tures containing IA as a component did not differ from IA alone. Interestingly the response elicited by MIX3 was almost as high as the response of the IA containing mixtures, pro-ducing a higher dOr22a response than its components alone. Responses to binary mixtures A.B can be grouped in 3 types: suppressive, when the mixture response is lower than the response toward the stronger component A; hypoadditive, when the mixture response is equal to the stronger component A; synergistic, when the mixture response is higher than the response to substance A at the mixture concentration [A+B] (Duchamp-Viret et al. 2003; Silbering and Galizia 2007;
Figure 3).
Assuming no interaction, responses to binary mixtures can be interpolated along the dose–response curves of the single components, sometimes misleadingly referred to as “linear summation”. This has been elaborated by Tabor et al. (2004)
who derived Formula 2 for an expected mixture response (see Materials and Methods).
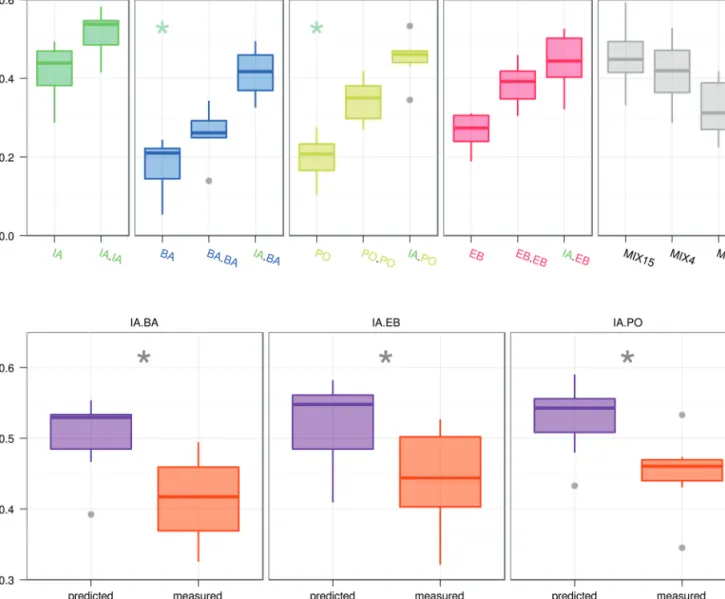
We predicted mixture responses for the 3 binary mixtures from measurements of the single and double concentra-tions of their components using Formula 2. We found the measured responses to be significantly lower than the pre-dictions in all cases (Figure 2B; Wilcoxon signed rank test,
Figure 1 Selected banana compounds tested on dOr22a. A Barplot on the left is showing the concentration in ppm of 15 compounds as they appear in
the aromatic profile of banana fruit (Jordán et al. 2001), barplot on the right is giving the corresponding response profile of dOr22a as in the DoOR database (Galizia et al. 2010). B Boxplot showing Ca2+ imaging data recorded on the antenna of Drosophila melanogaster, responses are normalized to ethyl propionate and shifted by mineral oil solvent (MOL) within each animal. Asterisks indicate significant responses compared with solvent MOL (Kruskal–Wallis/Dunn’s multi-ple comparisons vs. solvent group, P < 0.05, n = 8–9). Five of the components elicited a significant response when given alone. C Sammulti-ple GC traces for MIX15 (gray), PO and IA. Traces of mixture and single component overlap their respective peaks. For abbreviations and odor concentrations/dilutions see Table 1. Boxplot shows median, lower, and upper quartile, whiskers extend to lowest and highest value that lies within 1.5 times the interquartile range from the box.
P < 0.05). Thus, all responses to mixtures were hypoadditive.
Specifically, adding a component to IA as stimulus—even if a good ligand—did not contribute to the response.
Mixture components compete at receptor level
Given that the observed mixture interactions already occurred at receptor cell level, we further tested for syntopic interaction at the receptor-binding site. Syntopic interaction describes the competition of 2 ligands for binding to the same or at 2 overlapping binding sites on the same receptor (Neubig et al. 2003). The model from Rospars et al. (2008) assumes
a two-step mechanism of ligand binding and receptor acti-vation and predicts a mixture dose–response curve from the dose–response curves of its components (Formulas 3 and 4).
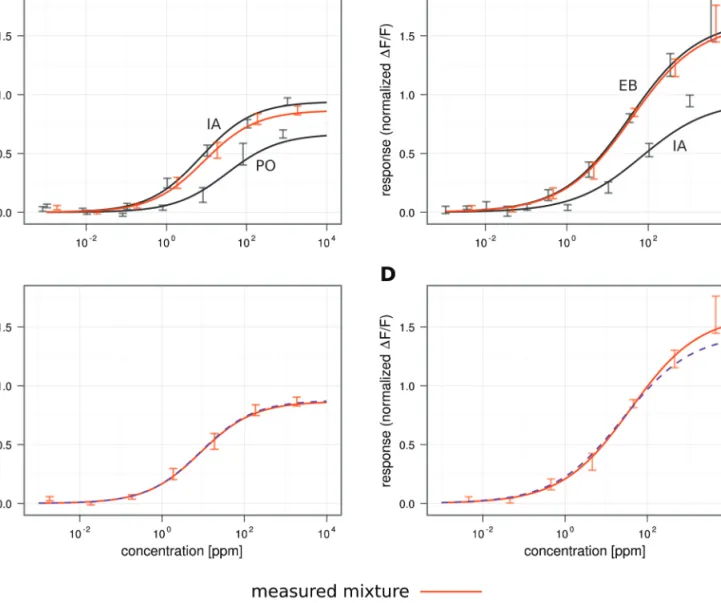
We measured dose–response curves for PO and EB (the highest and the lowest concentrated component of our arti-ficial banana blend), for IA and for their binary mixtures IA.PO and IA.EB. Pure odorants were diluted in mineral oil in decadic steps from 10−2 to 10−8, and a Hill function was
fitted to the data.
PO was a weaker ligand for dOr22a than IA, showing a lower efficiency (eliciting a lower maximum response, Rmax, 0.67 compared with 0.94) and a lower affinity (a higher EC50
Figure 2 Binary mixtures with IA. A Boxplot comparing mixture components in single concentration (concentration as from banana profile, left in each
panel), double concentration (second plot in each panel), the binary mixtures with IA (third plot in panels 2–4), and responses to different submixtures containing 15, 4, or 3 components (panel 5). No difference could be found between IA and the IA containing binary mixtures or between IA and the different multi component mixtures (MIX15: all 15 tested compounds; MIX4: IA, BA, EB and PO; MIX3: MIX4 without IA) (Kruskal–Wallis/Dunn’s multiple comparisons vs. control group, P < 0.001, n = 7). B Boxplot of responses to binary mixtures as predicted assuming no interactions (“linear interpolation”,
purple) and as measured (orange). Prediction and measurement was significantly different in all cases (Wilcoxon Signed Rank Test, P < 0.05, n = 7). Boxplots
show median, lower and upper quartile, whiskers extend to lowest and highest values that lie within 1.5 times the interquartile range from the box. This figure appears in color on the online version of this issue.
value, 32.73 ppm compared with 7.26 ppm; Figure 4A). The mixture of both in the ppm ratio measured here (ratioPO/IA =
0.78) followed the stronger component IA. EB on the other hand was a much stronger ligand for dOr22a than IA, show-ing a higher affinity (EC50 of 36.47 ppm compared with 67.92 ppm) and higher efficiency (Rmax of 1.63 compared with 0.95; Figure 4B). Their mixture IA.EB also followed the stronger ligand, EB in this case (ratioEB/IA = 3.34). Note
that IA EC50 and Rmax values differed slightly as the data were obtained in 2 different data sets in different seasons. We could not investigate this seasonal effect in this study.
The mixture dose–response curves in Figure 4A and B
are located between their component curves, indicating the presence of syntopic interaction. Using the model of syntopic interaction to derive a mixture dose–response curve from the component curves leads to a very accurate prediction of the actually measured mixture dose–response curves (IA.PO: predicted EC50: 8.59 ppm, measured EC50: 8.55 ppm, predicted Rmax: 0.88, measured Rmax: 0.87; IA.EB: predicted EC50: 25.28 ppm, measured EC50: 38.9 ppm, predicted Rmax: 1.44, measured Rmax: 1.6; Figures 4C and D). Thus mixture interactions in IA.PO and IA.EB are fully accounted for by the ligands competing for the same dOr22a receptor-binding site.
Syntopic interaction applies for natural concentration ratios
The prediction of the mixture dose–response curves in
Figure 4 is based on diluting the pure odorants in decadic
steps and mixing them 1:1 (vol/vol), which translates to ratios of ratioPO/IA = 0.78 and ratioEB/IA = 3.34, respectively,
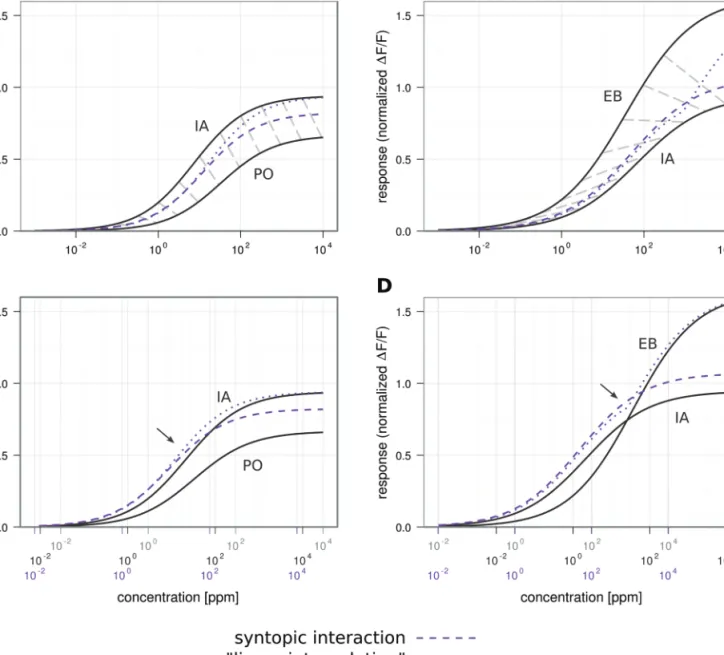
when transformed to ppm in headspace after Cometto-Muñiz et al. (2003). As we could show that our data can be described by the model of syntopic interaction, we cal-culated the mixture dose–response curves for the ratios in which the components occur in banana fruit (ratioPO/ IA = 2.94; ratioEB/IA = 0.031, Figure 5). With the
compo-nent dose–response curves we were also able to calculate a dose–response curve according to the “linear interpolation” model (Figure 5).
When calculating the syntopic interaction model using the natural banana fruit ratio of IA and PO, the mixture dose– response curve moved toward PO (its concentration in the mixture was much higher); however, it still remained closer to IA (dashed purple line in Figure 5A). The “linear inter-polation” model (dotted purple line in Figure 5A) and the syntopic interaction model gave the same curves at lower con-centrations; for higher concentrations, the interpolation model started deviating till it reached the same Rmax level as the stronger component, whereas syntopic interaction followed the measured curve.
Using EB at the low concentration present in banana, the mixture curve for the syntopic model followed the IA curve closely. Like the models for IA.PO, the 2 models for IA.EB looked the same at the lower concentrations, but in the higher concentrations, the “linear interpolation” model deviated toward the stronger component, leading to a kink in the IA.EB curve (Figure 5B), whereas syntopic interaction created a smooth sigmoidal curve.
Figure 3 Scheme of mixture interaction types. Note that different authors use different wording and ranges according to different interaction
mecha-nisms. A mixture response is termed suppressive when it is lower than the response toward the stronger component (A); hypoadditive, when the mixture response is equal to the stronger component (A); synergistic, when the mixture response is higher than the response to the stronger component A at the mixture concentration [A+B] (“2× A” in the figure because in this figure we consider the case of [A] = [B] for simplicity). “Linear interpolation” refers to the case where no interactions happen and the response can be calculated according to Formula 2. Syntopic interaction at the receptor level generally results in responses within the upper suppression range but cannot be calculated precisely without knowledge of the full dose–response curves (Formulas 3 and 4).
IA is the dominant banana-odor component for 22a
For IA and PO at the banana ratio, IA presented alone elic-ited the stronger responses from dOr22a across the whole concentration range (dashed gray lines in Figure 5A and B). For a better visualization we shifted the x axis in Figure 5C
and D in a way that corresponding component and mixture concentrations are aligned horizontally. When comparing IA with EB, IA would elicit the stronger responses only at lower concentrations but EB would overtake at some point, lead-ing to a kink in the “linear interpolation” model (Figures 5B
and D).
However, in the syntopic interaction model the mixture follows IA closely, preserving a stable dose–response curve across concentrations and accounting for IA as the domi-nant mixture component for both binary mixtures.
Discussion
Mixture interactions at the periphery of olfactory systems have been shown for many species. Suppressive effects (including hypoadditivity, see Figure 3) are observed more often than synergistic interactions (Cromarty and Derby 1998; Ochieng et al. 2002; Duchamp-Viret et al. 2003;
Rospars et al. 2008; Hillier and Vickers 2011; Su et al. 2012). Suppressive mixture effects are also observed perceptually, and some of these could be linked to ORN physiology (Bell et al. 1987; Brodin et al. 2009; Chaput et al. 2012). Some of these suppressive mixture effects may arise from agonists and antagonists competing for a common receptor-binding site (Araneda et al. 2000; Oka et al. 2004). Our data also show an example of likely agonist competition, resulting in suppressive effects for all 3 binary mixtures tested. These
Figure 4 Dose–response curves for the single odorants IA and PO or EB (dark gray), and the binary mixtures IA.PO (orange) and IA.EB (orange). A and B All
dose–response curves can be fitted by the Hill equation. C and D Overlay of the measured mixture responses (orange) and the modeled mixture following syntopic interaction (dashed purple; Rospars et al., 2008). The model is a good estimate of the data. Error bars indicate standard error mean; n = 7. This figure appears in color on the online version of this issue.
effects were fully explained by a model of syntopic interac-tion. Syntopic interaction describes the competition of 2 agonistic ligands for binding at a common or 2 overlapping receptor-binding sites (Neubig et al. 2003). Syntopic interac-tion leads to hypoadditivity or stronger suppressive effects at high concentration, whereas those competitive effects are absent at low concentrations with sufficient free binding sites where mixture responses match “linear interpolations” of their component responses (modeled responses in Figure 5).
The model for syntopic interaction is sufficient to explain the data that we measured. Nevertheless, this does not exclude that under other conditions, either for different
odors or other receptor cells, additional mechanisms of mixture interactions may occur. Such mechanisms could include multiple binding sites on 1 receptor, multiple sec-ond-messenger cascades, multiple receptors on 1 cell (e.g., the receptor cell studied here also expresses receptor dOr22b in addition to dOr22a although no active role for dOr22b has been shown yet), or interactions between neurons within 1 sensillum (e.g., ephaptic effects; Boekhoff et al. 1994;
Cromarty and Derby 1997; Dobritsa et al. 2003; Vermeulen and Rospars 2004; French et al. 2011; Su et al. 2012). Some receptor cells show inhibitory responses to some odorants (antagonistic ligands), in which cases mixture interactions
Figure 5 Mixture dose–response curves estimated for banana ratios. A and B Dark gray curves are the individual components IA and PO or EB, mixture
curves in purple show predictions for syntopic interaction (dashed; Rospars et al., 2008) and for “linear interpolation” (dotted; Tabor et al., 2004). Light
gray dashed lines in A and B connect corresponding points on the single compound curves according to their ratio in banana scent. C and D Data as in
A and B but shifted so that corresponding single concentrations in the “banana ratio” and the resulting mixture are aligned vertically. Note that “linear interpolation” leads to a “kink” in the predicted dose–response curve in B and D. Arrows indicate where syntopic interaction and linear interpolation start to diverge with increasing concentration. This figure appears in color on the online version of this issue.
need to be analyzed and modeled differently (Boekhoff et al. 1994; Kang and Caprio 1997; de Bruyne et al. 1999, 2001;
Duchamp-Viret et al. 2003; Schuckel et al. 2009; Turner and Ray 2009).
dOr22a has a broad response profile with strong responses to many fruity odors, increasing the likelihood that mixture interactions occur in a natural environment. In more selec-tive receptors, for example, dOr92a with 2,3-butanedione as dominant ligand (Galizia et al. 2010), syntopic interactions may not be relevant under natural conditions. However, even dOr92a has several weak ligands, so that this scenario needs to be tested specifically.
Syntopic interactions may also help the brain to create odor-concentration invariance. For example, a fruit fly that smells a banana should be able to identify this banana also when the scent gets stronger as it approaches the source. Odor-concentration invariance has been shown in behavior and physiology for different species and sequential ORN recruitment, and network effects in the brain are thought to underlie this capacity (Sachse and Galizia 2003; Uchida and Mainen 2007; Root et al. 2008; Asahina et al. 2009; Cleland et al. 2012). Generally, the dose–response curve to an odor follows a sigmoidal shape. However, in the absence of inter-actions, “linear interpolation” predicts that dose–response curves become less predictable because of the occurrence of “kinks” as in the calculated IA.EB mixture response curve (Figure 5). With syntopic interaction, however, responses to mixtures follow sigmoidal dose–response curves just as single compounds, so that the brain can use the same algo-rithms for concentration invariance for all odors, be they pure substances or mixtures.
Furthermore syntopic interaction helps to set the work-ing range of receptors. The swork-ingle receptor measured in this study is only a small part of the whole ensemble that consists of all the activated and nonactivated ORNs in response to an odor. In olfactory brain areas like the anten-nal lobe and the olfactory bulb, this ensemble response is shaped by a lateral network generating further mixture interactions (Giraudet et al. 2002; Sachse and Galizia 2002; Tabor et al. 2004; Silbering and Galizia 2007; Olsen and Wilson 2008; Root et al. 2008; Kuebler et al. 2011). If responses to mixture components would add up linearly (“linear interpolation”), many naturally occurring odors with tens or hundreds of components might quickly lead to saturated receptor cell output, thus reducing the cod-ing capacity of the system. Our data strengthen the view that when studying mixture processing in brain networks, syntopic interaction at the periphery needs to be taken into account, even in the absence of chemical or physiological interactions.
The majority of odors consist of many chemical substances that occur together. The scent of banana, for example, was reported to contain 152 components, and Jordán et al. (2001) identified 26 substances in the headspace of fresh fruit. Is any of these the “main component” of banana, or is banana only
created by the characteristic mixture? To humans, the most concentrated component in banana (HE) smells like green apple. Following the components in order of concentration, we have to reach IA (rank 7, Figure 1) to find a substance that by itself reminds us of banana, even though we are by no means anosmic to the higher ranked components (Jordán et al. 2001). Honeybees have been shown to learn mixtures
via the selection of a few key components rather than
learn-ing the full bouquet (Reinhard et al. 2010). Thus, at least in some cases, certain mixture components are more salient than others, which raises the question about the responsible mechanisms. Here we show a case study where an effect simi-lar to key component selection happens at receptor neuron level, by syntopic interaction. In this example, the Drosophila receptor dOr22a “perceives” the banana-like mixture and its intermediate component IA as being equal even though there are both better and more concentrated ligands in the mixture.
Supplementary material
Supplementary material can be found at http://www.chemse. oxfordjournals.org/
Funding
This work was supported by the German Research Council [GA524/7] and the German Ministry of Education and Research [01GQ0931].
Acknowledgments
We thank Sheree Pfeiffer for help with the measurements.
References
Araneda RC, Kini AD, Firestein S. 2000. The molecular receptive range of an odorant receptor. Nat Neurosci. 3(12):1248–1255.
Asahina K, Louis M, Piccinotti S, Vosshall LB. 2009. A circuit supporting concentration-invariant odor perception in Drosophila. J Biol. 8(1):9. Bell GA, Laing DG, Panhuber H. 1987. Odour mixture suppression:
evidence for a peripheral mechanism in human and rat. Brain Res. 426(1):8–18.
Boekhoff I, Michel WC, Breer H, Ache BW. 1994. Single odors differentially stimulate dual second messenger pathways in lobster olfactory receptor cells. J Neurosci. 14:3304–3309.
Brodin M, Laska M, Olsson MJ. 2009. Odor interaction between Bourgeonal and its antagonist undecanal. Chem Senses. 34(7):625–630.
Chaput MA, El Mountassir F, Atanasova B, Thomas-Danguin T, Le Bon AM, Perrut A, Ferry B, Duchamp-Viret P. 2012. Interactions of odorants with olfactory receptors and receptor neurons match the perceptual dynamics observed for woody and fruity odorant mixtures. Eur J Neurosci. 35(4):584–597. Cleland TA, Chen S-YT, Hozer KW, Ukatu HN, Wong KJ, Zheng F. 2012.
Sequential mechanisms underlying concentration invariance in biologi-cal olfaction. Front Neuroeng. 4:1–12.
Cometto-Muñiz JE, Cain WS, Abraham MH. 2003. Quantification of chemical vapors in chemosensory research. Chem Senses. 28(6):467–477.
Cromarty SI, Derby CD. 1997. Multiple excitatory receptor types on indi-vidual olfactory neurons: implications for coding of mixtures in the spiny lobster. J Comp Physiol A. 180(5):481–491.
Cromarty SI, Derby CD. 1998. Inhibitory receptor binding events among the components of complex mixtures contribute to mixture suppression in responses of olfactory receptor neurons of spiny lobsters. J Comp Physiol A. 183(6):699–707.
de Bruyne M, Clyne PJ, Carlson JR. 1999. Odor coding in a model olfactory organ: the Drosophila maxillary palp. J Neurosci. 19:4520–4532. de Bruyne M, Foster K, Carlson JR. 2001. Odor Coding in the Drosophila
Antenna. Neuron. 30:537–552.
Dobritsa AA, van der Goes van Naters W, Warr CG, Steinbrecht RA, Carlson JR. 2003. Integrating the molecular and cellular basis of odor coding in the Drosophila antenna. Neuron. 37(5):827–841.
Duchamp-Viret P, Duchamp A, Chaput MA. 2003. Single olfactory sensory neurons simultaneously integrate the components of an odour mixture. Eur J Neurosci. 18(10):2690–2696.
French AS, Torkkeli PH, Schuckel J. 2011. Dynamic characteriza-tion of Drosophila antennal olfactory neurons indicates multiple opponent signaling pathways in odor discrimination. J Neurosci. 31(3):861–869.
Galizia CG, Münch D, Strauch M, Nissler A, Ma S. 2010. Integrating hetero-geneous odor response data into a common response model: A DoOR to the complete olfactome. Chem Senses. 35(7):551–563.
Giraudet P, Berthommier F, Chaput M. 2002. Mitral cell temporal response patterns evoked by odor mixtures in the rat olfactory bulb. J Neurophysiol. 88(2):829–838.
Hallem EA, Carlson JR. 2006. Coding of odors by a receptor repertoire. Cell. 125(1):143–160.
Hallem EA, Ho MG, Carlson JR. 2004. The molecular basis of odor coding in the Drosophila antenna. Cell. 117(7):965–979.
Hillier NK, Vickers NJ. 2011. Mixture interactions in moth olfactory physi-ology: examining the effects of odorant mixture, concentration, dis-tal stimulation, and antennal nerve transection on sensillar responses. Chem Senses. 36(1):93–108.
Ignell R, Root CM, Birse RT, Wang JW, Nässel DR, Winther AM. 2009. Presynaptic peptidergic modulation of olfactory receptor neurons in Drosophila. Proc Natl Acad Sci USA. 106(31):13070–13075.
Jinks A, Laing DG. 2001. The analysis of odor mixtures by humans: evi-dence for a configurational process. Physiol Behav. 72(1-2):51–63. Johnson BA, Ong J, Leon M. 2010. Glomerular activity patterns evoked
by natural odor objects in the rat olfactory bulb are related to pat-terns evoked by major odorant components. J Comp Neurol. 518(9):1542–1555.
Jordán MJ, Tandon K, Shaw PE, Goodner KL. 2001. Aromatic profile of aqueous banana essence and banana fruit by gas chromatography-mass spectrometry (GC-MS) and gas chromatography-olfactometry (GC-O). J Agric Food Chem. 49(10):4813–4817.
Kang J, Caprio J. 1997. In vivo responses of single olfactory receptor neurons of channel catfish to binary mixtures of amino acids. J Neurophysiol. 77(1):1–8. Knudsen JT, Tollsten L, Bergström LG. 1993. Floral scents—a checklist of
volatile compounds isolated by head-space techniques. Phytochemistry. 33:253–280.
Kuebler LS, Olsson SB, Weniger R, Hansson BS. 2011. Neuronal processing of complex mixtures establishes a unique odor representation in the moth antennal lobe. Front Neural Circuits. 5:7.
Lei H, Vickers N. 2008. Central processing of natural odor mixtures in insects. J Chem Ecol. 34(7):915–927.
Nakai J, Ohkura M, Imoto K. 2001. A high signal-to-noise Ca(2+) probe composed of a single green fluorescent protein. Nat Biotechnol. 19(2):137–141.
Neubig RR, Spedding M, Kenakin T, Christopoulos A. 2003. International Union of Pharmacology Committee on Receptor Nomenclature and Drug Classification. XXXVIII. Update on terms and symbols in quantita-tive pharmacology. Pharmacol Rev. 55(4):597–606.
Ochieng SA, Park KC, Baker TC. 2002. Host plant volatiles synergize responses of sex pheromone-specific olfactory receptor neurons in male Helicoverpa zea. J Comp Physiol A Neuroethol Sens Neural Behav Physiol. 188(4):325–333.
Oka Y, Omura M, Kataoka H, Touhara K. 2004. Olfactory receptor antago-nism between odorants. EMBO J. 23(1):120–126.
Olsen SR, Wilson RI. 2008. Lateral presynaptic inhibition mediates gain con-trol in an olfactory circuit. Nature. 452(7190):956–960.
Pelz D. 2005. Functional Characterization of Drosophila melanogaster Olfactory Receptor Neurons. Freie Universität Berlin. http://www.diss. fu-berlin.de/diss/receive/FUDISS_thesis_000000001732.
Pelz D, Roeske T, Syed Z, de Bruyne M, Galizia CG. 2006. The molecu-lar receptive range of an olfactory receptor in vivo (Drosophila mela-nogaster Or22a). J Neurobiol. 66(14):1544–1563.
Reinhard J, Sinclair M, Srinivasan MV, Claudianos C. 2010. Honeybees learn odour mixtures via a selection of key odorants. PLoS ONE. 5(2):e9110.
Root CM, Masuyama K, Green DS, Enell LE, Nässel DR, Lee CH, Wang JW. 2008. A presynaptic gain control mechanism fine-tunes olfactory behavior. Neuron. 59(2):311–321.
Rospars JP, Lansky P, Chaput M, Duchamp-Viret P. 2008. Competitive and noncompetitive odorant interactions in the early neural coding of odor-ant mixtures. J Neurosci. 28(10):2659–2666.
Sachse S, Galizia CG. 2002. Role of inhibition for temporal and spatial odor representation in olfactory output neurons: a calcium imaging study. J Neurophysiol. 87(2):1106–1117.
Sachse S, Galizia CG. 2003. The coding of odour-intensity in the honeybee antennal lobe: local computation optimizes odour representation. Eur J Neurosci. 18(8):2119–2132.
Schuckel J, Torkkeli PH, French AS. 2009. Two interacting olfactory trans-duction mechanisms have linked polarities and dynamics in Drosophila melanogaster antennal basiconic sensilla neurons. J Neurophysiol. 102(1):214–223.
Silbering AF, Galizia CG. 2007. Processing of odor mixtures in the Drosophila antennal lobe reveals both global inhibition and glomerulus-specific interactions. J Neurosci. 27(44):11966–11977.
Stensmyr MC, Giordano E, Balloi A, Angioy AM, Hansson BS. 2003. Novel natural ligands for Drosophila olfactory receptor neurones. J Exp Biol. 206:715–724.
Su CY, Menuz K, Reisert J, Carlson JR. 2012. Non-synaptic inhibition between grouped neurons in an olfactory circuit. Nature. 492(7427):66–71. Tabor R, Yaksi E, Weislogel JM, Friedrich RW. 2004. Processing
of odor mixtures in the zebrafish olfactory bulb. J Neurosci. 24(29):6611–6620.
Turner SL, Ray A. 2009. Modification of CO2 avoidance behaviour in Drosophila by inhibitory odorants. Nature. 461(7261):277–281. Uchida N, Mainen ZF. 2007. Odor concentration invariance by chemical
ratio coding. Front Syst Neurosci. 1:3.
Vermeulen A, Rospars JP. 2004. Why are insect olfactory receptor neu-rons grouped into sensilla? The teachings of a model investigating the
effects of the electrical interaction between neurons on the transepithe-lial potential and the neuronal transmembrane potential. Eur Biophys J. 33(7):633–643.
Wang JW, Wong AM, Flores J, Vosshall LB, Axel R. 2003. Two-photon cal-cium imaging reveals an odor-evoked map of activity in the fly brain. Cell. 112(2):271–282.