HAL Id: hal-01447772
https://hal.archives-ouvertes.fr/hal-01447772
Submitted on 27 Jan 2017
HAL is a multi-disciplinary open access
archive for the deposit and dissemination of
sci-entific research documents, whether they are
pub-lished or not. The documents may come from
teaching and research institutions in France or
abroad, or from public or private research centers.
L’archive ouverte pluridisciplinaire HAL, est
destinée au dépôt et à la diffusion de documents
scientifiques de niveau recherche, publiés ou non,
émanant des établissements d’enseignement et de
recherche français ou étrangers, des laboratoires
publics ou privés.
Rapid Purification and High Sensitivity Analysis of
Heparan Sulfate from Cells and Tissues: TOWARD
GLYCOMICS PROFILING
Scott Guimond, Tania Puvirajesinghe, Mark Skidmore, Ina Kalus, Thomas
Dierks, Edwin Yates, Jeremy Turnbull
To cite this version:
Scott Guimond, Tania Puvirajesinghe, Mark Skidmore, Ina Kalus, Thomas Dierks, et al.. Rapid
Purification and High Sensitivity Analysis of Heparan Sulfate from Cells and Tissues: TOWARD
GLYCOMICS PROFILING. Journal of Biological Chemistry, American Society for Biochemistry and
Molecular Biology, 2009, 284 (38), pp.25714-25722. �10.1074/jbc.M109.032755�. �hal-01447772�
Rapid Purification and High Sensitivity Analysis of Heparan
Sulfate from Cells and Tissues
TOWARD GLYCOMICS PROFILING
*⽧Received for publication, June 11, 2009, and in revised form, July 6, 2009 Published, JBC Papers in Press, July 13, 2009, DOI 10.1074/jbc.M109.032755
Scott E. Guimond‡1, Tania M. Puvirajesinghe‡1, Mark A. Skidmore‡, Ina Kalus§, Thomas Dierks§, Edwin A. Yates‡, and Jeremy E. Turnbull‡2
From the‡Centre for Glycobiology, School of Biological Sciences, University of Liverpool, Liverpool L69 7ZB, United Kingdom and the§Department of Chemistry, Biochemistry I, Bielefeld University, 33615 Bielefeld, Germany
Studies on glycosaminoglycans and proteoglycans (PGs) have been hampered by difficulties in isolation and analysis by tradi-tional methods that are laborious and lack sensitivity and throughput. Here we demonstrate a simple method for rapid isolation of proteoglycans (RIP) employing phenol/guanidine/ chloroform reagent to purify heparan sulfate (HS) PGs quanti-tatively from various tissues and cells. We further show that this generic purification methodology, when applied in concert with a BODIPYTMfluorescent label, permits structural analyses on RIP-purified HS at⬃1,000-fold higher sensitivity than standard UV detection methods and ⬃10–100-fold higher sensitivity than previous fluorescence detection methods. The utility of RIP-BODIPY methodology was demonstrated by rapid profiling of HS structural composition from small tissue samples, multi-ple mouse organs, and as little as a few thousand cultured cells. It was also used to generate novel insights into in vivo structural changes in HS from Sulf1 knock-out mice for the first time that differed significantly from previous observations limited to tis-sue culture experiments. RIP was also applied to purify HS for bioassay testing, exemplified by cell assays of fibroblast growth factor signaling activation; this generated data from 2-O-sulfo-transferase knock-out mice and revealed an unexpected defi-ciency in fibroblast growth factor activation by HS from het-erozygous mice. These data demonstrate that RIP will underpin emerging efforts to develop glycomics profiling strategies for HS and other glycosaminoglycans to explore their structure-func-tion relastructure-func-tionships in complex biological systems.
Heparan sulfate (HS)3is a member of the glycosaminoglycan
(GAG) family of polysaccharides and is found on almost all cell types in metazoan organisms, attached to core proteins to form
specialized glycoproteins called proteoglcans (PGs). It is critical in many biological processes (including embryonic develop-ment, homeostasis, and wound healing), and lack of HS is lethal in higher organisms such as mice (1, 2). HS is also involved in a variety of disease processes (such as tumor angiogenesis, patho-gen adhesion, and neurodepatho-generation). It carries out these functions primarily by binding to many different proteins and regulating their functions (1, 3). Specific binding is in part determined by the variation in structure of the HS, primarily in the number and location of sulfate moieties (4, 5). There is now intense interest in identifying specific structural motifs within HS responsible for binding and regulation of particular proteins and in exploring the heparanome, the entire complements of HS structures expressed by cells and tissues (1, 3, 6).
The study of HS biochemistry and its interactions with pro-teins (3, 4) necessitates the ability to purify and analyze HS from tissues and cells. However, current methods of purification (such as detergent and guanidium salt extraction followed by protease digestion or chloroform/methanol extraction), although good at purifying HS in large amounts from single sources, suffer several drawbacks. They are lengthy and labori-ous (involving complex extraction processes and multiple col-umn chromatographic steps) and can also result in alteration of native structure, for example N-desulfation (7–10). To address these problems, our rationale was to devise a simple extraction and purification protocol that was both rapid and streamlined, minimizing transfers to reduce losses in yield and providing HS of sufficient purity for comparative structural and functional analysis. We observed that PGs partition exclusively in the aqueous phase in extractions performed with TRIzol威 (a well known phenol/guanidine/chloroform reagent that is widely used to purify DNA and RNA from tissues) (11). This observa-tion led us to develop a method for isolaobserva-tion of PGs, exemplified by HSPGs. Here we demonstrate a novel approach for the rapid isolation of proteoglycans (RIP) from most tissues and cell cul-ture samples that is quick (from cell/tissue sample to ion exchange purification in⬃30 min), reduces loss of material (only one transfer before ion exchange step), and is readily scal-able. Furthermore, when coupled to a recently developed method for highly sensitive fluorescent labeling of GAG sac-charides with BODIPYTMhydrazide (12), RIP allows the
struc-tural profiling and bioassay of HS from less than a milligram of starting tissue or a few thousand cells.
*This work was supported by grants from the Medical Research Council, UK
(Senior Research Fellowship to J. E. T. and Ph.D. funding to T. P.), the Wellcome Trust (to E. A. Y., M. A. S., S. E. G., and J. E. T.), and the Biotechnology and Biolog-ical Sciences Research Council (to E. A. Y., M. A. S., S. E. G., and J. E. T.).
⽧This article was selected as a Paper of the Week.
Author’s Choice—Final version full access.
1Both authors contributed equally to this work.
2To whom correspondence should be addressed: School of Biological
Sci-ences, University of Liverpool, Crown St., Liverpool L69 7ZB, UK. Tel.: 44-1517954427; E-mail: [email protected].
3The abbreviations used are: HS, heparan sulfate; PG, proteoglycan; HSPG,
hepa-ran sulfate proteoglycan; RIP, rapid isolation of proteoglycan; GAG, glycosam-inoglycan; Sulf, sulfatase; DMSO, dimethyl sulfoxide; HPLC, high pressure liq-uid chromatography; FGF, fibroblast growth factor; PBS, phosphate-buffered saline; 2OST, 2-O-sulfotransferase; UA, uronic acid; NS, N-sulfate.
THE JOURNAL OF BIOLOGICAL CHEMISTRY VOL. 284, NO. 38, pp. 25714 –25722, September 18, 2009
Author’s Choice © 2009 by The American Society for Biochemistry and Molecular Biology, Inc. Printed in the U.S.A.
by guest, on January 3, 2011
www.jbc.org
EXPERIMENTAL PROCEDURES
Materials—Chloroform, DNase I, RNase, neuraminidase, chondroitin ABC lyase, sodium hydroxide, sodium borohy-dride, sodium chloride, Tris acetate, sodium acetate, calcium acetate, PBS, 3-(4,5-dimethylthiazol-2-yl)-2,5-diphenyltetra-zolium bromide, SDS, and DMSO were purchased from Sigma-Aldrich (Dorset, UK). TRIzol, Dulbecco’s modified Eagle’s medium, RPMI 1640, fetal calf serum, L-glutamine, penicil-lin-G, streptomycin sulfate, and BODIPY were from Invitrogen (Paisley, UK). Recombinant murine interleukin-3 (IL-3) and recombinant human FGF-2 were from R&D Systems (Abing-don, UK); porcine intestinal mucosa heparin was from Celsus Laboratories; and DEAE-Sephacel and PD-10 columns were from GE Healthcare (Buckinghamshire, UK). Heparinases I, II, and III were from IBEX Technologies (Montreal, Canada); Pro-nase was from Roche Applied Science (Welwyn, UK); HPLC-grade water and methanol were from VWR International (Lut-terworth, UK); and unsaturated heparin disaccharide standards were from Dextra Laboratories (Reading, UK). BaF3 cells expressing FGFR1c were generously provided by David Ornitz (Washington University, St. Louis, MO).
Tissues—Organs from normal adult female CD1 mice were obtained from the University of Liverpool Animal House. Sulf1 knock-out mice were generated as described previously (13, 22). For cerebella preparation, heterozygous littermates were intercrossed, and after genotyping, cerebella were dissected from newborns at postnatal day 6. Mouse brains from mice wild type, heterozygous, or null for 2-O-sulfotransferase (14) were a gift from Dr. Val Wilson, Edinburgh.
3T3 Cell Culture—Murine Swiss 3T3 fibroblasts (ATCC number CCL-92) were maintained in Dulbecco’s modified Eagle’s medium supplemented with 10% fetal calf serum, 4 mM L-glutamine, 10 units/ml penicillin G, and 10g/ml
streptomy-cin sulfate. Cells were allowed to reach 10,000 cells/cm2 in
100-mm dishes, 25-mm dishes, and 24-well plates prior to extraction. Cell numbers were obtained by counting duplicate plates.
Extraction of HSPGs with TRIzol—The extraction of HSPGs is identical to the initial purification procedure for RNA. Briefly, wet tissue or cultured cells were homogenized in a tis-sue grinder or solubilized in the culture dish with 1 ml of TRIzol reagent/100 mg of tissue or 10-cm2culture dish. Samples were
then incubated for 5 min at room temperature and transferred to polypropylene tubes with the addition of 0.2 ml of chloro-form/1 ml of original TRIzol reagent used. Tubes were shaken vigorously for 15 s and incubated a further 3 min at room tem-perature. Samples were centrifuged at⬃8,000 ⫻ g for 15 min at 4 °C. HSPGs are present in the upper, aqueous phase (Fig. 1). The aqueous phase was applied to a 0.1–1 ml DEAE column (⬃0.1 ml of bed/ml sample) in a disposable mini-column. The column was washed with 10 volumes of PBS, pH 7.4 and 10 volumes of PBS (0.25MNaCl), pH 7.4 and eluted with 10
vol-umes of PBS (2MNaCl) pH 7.4. PBS (2MNaCl) fractions were
desalted on PD10 gel filtration columns and freeze dried (“crude” GAG fraction, see Fig. 1).
Additional HS Purification—Freeze-dried samples were reconstituted in 100l of HPLC-grade water and digested in a
single tube by sequential addition and incubation at 37 °C with 2.5 milliunits of chondroitin ABC lyase (in 500 mMTris acetate, pH 8.0; 4 h), 10 milliunits of neuraminidase (in 125 mMsodium
acetate, pH 5.0; 4 h), and 2 mg/ml Pronase (in 500 mMTris
acetate, 50 mMcalcium acetate; 16 h). Each enzyme and buffer (at 5⫻ final concentrations) were added at one-fifth volume at each step. The mixture was then subjected to DEAE chroma-tography and desalting as described above. Finally, the samples were applied to Millipore Biomax centrifuge filters (5,000 nom-inal molecular weight limit, Millipore, Watford, UK) and cen-trifuged for 5 min at 5,000 rpm. The retentate (50l) was brought to 500l with HPLC-grade H2O and reapplied to the
centrifuge filters. This process was repeated three times to ensure remove of salts and other low molecular weight contam-inants. The final retentate (purified GAG fraction, see Fig. 1) was stored at⫺20 °C until use.
Disaccharide Analysis with UV Detection—Samples in 100 mM sodium acetate, 0.1 mM calcium acetate, pH 7.0, were digested by sequential addition at 37 °C of 2.5 milliunits of heparinase I (4 h) followed by 2.5 milliunits of heparinase III (4 h) and finally with 2.5 milliunits of heparinase II (16 h). Samples were then applied to a Propac PA-1 strong-anion exchange col-umn (4.6⫻ 250 mm; Dionex, Leeds, UK) and eluted with a 0–1
MNaCl gradient over 45 min on a Dionex BioLC HPLC at a flow
rate of 1 ml/min. Disaccharides were identified with reference to authentic heparin unsaturated disaccharide standards.
Determination of HS Concentration—The amounts of HS present in samples was determined by digesting the purified HS to completion as described above for disaccharide analysis. The molar concentration of the disaccharides present in solution was determined at A232using the Beer-Lambert law with an
extinction coefficient of 5,500 mol⫺1cm⫺1for the unsaturated bond chromophore generated by heparinase enzymes.
BODIPY Hydrazide Labeling and HPLC Analysis with Fluo-rescence Detection—Disaccharides obtained as for UV detec-tion were labeled with BODIPY hydrazide, as described previ-ously (12). Briefly, lyophilized samples were suspended in BODIPY fluorescent label hydrazide (5 mg/ml in methanol;10 l). Methanol was removed by centrifugation under vacuum, and samples were resuspended in DMSO:ethanoic acid (17:3 v/v; 10l) prior to incubation for 4 h at room temperature in the dark. Labeled samples were reduced using sodium borohy-dride (1M, aqueous; 10l) and incubated for 30 min (room
temperature) prior to flash-freezing in liquid nitrogen and lyophilization. The fluorescently labeled disaccharides were resuspended in DMSO:H2O (50:50 v/v, 1 ml) prior to loading
onto a Propac PA-1 column as above, eluted using a linear gra-dient of 0 –1Msodium chloride (in 150 mMNaOH) over 30 min
at a flow rate of 2 ml/min on a Shimadzu HPLC system. Peaks were detected using inline fluorescence detection at excitation wavelength of ⫽ 488 nm and an emission wavelength of ⫽ 520 nm using a Shimadzu RF-551 detector. The column was reconditioned by washing with 2MNaCl (in 300 mMNaOH) before equilibrating in 150 mM NaOH. Previously calculated
correction factors were applied to quantitate the observed dis-accharides (12).
BaF3 Assay—BaF3 cells (naturally devoid of HS and FGF receptors) transfected with FGFR1c were maintained as
Rapid and Sensitive Profiling of Heparan Sulfate
by guest, on January 3, 2011
www.jbc.org
described previously (15). For proliferation assays, 10,000 cells/ well were plated on a 96-well plate with culture medium (100 l, RPMI 1640 supplemented with 10% fetal calf serum, 2 mM L-glutamine, 100 units/ml penicillin-G, and 100g/ml
strepto-mycin sulfate without IL-3) and were incubated with 2 ng/ml IL-3 or 1 nMFGF-2 with and without heparin/HS at the
con-centrations indicated. After 72 h at 37 °C, 250g/ml 3-(4,5-di-methylthiazol-2-yl)-2,5-diphenyltetrazolium bromide was added, and the cells were incubated a further 4 h at 37 °C. Fol-lowing solubilization in 10% SDS, 0.01NHCl, the plates were
read on a Multiscan EX spectrophotometric plate reader (Thermo Electron, Basingstoke, UK) at 570 nm. Increase in absorbance is proportional to cell number.
RESULTS
Rapid Method for HSPG Extraction and Purification—To streamline purification of HS from tissues and cell culture, we examined the benefits of a strategy exploiting phenol/guani-dine/chloroform reagent (e.g. the commercial reagent TRIzol) (Fig. 1). We observed that GAGs (including HS) appear exclu-sively in the aqueous layer after phase separation. Following this initial isolation step, the HS is subjected to routine anion exchange chromatography on a mini-column and desalted, resulting (typically after⬃2 h) in a crude GAG preparation that can be used for initial structural analysis (Fig. 1). Further puri-fication was achieved by sequential single-pot enzyme digestion and a second anion exchange/desalting procedure to remove unwanted GAGs and contaminating proteins. This results (after⬃24 h) in highly purified HS preparation suitable for detailed structural profiling and also bioassays (Fig. 1).
A systematic approach was adopted to determine the efficacy of the RIP method in terms of recoveries (spiking experiments with3H-labeled HSPGs) and maintenance of structural
integ-rity. We examined the efficacy of the RIP method of purifica-tion in terms of yields. Initially 3H-labeled syndecan-1 was
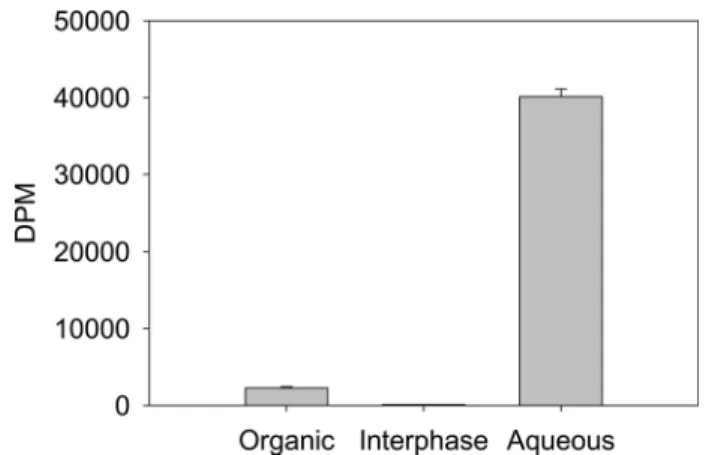
spiked into 100 mg of fresh mouse brain homogenate and HS purified by RIP. The amount of3H label in the organic phase, interphase, and aqueous phase of the TRIzol extract was deter-mined and showed that⬎95% of the spiked 3H-labeled HSPG was recovered in the aqueous phase (Fig. 2). Similar results were obtained by comparing yields of spiked samples from liver extracts (data not shown). It is well known that HS can be
N-desulfated when exposed to low pH conditions (7–10). Because TRIzol has a pH of around 4.0, it was necessary to determine whether HS underwent any desulfation during the RIP procedure. Heparin, a highly sulfated variant of HS, was used as a proxy molecule in these control experiments and was subjected to RIP purification followed by13C NMR analysis
(10). The resulting NMR spectra confirmed that the purified heparin was identical to parental (untreated) heparin (data not shown), confirming that the procedure does not structurally modify these polysaccharides.
Structural Profiling of HS from Tissues by Fluorescence Detection—We next exploited the RIP method by coupling it with a newly developed method for reducing end labeling of GAG saccharides with the fluorescent tag BODIPY hydrazide (12). With a detection limit of ⬃100 fmol, this provides a ⬎1,000-fold increase in sensitivity over the use of UV absorb-ance (A232, commonly used to detect the unsaturated
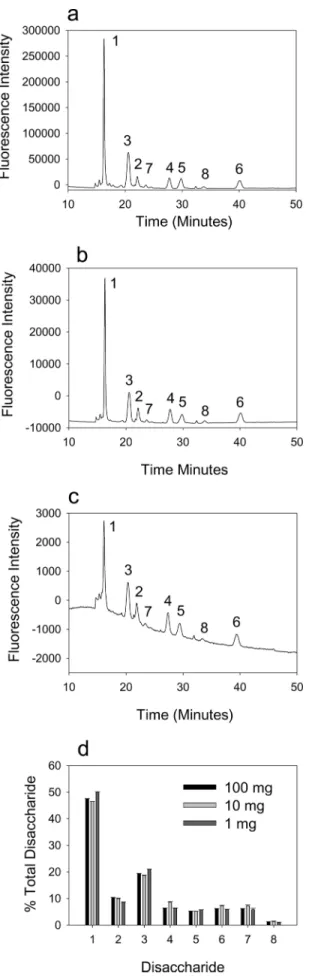
non-re-ducing end bond produced by the action of the heparin lyase enzymes (16)) and a 10 –100-fold increase in sensitivity over previous fluorescent labels (17–20). Fluorescence also has the advantage of minimizing background noise and non-glycan peaks, thus enhancing sensitivity. HS isolated from mouse kid-ney was subjected to exhaustive heparinase digestion, and the resulting disaccharides were labeled with BODIPY hydrazide and separated by high resolution strong anion exchange HPLC (Fig. 3a). The results show a typical chromatogram for HS, with a high proportion of unsulfated disaccharide (UA-GlcNAc) and smaller percentages of the other common disaccharides. Peaks eluting before 5 min represent free tag (Fig. 4); importantly, because no labeled saccharides co-elute with free tag, the sam-ples do not require cleanup to remove this before analysis, thus streamlining analysis.
FIGURE 1. RIP strategy for the isolation of HS from tissues and cells. Cells or animal tissues are subjected to homogenization in phenol/guanidine rea-gent, and PGs partition into the aqueous phase after chloroform addition.
This process is rapid (⬃20 min) when compared with traditional methods
(⬃48 h). PGs are then partially purified using DEAE ion exchange
chromatog-raphy and desalted, yielding crude GAG extract (⬃2–3 h) suitable for initial
structural analysis. Contaminating macromolecules are removed by single-pot sequential enzymatic digests, DEAE chromatography, desalting, and
fil-tration. This yields a highly purified GAG sample (⬃24 h) for use in bioassays
and structural profiling. FPLC, fast protein liquid chromatography.
FIGURE 2.3H-labeled proteoglycan partitions in the aqueous phase after
extraction in TRIzol.3H-labeled syndecan-1 was spiked into 100 mg of fresh mouse brain homogenate and extracted in TRIzol. The organic, interphase,
and aqueous phase were separated, and the amount of3H in each was
deter-mined using a Wallac WinSpectra 1414 liquid scintillation counter and Optiphase HiSafe 3 scintillant (PerkinElmer Life Sciences, Beaconsfield, UK).
Data are expressed as the DPM in each phase (mean⫾ S.D., n ⫽ 3).
by guest, on January 3, 2011
www.jbc.org
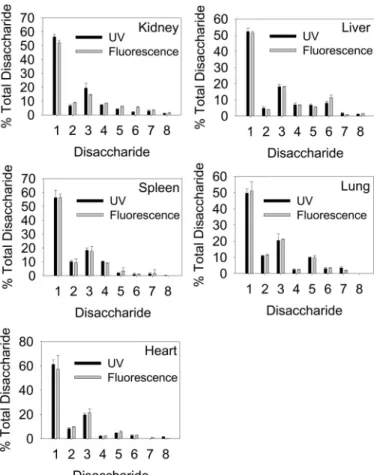
To determine the minimum amount of starting material required to obtain accurate structural data, we extracted HS from 100, 10, and 1 mg of mouse kidney (wet weight) and undertook comparative disaccharide analysis using BODIPY hydrazide (Fig. 3). All three samples gave comparable results, indicating the effectiveness and accuracy of the RIP-BODIPY method. The signal obtained from 500g of tissue was still above the detection limits, so it should in principle be possible to analyze smaller amounts. This confirms that minute quanti-ties of tissue can be used for accurate structural profiling of HS. To demonstrate the profiling potential of this methodology, we repeated the RIP extraction and BODIPY structural analysis of a range of mouse organs (Fig. 5). Liver, lung, spleen, and heart were all analyzed and compared with the kidney, along with a comparison between fluorescence and standard UV detection (Fig. 6 and Table 1). Each tissue yielded a unique compositional profile, with heart and kidney being relatively low sulfated and liver and lung being more highly sulfated. Although the UV data were generally in very close agreement with that obtained by BODIPY detection, some differences in quantitation between these two modes of detection were noted (Table 1), as seen in previous studies (20). The data were also in broad agreement with previous tissue HS data obtained using standard purifica-tion and analysis techniques including UV detecpurifica-tion or post-column fluorescence labeling (20 –22). In addition, data on the disaccharide composition of porcine mucosal heparin obtained by BODIPY detection were comparable with that obtained by UV detection data and also literature values (data not shown).
FIGURE 3. Structural profiling of disaccharides derived from
RIP-ex-tracted tissue HS using fluorescence detection. HS was purified from
dif-fering amounts of mouse kidney by RIP, and disaccharide compositions were
profiled using HPLC and BODIPY fluorescence detection. Representative pro-files are shown for data obtained from 100 (a), 10 (b), and 1 mg (c) of starting material (analysis was performed on one-half of each sample). Elution posi-tions of the eight commonly occurring disaccharides are indicated. d, quan-titative comparison of the compositional profiles expressed as the
percent-age of total disaccharides (mean⫾ S.D.; n ⫽ 3). Disaccharide standards are as
follows: standard 1, GlcNAc; standard 2, GlcNAc(6S); standard 3, UA-GlcNS; standard 4, UA-GlcNS(6S); standard 5, UA(2S)-UA-GlcNS; standard 6, UA(2S)-GlcNS(6S); standard 7, UA(2S)-GlcNAc; standard 8, UA(2S)-GlcNAc(6S). FIGURE 4. Expanded chromatogram of BODIPY-labeled mouse kidney HS
disaccharides showing early eluting free tag peaks. HS was purified from 1
mg of mouse kidney by RIP, digested with heparinases, and labeled with BODIPY hydrazide, and the disaccharides were separated by HPLC as described under “Experimental Procedures.” HPLC analysis was performed on one-half of the extracted sample. Free tag elutes before 10 min under the wash conditions used and thus does not interfere with clear measurement of the disaccharides.
Rapid and Sensitive Profiling of Heparan Sulfate
by guest, on January 3, 2011
www.jbc.org
Taken together, this provides validation of the RIP-BODIPY methodology.
Structural Profiling of HS from Tissue Culture Cells by Fluo-rescence Detection—We next tested the application of the RIP method to cells grown in culture. HS was purified from Swiss 3T3 cells by RIP and analyzed by BODIPY labeling and strong
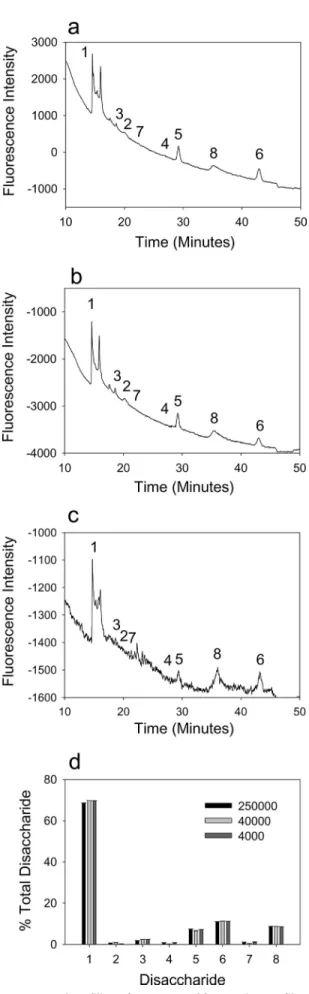
anion exchange HPLC. HS purified from 3T3 cells grown in 100-mm dishes (250,000 cells), 35-mm dishes (40,000 cells), or 24-well plates (4,000 cells) produced comparable results, indi-cating that the methodology permits profiling from as little as a few thousand cells (Fig. 7). Interestingly, the HS from 3T3 cells has a higher proportion of di- and trisulfated disaccharides (standards 5, 6, and 8) than the mouse tissues (Fig. 6 and Table 1). These data demonstrate the utility of the methodology for profiling HS structures from small numbers of tissue culture cells.
RIP-BODIPY Analysis of HS from Sulf1 Knock-out Mice—A major advantage of the new methodology is application in sys-tems that have previously been intractable due to lack of suffi-cient sample, such as knock-out mouse models with altered HS molecular phenotypes, exemplified by the Sulf family of enzymes. These are glucosamine endosulfatases that remove 6-O-sulfates from HS in the extracellular environment (23). This activity is considered crucial for the proper regulation of several growth factors (24). Mice deficient in Sulf activity show a number of specific developmental defects, which become most obvious for the brain (25). A lack of Sulf activity would be expected to result in HS with more 6-O-sulfates than wild type
FIGURE 5. Structural profiling of HS from different mouse tissues using
RIP extraction and fluorescence detection. HS was purified from 100 mg of
each tissue by RIP, digested with heparinases, labeled with BODIPY hydra-zide, and separated by HPLC as described under “Experimental Procedures.” Representative data are shown for the tissues: a, liver; b, lung. Disaccharide standards were as described in the legend for Fig. 3. c shows a quantitative comparison of the compositional profiles (data are expressed the percentage
of total disaccharide; mean⫾ S.D., n ⫽ 5). Data from the full panel of tissues
are provided in Fig. 6 and Table 1.
FIGURE 6. Comparison of UV versus fluorescent disaccharide analysis of
RIP-extracted HS from multiple mouse tissues. Bar charts of the data in
Table 1 are shown. HS was purified by RIP from 100 mg of each tissue by RIP and digested with heparinases, and disaccharide composition was measured by HPLC with UV or fluorescence detection (in the latter case, after BODIPY hydrazide labeling) as described under “Experimental Procedures.” Quantita-tive comparisons of the compositional profiles are shown for kidney, liver, spleen, lung, and heart (data are expressed the percentage of total
disaccha-ride; mean⫾ S.D., n ⫽ 5). Disaccharide standards were as described in the
legend for Fig. 3.
by guest, on January 3, 2011
www.jbc.org
mice. This has been observed in Sulf knock-out mouse embry-onic fibroblasts grown in vitro (23, 26) but has not yet been studied in vivo. However, it is known that HS biosynthesis is dynamic and alters when cells are placed in culture conditions (27–29). This leaves open the question as to whether the in vitro data truly reflect the in vivo HS molecular phenotype in tissues where the Sulfs are known to be expressed in cell type- and developmental stage-specific patterns (23). To explore this issue, we analyzed individual cerebella (average weight 26.8⫾ 4.3 mg) from postnatal day 6 Sulf1 knock-out mice, using the RIP-BODIPY methodology (Fig. 8). We found that the cerebel-lar HS from Sulf1 null mice displayed significantly higher proportions of each of the specific 6-O-sulfate-containing disaccharides (2, UA-GlcNAc(6S); 4, UA-GlcNS(6S); 6, UA(2S)-GlcNS(6S), and 8, UA(2S)-GlcNAc(6S)) than wild type littermates (Fig. 8c). However, the increase was most significant for disaccharides 6 and 8, and an increase in a non-6-O-sulfated disaccharide 5 (UA(2S)-GlcNS) was also notable. The RIP-BODIPY methodology was also used to demonstrate differ-ences in HS structure between Sulf1 and Sulf2 knock-out mice.4
These data represent the first measurement of in vivo changes in the HS structural profile in these knock-out mice and dem-onstrate the potential for RIP-BODIPY to be used for glycomics profiling of HS in function-specific contexts in animal models.
Bioassay of HS Purified from Mouse Tissue by RIP—A further advantage of RIP is rapid purification of HS samples for bioas-says. To demonstrate this, we studied mice with mutations in the HS biosynthetic enzyme 2-O-sulfotransferase (2OST); the null genotype results in early postnatal lethality due to lack of kidneys (14) and also defects in neural development (30). Embryonic mice fibroblasts lacking this enzyme activity have altered HS structure with essentially no 2-O-sulfation and a compensatory increase in 6-O- and N-sulfation (31). To explore
the functional effects of these changes in HS structure, we puri-fied HS by RIP from the brains of mice that were null, heterozy-gous, and wild type for the 2OST gene and tested the samples in HS-dependent bioassays of FGF signaling in HS-dependent BaF3 lymphoid cell lines (15). HS purified by RIP from wild type mice supported FGF-2 signaling via FGFR1 (Fig. 9); in marked contrast, HS from null mice lacked any ability to activate FGF2-FGFR1c signaling (Fig. 6), as predicted from the critical role of 2-O-sulfate groups in HS binding to FGF2 (32). Unexpectedly however, we also noted that HS from heterozygous mice also lacked activity (Fig. 9), revealing for the first time that gene dosage is critical for maintaining correct 2OST action in HS biosynthesis to create functional HS sequences for FGF2 signal-ing via FGFR1.
DISCUSSION
Purification and analysis of specific structures from HS that relate to particular biological functions is a significant challenge yet remains a requirement to identify HS structures in cell cul-ture and in vivo that have specific activities. Given the low abundance of specific structures and the pressing need for higher throughput glycomics studies, rapid scalable methods that minimize sample loss and are compatible with sensitive detection are now essential. Here we have described a new method for HS GAG purification, RIP (Fig. 1), which is compat-ible with many different types of tissue (Fig. 5) and cells (Fig. 7). Furthermore, using BODIPY labeling and fluorescence detec-tion with a standard HPLC fluorometer provides a 10 –100-fold increase in sensitivity (8) over previous fluorescent methods (10 –13) and permits structural profiling data on HS to be gen-erated with less than a milligram of starting material (Fig. 5) or as little as a few thousand cultured cells (Fig. 7). This means that new biological systems can be accessed for the first time. In addition, the streamlined nature of the protocol increases the number of samples that can be purified at one time, providing high throughput potential for the first time for these molecules.
4I. Kalus, S. Rohn, T. Puvirajesinghe, S. E. Guimond, P. J. Eyckerman-Koelln,
T. H. van Kuppevelt, G. ten Dam, J. E. Turnbull, and T. Dierks, submitted for publication.
TABLE 1
Comparison of UV versus fluorescent disaccharide analysis of RIP-extracted HS from multiple mouse tissues
HS was purified from 100 mg of starting material, digested with heparitinases, labeled with BODIPY hydrazide, and run on HPLC as described under “Experimental Procedures.” Data are expressed percentage of total disaccharide (mean⫹/⫺ S.D., n ⫽ 5). It should be noted that the small differences in the amounts of specific disaccharides detected using BODIPY versus UV are likely related to small differences in the extinction coefficients of the non-reducing end double bond caused by differences in structure (39) In contrast, the BODIPY-labeled saccharides are quantitated with a correction factor for variations in reducing end-labeling efficiencies based on chemical quantities, based on studies with authentic disaccharide standards (12). UV data are also subject to variable differences in the accuracy of subtraction of background noise from peaks, particularly so in the case of minor peaks and where sample amounts are low. There are often high levels of contaminating buffer or sample peaks in the earlier parts of the chromatogram, combined with general baseline drift. This results in a tendency to overestimate the amounts of lower sulfated disaccharides and underestimate the amounts of the higher sulfated or low abundance disaccharides. Fluorescence chromatograms are generally much less susceptible to these effects. ND, not detected.
Disaccharide Detection method Kidney Liver Spleen Lung Heart
1 UA-GlcNAc UV 56.33 (1.88) 52.25 (2.33) 56.33 (5.38) 49.71 (2.54) 61.19 (3.65) Fluorescence 52.07 (1.56) 51.35 (1.03) 56.58 (2.26) 51.20 (5.63) 57.23 (11.45) 2 UA-GlcNAc(6S) UV 6.61 (0.85) 4.86 (0.9) 10.13 (0.97) 10.96 (0.32) 8.23 (0.84) Fluorescence 8.91 (0.27) 3.96 (0.08) 9.52 (9.52) 11.48 (0.46) 9.63 (0.29) 3 UA-GlcNS UV 19.42 (3.55) 18.19 (1.45) 18.37 (1.77) 20.45 (4.11) 19.69 (1.35) Fluorescence 14.47 (0.43) 18.11 (0.36) 17.75 (3.55) 21.15 (0.21) 21.42 (3) 4 UA-GlcNS(6S) UV 7.35 (0.13) 7.01 (1.07) 10.36 (0.21) 2.41 (0.35) 2.16 (0.72) Fluorescence 8.38 (0.17) 6.84 (0.14) 9.30 (0.09) 1.20 (0.16) 2.33 (0.09) 5 UA(2S)-GlcNS UV 4.27 (0.13) 6.73 (0.69) 2.09 (0.1) 9.94 (0.27) 4.62 (0.22) Fluorescence 6.18 (0.19) 5.67 (0.11) 3.58 (2.18) 9.83 (1.28) 5.34 (1.07) 6 UA(2S)-GlcNS(6S) UV 2.12 (0.41) 8.05 (1.07) 1.02 (0.93) 3.06 (0.72) 2.59 (0.61) Fluorescence 5.59 (0.56) 11.41 (1.6) 1.36 (0.12) 3.33 (0.43) 2.96 (0.06) 7 UA-2S-GlcNAc UV 2.87 (0.76) 1.79 (0.31) 1.40 (0.76) 3.47 (0.82) ND (0) Fluorescence 3.16 (0.73) 1.05 (0.02) 1.90 (2.43) 1.81 (0.36) 0.94 (0.09) 8 UA-2S-GlcNAc(6S) UV 1.03 (0.24) 1.12 (0.30) 0.3 (0.05) ND (0) 1.52 (0.35) Fluorescence 1.24 (0.50) 1.61 (0.03) 0.01 (0.01) ND (0) 0.15 (0.02)
Rapid and Sensitive Profiling of Heparan Sulfate
by guest, on January 3, 2011
www.jbc.org
Data obtained are comparable with previously used standard methods (20 –22). Interestingly, we have noted some differ-ences in quantitation between UV and fluorescence detection, as noted previously by other investigators (20). Assuming care-ful experimental procedures and application of appropriate labeling correction factors, these differences may reflect more accurate measurement of compositional analysis by fluores-cence detection due to less inherent susceptibility to sample contamination and background noise (see legend, Table 1). The latter are a significant limitation for UV detection, especially where only small amounts of sample are available.
Here we demonstrated that purification of HS using RIP and subsequent disaccharide profiling with BODIPY detection allowed us to detect structural changes in HS from single post-natal cerebella of mice mutant in Sulf1 (Fig. 8). These changes suggest that Sulf1 normally removes 6-O-sulfates from all potential 6-O-sulfated disaccharides, but most notably, from trisulfated disaccharides (UA(2S)-GlcNS(6S)); interestingly, this action pattern of Sulf-1 differs significantly from that observed in fibroblast cells derived from Sulf-1 knock-out ani-mals and cultured in vitro. In the latter case, an increase in all 6-O-sulfated disaccharides was also observed (23) but with far less pronounced effects than those observed here for the in vivo analysis of cerebellum tissue and in different relative ratios. This is likely due to altered biosynthesis induced by placing the cells in culture conditions (29) and emphasizes the importance of studying HS structures from in vivo tissues to accurately decode the true structure-function relationships of HS. The application of the RIP-BODIPY methodology was also exploited to compare HS from Sulf1 and Sulf2 knock-out mice; clear differences in the HS molecular phenotype were revealed that suggest divergent action of these enzymes in vivo.4These
data represent the first measurement of in vivo changes in the HS structural profile in these knock-out mice and demonstrate the potential for RIP-BODIPY to be used for glycomics profil-ing of HS in function-specific contexts in animal models.
It should also prove possible to exploit and adapt the RIP-BODIPY methodology both for oligosaccharide mapping of HS domain structures (33) and for integral glycan sequencing (34), probably using HPLC (15) or capillary electrophoresis separa-tion. Furthermore, the sensitivity of BODIPY detection can potentially be further increased (⬃100–1,000-fold) using laser-induced fluorescence detection (35), allowing even smaller amounts of tissue or cells to be analyzed in the future.
RIP purification does not alter the structure of the HS, and the HS that is purified can also be used in bioassays (Fig. 9), allowing structure-activity relationships to be explored directly and providing insights into the functional consequences of altered HS molecular phenotypes. Here we demonstrated dif-ferences in the bioactivity of HS from mice with variant geno-types for HS 2-O-sulfotransferase. Although HS from wild type mice activates FGF-2 signaling through FGFR1, HS from null
FIGURE 7. Structural profiling of HS extracted from Swiss 3T3 fibroblasts. HS was purified from Swiss 3T3 cells by RIP, digested with heparinases, labeled with BODIPY hydrazide, and separated by HPLC as described under
“Experimental Procedures.” The whole of each extracted sample was run, and representative data are shown for 250,000 cells (a); 40,000 cells (b); 4,000 cells (c). d shows a quantitative comparison of the compositional profiles
(expressed as the percentage of total disaccharide; mean⫾ S.D.; n ⫽ 3).
Disac-charide standards were as described in the legend for Fig. 3.
by guest, on January 3, 2011
www.jbc.org
mice cannot (Fig. 9), in agreement with previous data on FGF2 stimulation of embryonic fibroblasts from these mice (31). This is not unexpected because 2-O-sulfates have been shown to be important for the binding of FGF-2 to heparin (32). Surprisingly
however, our new data revealed that HS from heterozygous mice was also unable to activate FGF-2 signaling, indicating the importance of gene dosage for correct 2OST action in HS bio-synthesis (Fig. 6). Although HS from heterozygous mice has 2-O-sulfates, changes in the fine structure of HS are known to affect its biological activity and presumably underlie this lack of activity (15). Thus, RIP methodology provides an impor-tant additional tool for tackling the complexities of HS struc-ture-activity relationships from in vivo tissue samples.
In summary, the RIP method opens up new avenues for studying specific HS and other GAG structures present in cells or tissues despite their low abundance when coupled with high sensitivity techniques such as fluorescent labeling (12). The application of RIP should enhance development of glycomics approaches for GAGs (36, 37), including emerging mass spec-trometry-based approaches (38), and will undoubtedly bring progress in uncovering the in vivo structure-function relation-ships of the heparanome (1, 3, 6) in complex biological systems.
Acknowledgments—We thank Prof. Arthur Lander (University of California, Irvine, CA) for stimulating discussions that prompted this method development, Prof. Merton Bernfield and Dr. Masato Kato (formerly of Harvard Medical School) for3H-labelled syndecan, and Prof. David Ornitz (Washington University, St. Louis, MO) for BaF cells.
REFERENCES
1. Turnbull, J., Powell, A., and Guimond, S. (2001) Trends Cell Biol. 11, 75– 82
2. Bishop, J. R., Schuksz, M., and Esko, J. D. (2007) Nature 446, 1030 –1037 3. Ori, A., Wilkinson, M. C., and Fernig, D. G. (2008) Front. Biosci. 13,
4309 – 4338
4. Powell, A. K., Yates, E. A., Fernig, D. G., and Turnbull, J. E. (2004)
Glyco-biology 14,17R–30R
5. Rudd, T. R., Skidmore, M. A., Guimond, S. E., Cosentino, C., Torri, G., Fernig, D. G., Lauder, R. M., Guerrini, M., and Yates, E. A. (2009)
Glyco-biology 19,52– 67
6. Lamanna, W. C., Kalus, I., Padva, M., Baldwin, R. J., Merry, C. L., and Dierks, T. (2007) J. Biotechnol. 129, 290 –307
7. Drummond, K. J., Yates, E. A., and Turnbull, J. E. (2001) Proteomics 1, FIGURE 8. Increase in 6-O-sulfate-containing disaccharides in the
cerebel-lum of postnatal day 6 mice deficient in Sulf1. HS was purified from single
postnatal day 6 mouse cerebella from Sulf1 knock-out and wild type mice by RIP, digested with heparinases, labeled with BODIPY hydrazide, and sepa-rated by HPLC as described under “Experimental Procedures.” Representative
data were obtained for Sulf1⫹/⫹mice (a) and Sulf1⫺/⫺mice (b). c shows a
quantitative comparison of the compositional profiles (expressed as the
per-centage of total disaccharide; mean⫾ S.D.; n ⫽ 3). Disaccharide standards
were as described in the legend for Fig. 3. Inset: expansion of the y axis show-ing detail of disaccharides 5– 8.
FIGURE 9. Bioactivity of HS purified from brains of mice deficient in
2-O-sulfotransferase. BaF3 lymphoid cells expressing FGFR1c were incubated
with 1 nMFGF-2 for 72 h in the presence of increasing concentrations of
heparin or HS purified by RIP (from the brains of mice wild type, heterozy-gous, or null for 2-O-sulfotransferase activity). Proliferation was quantified as
described under “Experimental Procedures” (mean⫾ S.D.; n ⫽ 3).
Rapid and Sensitive Profiling of Heparan Sulfate
by guest, on January 3, 2011
www.jbc.org
304 –310
8. Inoue, Y., and Nagasawa, K. (1976) Carbohydr. Res. 46, 87–95
9. Jaseja, M., Rej, R. N., Sauriol, F., and Perlin, A. S. (1989) Can. J. Chem. 67, 1449 –1456
10. Yates, E. A., Santini, F., Guerrini, M., Naggi, A., Torri, G., and Casu, B. (1996) Carbohydr. Res. 294, 15–27
11. Chomczynski, P., and Sacchi, N. (1987) Anal. Biochem. 162, 156 –159 12. Skidmore, M. A., Guimond, S. E., Dumax-Vorzet, A. F., Atrih, A., Yates,
E. A., and Turnbull, J. E. (2006) J. Chromatogr. A 1135, 52–56
13. Ratzka, A., Kalus, I., Moser, M., Dierks, T., Mundlos, S., and Vortkamp, A. (2008) Dev. Dyn. 237, 339 –353
14. Bullock, S. L., Fletcher, J. M., Beddington, R. S., and Wilson, V. A. (1998)
Genes Dev. 12,1894 –1906
15. Guimond, S. E., and Turnbull, J. E. (1999) Curr. Biol. 9, 1343–1346 16. Lohse, D. L., and Linhardt, R. J. (1992) J. Biol. Chem. 267, 24347–24355 17. Kinoshita, A and Sugahara, K. (1999) Anal. Biochem. 269, 367–378 18. Kitagawa, H., Kinoshita, A., and Sugahara, K. (1995) Anal. Biochem. 232,
114 –121
19. Toyoda, H., Nagashima, T., Hirata, R., Toida, T., and Imanari, T. (1997)
J. Chromatogr. B Biomed. Sci. Appl. 704,19 –24
20. Deakin, J. A., and Lyon, M. (2008) Glycobiology 18, 483– 491
21. Warda, M., Toida, T., Zhang, F., Sun, P., Munoz, E., Xie, J., and Linhardt, R. J. (2006) Glycoconj. J. 23, 555–563
22. Ledin, J., Staatz, W., Li, J. P., Go¨tte, M., Selleck, S., Kjelle´n, L., and Spill-mann, D. (2004) J. Biol. Chem. 279, 42732– 42741
23. Lamanna, W. C., Baldwin, R. J., Padva, M., Kalus, I., Ten Dam, G., van Kuppevelt, T. H., Gallagher, J. T., von Figura, K., Dierks, T., and Merry, C. L. (2006) Biochem. J. 400, 63–73
24. Ai, X., Kitazawa, T., Do, A. T., Kusche-Gullberg, M., Labosky, P. A., and Emerson, C. P., Jr. (2007) Development 134, 3327–3338
25. Kalus, I., Salmen, B., Viebahn, C., von Figura, K., Schmitz, D., D’Hooge,
R., and Dierks, T. (2008) J. Cell. Mol. Med. (October 16, 2008) doi:10.1111/j.1582-4934.2008.00558.x
26. Lamanna, W. C., Frese, M. A., Balleininger, M., and Dierks, T. (2008)
J. Biol. Chem. 283,27724 –27735
27. Brickman, Y. G., Ford, M. D., Gallagher, J. T., Nurcombe, V., Bartlett, P. F., and Turnbull, J. E. (1998) J. Biol. Chem. 273, 4350 – 4359
28. Brickman, Y. G., Nurcombe, V., Ford, M. D., Gallagher, J. T., Bartlett, P. F., and Turnbull, J. E. (1998) Glycobiology 8, 463– 471
29. Ford-Perriss, M., Guimond, S. E., Greferath, U., Kita, M., Grobe, K., Ha-buchi, H., Kimata, K., Esko, J. D., Murphy, M., and Turnbull, J. E. (2002)
Glycobiology 12,721–727
30. Pratt, T., Conway, C. D., Tian, N. M., Price, D. J., and Mason, J. O. (2006)
J. Neurosci. 26,6911– 6923
31. Merry, C.L., Bullock, S. L., Swan, D. C., Backen, A. C., Lyon, M., Bedding-ton, R. S., Wilson, V. A., and Gallagher, J. T. (2001) J. Biol. Chem. 276, 35429 –35434
32. Guimond, S., Maccarana, M., Olwin, B. B., Lindahl, U., and Rapraeger, A. C. (1993) J. Biol. Chem. 268, 23906 –23914
33. Turnbull, J. E., and Gallagher, J. T. (1988) Biochem. J. 251, 597– 608 34. Turnbull, J. E., Hopwood, J. J., and Gallagher, J. T. (1999) Proc. Natl. Acad.
Sci. U.S.A. 96,2698 –2703
35. Militsopoulou, M., Lecomte, C., Bayle, C., Couderc, F., and Karamanos, N. K. (2003) Biomed. Chromatogr. 17, 39 – 41
36. Sasisekharan, R., Raman, R., and Prabhakar, V. (2006) Ann. Rev. Biomed.
Eng. 8,181–231
37. Turnbull, J. E., and Field, R. A. (2007). Nat. Chem. Biol. 3, 74 –77 38. Staples, G. O., Bowman, M. J., Costello, C. E, Hitchcock, A. M., Lau, J. M.,
Leymarie, N., Miller, C., Naimy, H., Shi, X., and Zaia, J. (2009) Proteomics
9,686 – 695
39. Kariya, Y., Yoshida, K., Morikawa, K., Tawada, A., Miyazono, H., Kikuchi, H., and Tokuyasu, K. (1992) Comp. Biochem. Physiol. B 103, 473– 479
by guest, on January 3, 2011
www.jbc.org