Publisher’s version / Version de l'éditeur:
Heating, Piping, Air Conditioning, pp. 137-142, 1955-11
READ THESE TERMS AND CONDITIONS CAREFULLY BEFORE USING THIS WEBSITE.
https://nrc-publications.canada.ca/eng/copyright
Vous avez des questions? Nous pouvons vous aider. Pour communiquer directement avec un auteur, consultez la première page de la revue dans laquelle son article a été publié afin de trouver ses coordonnées. Si vous n’arrivez pas à les repérer, communiquez avec nous à [email protected].
Questions? Contact the NRC Publications Archive team at
[email protected]. If you wish to email the authors directly, please see the first page of the publication for their contact information.
NRC Publications Archive
Archives des publications du CNRC
This publication could be one of several versions: author’s original, accepted manuscript or the publisher’s version. / La version de cette publication peut être l’une des suivantes : la version prépublication de l’auteur, la version acceptée du manuscrit ou la version de l’éditeur.
Access and use of this website and the material on it are subject to the Terms and Conditions set forth at
Moisture in transient heat flow
Solvason, K. R.
https://publications-cnrc.canada.ca/fra/droits
L’accès à ce site Web et l’utilisation de son contenu sont assujettis aux conditions présentées dans le site LISEZ CES CONDITIONS ATTENTIVEMENT AVANT D’UTILISER CE SITE WEB.
NRC Publications Record / Notice d'Archives des publications de CNRC:
https://nrc-publications.canada.ca/eng/view/object/?id=545c856e-bccd-4284-ab7a-f33d994a6525 https://publications-cnrc.canada.ca/fra/voir/objet/?id=545c856e-bccd-4284-ab7a-f33d994a6525by
HIS
publication is being distributed by the Division of Build-
Ting
Research of the National Research Council as a contribu-
tion towards better building in Canada. It should not be repro-
duced in whole or in part, without permission of the original
publisher. The Division would be glad to be of assistance in
obtaining such permission.
Publications of the Division of Building Research may be
obtained by mailing the appropriate remittance, (a Bank, Express,
or Post Office Money Order or a cheque made payable at par in
Ottawa, to the Receiver General of Canada, credit National
Research Council) to the National Research Council, Ottawa.
Stamps are not acceptable.
A
coupon system has been introduced to make payments for
publications relatively simple. Coupons are available in denomi-
nations of 5, 25, and 50 cents, and may be obtained by making a
remittance as indicated above. These coupons may be used for
the purchase of all National Research Council publications in-
cluding specifications of the Canadian Government Specifications
Board.
A list of publications issued by the Division of Building Research can be obtained on application to the Publications Section, Division of Building Research, National Research Council, Ottawa, Canada.
Moisture in Transient Heat
Flow
By
I<.
R. Solvason*, Ottawa, CanadaCALCULATION of building heat losses and gains is normally based upon coefficients obtained for dry mate- rials. The presence of moisture, when taken into account, is usually con- sidered to influence the heat trans- mission by increasing the thermal conductivity. Moisture, according to this simple concept, introduces little additional complication into the cal- culation of heat flow if it remained stationary within the materials in- volved. Hutcheon and Paxtonl have shown that in a hygroscopic material such as wood sawdust the moisture migrates under changing tempera- ture conditions, thus providing a substantial additional mechanism of heat transmission.
Hutcheon and Paxtonl demon- strated that for wood sawdust, the final redistribution of moisture fol- lowing imposition of a fixed tem- perature gradient on the moist sam- ple, could be predicted from the
'Assistant Research Officer, Division of Build- ing Research, National Research Council.
'Moisture M i ration in a Closed Guarded Hot Plate by N fl. Hutcheon and J. A. Paxton (ASHVE TRANSACTIONS, VOI. 58, 1952, p. 301). For presentation at the G2nd Annual Meeting of the AMERICAN SOCIETY O P HEATING A N D AIR- CONDITIONING ENGINEERS, Cincinnati. Ohio, Jan- uary 1956.
SUMMARY
-
Measuremeiits were made of the effects of mois- ture upon the heat flow in simple cases of transient heat flow es- tablisliecl under control in lab- oratory apparatus. Samples of various materials, but mainly of the building insulation type, 7in. square and up to 2 in. thicli were enclosed in a special cell, between hollow plates through which liquid was circulated for heating or cooling. Variatiol~ of heat flow with time is shown for various amounts of moisture present and compared to both tlie experimental ancl calculated transient conditions for clry ma- terials. Very substantial modi- fications to tlie heat flow uncler trcnsient conditions result from the presence of moisture.
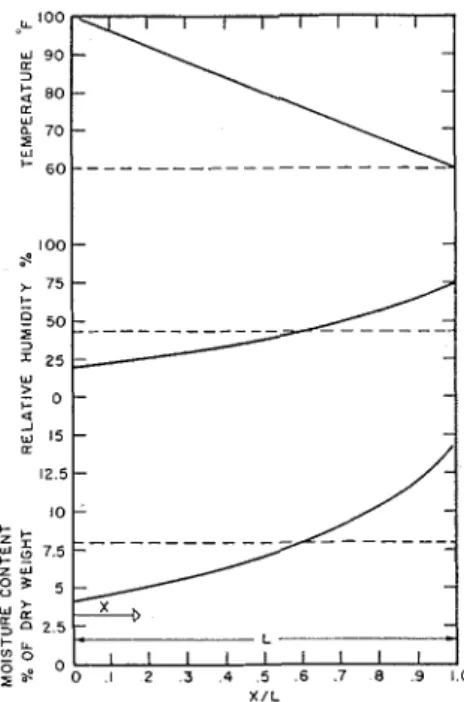
known hygroscopic properties of the sawdust. Following their method the moisture redistribution throughout a sealed sample of sawdust containing
8 percent moisture by weight, has been calculated, and is shown in Fig. 1, for a change from a uni- form temperature of 60
F
through- out, to 100F
one side and 6 0 F on the other.If the sample thickness is 4 in. and the density of dry material is 6 lb per cu ft, approximately 0.022 Ib of water per sq ft of sample area must be evaporated in the region from
x / L
= 0 tox / L
= 0.6, mi- grate as vapor, and be condensed in the region fromx / L
= 0.6 tox / L
= 1.Assuming the latent heat of evap- oration to be 1000 Btu per Ib, a heat flow of 22 Btu per s q f t across the plane
x / L
= 0.6 results because of the vapor flow.Once redistributed, the moisture, at least i n sawdust, adds little to the heat transfer rate for the dry material. During the redistribution, however, the heat transmission is increased because of the vapor trans- fer and there is a marked deviation from the conditions for the corre- sponding case of dry materials.
This mechanism and its effects have now been further examined for several combinations of materials and temperatures.
Tests
Samplcs of a number of materi- als, singly and in combination, 7 in. square and of thicknesses up to 2
Heating, Piping & Air Conditioning, November 1955 137
heated and cooled plates. Tests were carried out with the materials dry and then with moisture added. Transient conditions were established by suddenly changing the tempera- ture of one plate, and heat flow rates and temperatures were recorded throughout the test period until con- tlilions had substantially "reached steady state.
The materials tested included the follo~ving composite and homoge- neous samples:
Test No. 1: In this test preformed glass wool was placed between two pieces of fiberboard '/z in. thick and with a density of 15.25 Ib per cu ft, or a total weight 1.27 Ib per sq f t of area. T h e glass lvool was 7/8 in. thick and had a density of 11.1 Ib per cu ft, or a total weight 0.81 Ib per sq ft. T h e moisture contents tested were zero and approximately 5.1 percent of the dry weight of fiberboa~d or a total of 0.065 lb per sq ft.
Test No. 2: I n this test preformed glass wool was placed between two sheets of blotting paper 0.023 in. thick and with density 33.1 lb per cu ft. T h e total weight of paper was 0.127 lb per sq ft. T h e glass wool had a thickness of 7/R in. and a den- sity of 12.4 Ib per cu ft. T h e moisture con- tents were zero, 0.0325 and 0.065 Ib pel sq ft.
Test No. 3: I n this test the material used \\as expanded vermiculite, screened through a 13-mesli screen, having a thick- ness of 1% in. and a deusity of 16.3 Ib per cu ft, or a weight of 1.70 lb per sq ft. Rloisture contents of zero and 0.065 l b per sq f t of area or 3.8 percent of the dry weight of material were tested.
Test No. 4 : T h e material used was rprrlce sawdust, 2.156 in. thick having a density of 12.0 Ib per cu i t , or a weight of 2.656 Ib per sq ft. The moisture contents were zero and 9 percent of the dry weight or 0.194 Ib per sq f t of area.
Apparatus a i d Test Procedure The testing apparatus developed by Hutcheon and Paxton and modi- fied slightly for these tests, is shown in Fig. 2. It consisted of two 7 - in. square hollow alumillurn plates between which the test samples were placed. Water at a controlled tempera- ture was circulated through a chan- nel in the plates to produce the de- sired plate temperatures. Multiple thermocouple bakelite heat meters 4% in. square by 3/64, in. thick were cemented to the central por- tions of the ~ l a t e s to measure the
~nented to the remaining area of the plates surrounding the meters to provide a guard area around the
Z U-l
~ S 1 ~2 3 O 4 5 6 7 8 9 1 0 X / L
Fig. 1-Temperature, relative humidity, and moisture distribution in wood saw- dust w i t h average moisture content of 8
percent for T I T? = 60 F (broken line) and T I = 100 F, T? = 60 F (full line)
h A S A M P L E V Y
I
Fig. 2-Testing apparatus - both liquid reservoirs are provided w i t h electronic temperature control
meters. Thermocouples embedded in the plate surface were used to meas- ure plate temperatures.
The hot plate temperature was maintained by circulating water from an electrically heated 5-gal reservoir. The cold plate was sup- plied with water from a refrigerated 60-gal reservoir. A valve arrange- ment permitted either hot or cold water to be circulated through both Heating, Pipin
the other. Water temperatures had to be accurately controlled since a rapid change in water and plate temperature even though of very small amplitude would cause a large change in the heat meter voltage. -
A commercial electronic temperature controller was adapted to provide a modulatiilg form of control lor boll1 reservoirs.
In tests Nos. 1, 2 a n d 3, samples with thermocouples spaced at inter- vals as shown in Fig. 2 were sealed in polyethylene bags a n d placed be- tween the plates. Cold water (tem- perature T , = 6 0
F
approximately) was circulated through both plates until the temperature at all planes reached plate temperature. Hot water (temperature T I = 100F
approxi- mately) was then substituted for the cold water in the plate at x = 0. Starting at the time of the tempera- ture change ( d = 0) readings of the heat meter voltages a n d of the tem- peratures were taken a t definite time intervals until very nearly steady state coilditions prevailed. T h e electronic temperature indicator used was suit- ably modified to give heat meter voltages as well as temperatures.The temperatures T I and T , were maintained for sufficient time to en- sure steady state conditions and the conductallce for the dry sample was obtained. The temperature at the plate x = 0 was then suddenly re- duced to T , and heat flows and tem- peratures again recorded.
With the sample a t temperature T , throughout, a measured amount of water was introduced near the plate x = 0, without disturbing the plate spacing or the sample in any way, and sufficient time was allowed to permit the water to become dis- tributed. The transient heat flow and temperature relationships for the sample were again recorded.
Test No. 4 was performed using an apparatus similar to that used in tests 1, 2 and 3 but with pro- vision to control the plate tempera- tures from 1 0 F to 8 0
F.
Heat flow was measured at the x = 0 bound- ary only. Thelate
temperatures f o r this test were T , = 41F ,
T I in- & Air Conditioning, November 1955creased lrom 4 1 F to 79 F ; TI =
79 F, T2 increased from 4f1
F to 79 F ;
and
T ,
= 12 F, T1 increased fro11112 F to 47 F.
Theoretical Heat Flow
The temperature and heat flow re- lationships following such sudden boundary temperature changes can be expressed by solutions of the Fourier equation :
sT/se = a (sZT/s,?),
where
T = temperature ( F ) . 8 = time ( h o ~ ~ r s ) .
.z = distance from the reference boundary (feet).
a: = k ~ ' ~ c , the thermal diffllsivity, square feet per hour.
k = thermal conductivity, Btu per ( h o u r ) (square foot) (Fahren- heit degrees per foot).
p = density, pounds per rubic foot. c = specific heat, Btu per (pound)
(Fahrenheit degree).
I l the temperature is initially T, at all planes and at time 0 = 0 the temperature at x = 0 is sud- denly increased to TI, while at x
L
the temperature remains at T,, the temperature is given by:where
z = T'~/L'.
The heat flow at x = 0 will be given by
which can be written
Q, = Q , rl
+
S ( ~ e ) ]... .
... .
( 2 )where
Qs the final steady state heat flow wliich is seen to equal K/L ( T I - T , ) .
S (20) = the series,
Similarly at x = 1, the heat flow will he
If after steady state conditions have heen attained with temperatures
TI
at x-
0 andI',
at x = I,, i.e.T T,
+
( T I - T,) ( 1 - x / L ) , the temperature at x = 0 is sud-I 1 l 1 l l l l l I 1 1 1 1 1 1 1 I i 1 l l l l l l
0.3 0 . 5 1 2 3 4 6 810
VALUES OF z e =J.- e/2
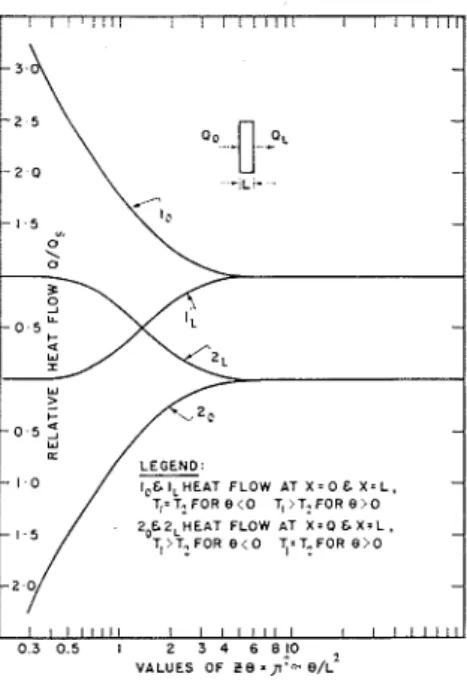
Fig. 3-Theoretical h e a t flow 9 s . s' at/
L2 following sudden temperature changes. a t x = O
clenly reduced to T,, the temperature and heat flow relations are given by:
Q, = - Q , LS ( z e ) ]
... .. .. ...
( 5 ) QL = QI [ B (28) I ..
..
.. . .
.. .
. ( 6 )where
Qs = the steady state heat flow be- fore time 0 = 0.
S
(z0)and B (20) = the series as in Equations 2 and 3.Typical values of Qo/Qs ancl QL/Qs, which will hereinafter be re- ferred to as the relative heat flows, are plotted against (20 = rrZa0/L' in Fig. 3, using calculated values of
S (20) and tables of
B (20).Experimental heat flow values may deviate from the theoretical values due to departure from unidirectional heat flow and to the finite time re- quired to produce a boundary tem- perature change.
The equations may, however, be used as a check on experimental values for dry materials and as a basis of comparison for the corre-
sponding observatioils with mois terials. They may also be use examine the extent to which th with moisture present may be repr sented by the case for the dry ma- terial with adjustments to the co- eff icients.
Discussion oP Results
The relative heat flows Qo/Qs ancl QJQs (Qs = the steady state heat flow for d r y material) are presented graphically in Figs. 48, 5, 6 and 7, for tests Nos. 1, 2, 3 and 4 respec- tively. The temperature rise with time at various planes in test No. 2 is shown i n Fig. 8. A logarithmic time scale is used, in all cases, as a convenient base for plotting.
The presence of moisture, as was expected, very markedly increased the transient heat flows occurring when TI at x = 0 was increased. Ail illcrease in heat flow occurred not only at the x = 0 boundary but also at the x = L boundary. nlaximum relative heat flows QI,/Qs of 1.4 (Fig. 4,), 2.6 (Fig. 5 ) ancl 1.3 (Fig. 6 ) were observed in tests 1, 2 and 3 respectively. These values, according to the theory lor dry materials, (Equation 3 ) shoulcl have ap- proached but not exceeded the final steady state values of 1.05, 1.02 and 1.025 respectively which were found 1% ith moisture present.
The time required to reach a given value of QJQs was considerably re- duced with moisture present. Com- parative times. lor example. to reach QJQs = 0.9 were 27/44, 3.5/16 and 15/19 for tests Nos. 1, 2 and 3 respectively.
It may be noted that the results just presented for the case of an in- crease in Tl from 6 0 F to 100 F, T, remaining at 60
F.
a r e for the first such operation, following intro- duction of the water near the x = 0 plate. The corresponding curves ob- tained for subsequent cycles produced by reducing T, to 60 F a n d then in- creasing to 100 F a second time did not show exactly the same moisture effects as the initial curves. The in- Heating, Piping & Air Conditioning, November 1955f interest also to
eriod. This can be found from the area between the curves for the wet ndition and that for the dry test. e cumulative increase in heat flows at the x = L plate, for various times
I l l l l l l l 1 1 1 I l l 1 1 I l l I F I B E R B O A R D - - - - I ,
1
1 I 1 1 1 1 1 1 1 1 1 1 1 1 1 1 1 1 I l l 3 4 56 8 10 15 20 ZO40 60 100 200 400 800 TlME IN MINUTES Lcgcnd lo & 11.: M/C = 0 1 30 & 31.: M/C = 0.065 Ib/ft=f T2 = 6 0 F TI ~ncrcased GOF to lOOF at 0 = 0 20 & 21.: M/C = 0 I 40 & 4r.: M/C = 0 065 Ib/ft2[ TZ = GOF T I decreased IOOF to 6 0 F at 0 = 0 F1n.11 Q/Qs for 30 & 31. = 1 05 Q s = 6.72 Btu/hr for A?' = 4 0 FFig. 4-Heat flow vs. time for glass wool and fiberboard combination following sudden boundary temperature changes
(test No. 1)
siderable time to seek a uniform dis- tribution was prevented from reach- ing this condition because of the hysteresis effect in adsorption and desorption, so that the first operatio11 following addition of the water al- ways began with a higher moisture content near the x = O side.
The curves presented show the in- slantaneous rates of heat flow. It is
after increase of
T , ,
are given in Table 1 for the case ofT ,
increasedI " ' " '
" ' " ''
' " I
0 - T H E O R E T I C A L FOR l . 3#
O L . 0.00725.
- 1 53 x 0 / 0 5 FOR O R Y M A T E R I A L -2.0 I 5 3 4 6 8 10 20 30 60 100 200 400J
TlME IN M I N U T E S Legend l o & 11.: Ivf/C = 0 30 & 31.: M/C = 0.0325 Ib/ftZ 50 & 51,: M/C = 0.065 Ib/ft2 T : = 6 0 F T I increased GOF to IOOF at 8 = 0 2u X. 21,: M/C = 0 1 -10 & 41,: M/C = 0.065 Ib/ft2f T : = 6 0 F T I decreased IOOF to 6 0 F at 8 = 0 Final Q/Qs for 50 & 51.-
1.02 Q = 10.8 Btu/hr for AT = 4 0 FFig. 5-Heat flow 1's. time for glass wool and blotting paper combination follow- ing s u d d e n boundary temperature changes (test No. 2). L = 0.921 in./12 ft
from 60 F to 100 F. The results for test No. 4 with sawdust are not in- cluded since heat flow was metered only a1 x = 0.
It may be noted that the corre- sponding latent heat transmission, if all the water were evaporated a t x
Table 1-Increase in Heat Flow in Btu at the x = 0 Plate at Various Times Following an Increase in Tl from 60 to 100 F
-
hfo~sture T ~ m e from tncrease of T I ( h r ) Increase at Tcst No.
1
t1
0.5I
11
3I
61
201
6 hr in % of latent heat value 1. F~berboardand glass wool 0 0 6 1 0 1 1 7 6.2 10.6 23.7 16 2. Blotting 0.032 6.9 9 6 12.0 13.0 13.9 4 3 paper and
glass wool 0.065 9.2 15 6 24.7 27.9 30 4 4 7 3. Expanded
verrniculitc 0.061 0 64 5 8 9 1 12.7 24.6 3 8
= 0, moved as vapor and condensecl a1 x = L, would be 32 and 65 Btu for the two moisture contents. The increased heat flow at the end of 6 hr varied from 1 6 percent of this lalent heat value for test No. 1 with
he fiberboard and glass wool sample to 47 percent in test No. 2 for the blotting paper and glass wool sample. However, in test NO. 1 the cumula- tive increase in heat flow was still growing and at the end of 20 h r had amounted to 36 percent of the latent heat value.
The effects of moisture on the heat flows in the cases in which the tem- perature
T ,
at the x = 0 boundary0 - T H E O R E T I C A L FOR 0 0101
.
- I 12 ~ o / a , F O A M / C : o 2 3 6 8 10 002- 400 T l M E IN MINUTES Legend lo & 1 1 . M/C = 0 3u & 31'~: M/C = 0.06s Ib/ft2] Tz = 60F T I increased GOF to IOOF at 0 = 0 20 & 21.: M/C = 0 1 4u & 4 ~ : M/C = 0.065 Ib/ftZf T : = GOF T I decreased IOOF to 6 0 F at 0 = 0 F ~ n a l Q/Qs for 30 & 31, = 1.025 Q = 11.2 Btu/hr for AT = 4 0 FFig. &-Heat flow 0s. time for expanded vermiculite following sudden boundary temperature changes (test No. 3)
was reduced from 1 0 0
F
to 60F,
T 2
at x = L remaining constant at 60 F, were of the same order as those occurring upon an increase inT ,
lrom 6 0 F to 100 F as just discussed. The heat flow out at x = 0 following a decrease of
T ,
was increased by the presence of moisture. The heat flow out at x =L,
which in the dry case decreased gradually from the steady state value to zero, was caused by the presence of moisture to de- crease much more rapidly, then toture present, heat flowed out at both sides, gradually reducing to zero as temperatures equalize. However, with
by rise to the first maximum indicates which is followed by drop indicating re- reached values of evaporation and finally a slow rise e value for the dry material as the evaporation is com-
is being condensed and again by conduction to the cold boundar Thus, in effect, the heat flow can b THEORETICAL H E A T FLOW F O R
-
: 0 . 0 0 7 9 0 the evaporating and condensing rgions.
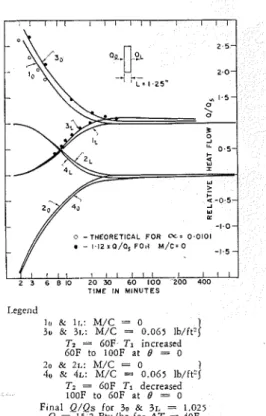
Fig. 7-Heat flow or.
During part of the transient wit
time for spruce saw-
dust following sudden moisture present the heat flow at b o u n d a r y temperature = 0, appears, in some of the tests, changes (test N o . 4 ) to be a constant multiple of the heat flow for the dry material. Points have been plotted in Figs. 5 and G showing
1.53 and 1.12 times the heat flow fo
the dry material. These agree fair1 TIME IN M I N U T E S material for the time from 0 = 0
During the transient period, the 1 1 0 2 3 4 6 8 10 20 T I M E 30 40 IN M I N U T E S 60 80 I00 200 400 600
moisture present, which was redis- tributed by a process of evaporation, vapor flow and condensation as the temperatures equalized, heat had to be provided for the evaporation and absorbed upon condensation. The net heat flow out at both sides must
always equal the difference in heat I O O - stored in the material between initial
95 and final conditions. Without mois-
heat of evaporation was supplied partly from the plate at n- =
L
and partly by coliduction from the con- densing region. The balance of the heat liberated upon condensation moved by conduction to the plate atx = 0. The heat required for evapo-
ration was first drawn from the sen- sible heat in the material, but as the evaporation colltiliued, the ternpera- ture was reduced below 60 F, result- ing ill a heat flow i r ~ at x = L.
During the redistribution, moisture evaporated at one plane need not necessarily migrate to another plane
I I I I I
, X = 0 0 0 0 800
/
4
__---
-
5;
~Toy7--
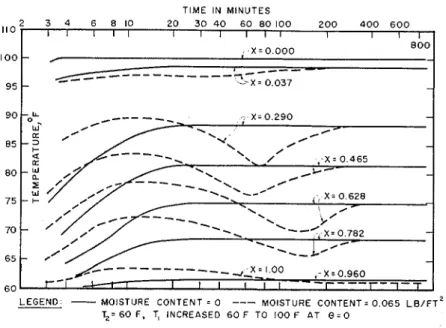
ancl remain there: but may succes- sively be condensed and re-evapo- rated at several intermediate planes. This pheliomenon is illustrated by the temperature curves for test No.
2 (Fig. 8 ) . The rapid temperature
L E G E N D
-
MOISTURE C O N T E N T = 0---
M O I S T U R E C O N T E N T = 0 065 L B / F T ' T2= 60 F , T, I N C R E A S E D 60 F T O I00 F A T 8 = 0Fig. 8-Temperature rise us. time at various planes for glass wool blot- ting paper combination (test N o . 2)
pleted. The amount of moisture pres- until steady state conditions were ent in this test was more than could
be absorbed hygroscopically, leading to rather high humidities, so that this effect was more pronounced than ~vould normally be expected.
A mathematical treatment of the case with moisture present would 11e complicated since the conductive heat
reached with the dry material. The x = 0 heat flow with moisture can be represented approximately by equa- tion 2 using a lower value for a.
This device does not, however, use- fully describe the heat flow a t x =
L
since Q L / Q s (Equation 3 ) can still only equal unity, while in the actual flow and the latent heat flow are so case a value greater than unity is inter-related. The latent heat flow found.
must operate both in series and in While no simple correlation be- parallel with the co~iductive heat flow, tween heat flow and moisture move- since lieat must flow by conduction ment is evident, the magnitude of the to the plane at which water is being increase in heat flow observed in the
tests with moisture does illdicate some of the factors involved.
The larger of the two moisture con- telits iu test No. 2 is seen to produce a much larger increase in heat flow. Comparing tests Nos. 1 and 2, with equal total amounts of moisture, a much greater increase in heat flow resulted in test No. 2. This can be attributed to the lower thermal re- sistance between the heat source and the moisture source and also between the moisture sink and the heat sink. The expanded vermiculite (test No. 3 ) exhibited a relatively smaller in- crease in heat flow. I t is thought thal the water present was more intimate- ly bound in this material and per- mitted a much lower rate of evapo- ration.
I n test No. 4 the higher tempera- lure level test procluced a larger in- crease in heat flow. The 9 percent moisture content at 4 1 F indicates a relative humidity of 47.5 percent or a vapor pressure of 0.122 in. Hg. Upon increasing the temperature a1
x = 0 to 7 9
F
the vapor pressure could rise momentarily to approxi- mately 0.500 in. Hg, producing a l a p o r pressure difference of 0.378 in. Hg. The corresponding vapor pressure difference produced by in- creasilig T, from 12 F to 47F
woulcl only be 0.124, in. Hg, res~llting in the smaller increase in heal flow. Tests at a 2 0 F temperature difference(TI
= 60,T?
= 4 0 not s h o ~ v r ~ here) produced practically the same rela- tive heat flow as a 4 0 deg tempera- ture difference(TI = 80, T2
= 4'0). With one-half the temperature differ- ence, very nearly one-half the initial vapor pressure difference results and hence he same relativc heat flows. Since a vapor flow is necessary to produce the increased heat flows il- lustraled, the vapor permeability ofthe materials can be expected to have a marked influence on the increase in heat flow.
The transient conditiolls selected for study were chosen to facilitate the testing. They do, however, give some indication of the probable im- portance of moisture in cases of periodic heat flow such as are in- volved in the determination of air. conditioning loads from walls and roofs. I n these studies the tempera- ture changes were created suddenly while in periodic heat flow they oc- cur gradually. The rapid and sub- stantial increase in heat transmissiori attributable to the presence of mois- ture in certain of the transient cases indicates that similar substantial ef- fects may be expected in periodic flow. The maximum periodic flow, the total flow o r both may be in- creased. Sirice the moisture may be regarded as providing a mechanism which can, b y providing for latent heat transfer, by-pass part of the resistance to conduction provided by a vapor permeable insulation, it may be expected also that in certain cases the time lag for maximum heat flow will be substantially decreased.
The cases studied were for closed systems, whereas in walls moisture can enter and leave at the boundaries. However. the amounts of moisture introduced in these tests of 0.032 and 0.065 lb per sq ft are relatively small and well within the amounts which might be expected in any hy- groscopic materials regardless of moisture lransfer at the boundaries. Built-up roofs will usually ~ r o v i d e a close approximation to a closed sys- tem and may at times contain con- siderably greater qualitities of water than those studied.
C o l ~ c l u s i o l ~
It Ilna been shown that moderate aznounts of moisture present in por- ous samples capable of providing moisture storage can modify greatly the transient heat flow conditions from
duced corresponding vapor press changes and led to evaporation, va flow, and condellsation. This con tuted an additional nlechanism for th transmission of heat in the form o latent heat, operating i n conjunctio with the usual mechanisms of hea trnnsmission in dry materials. The e feet of the moisture upon the stead state heat transmission in the sampl studied was shown to he small.
The magnitude of the variation i the heat flow puttern produced by th preaence of moisture in an actual wa or roof construction would appear to depend on: (n) the arnount of mois- ture present; ( b ) the imposed tem- peratures and vapor pressures; ( c )
the moisture-sorbing and moisture transmission properties of the mate- rials; and ((1) the heat transmission properties of the materials and the arrangement of the materinls.
The results indicate that substantial en'ects lnay also he foulid in many cases of periodic heat flow in walls :and roofs. Further experimental work allould I,e undertaken to determine how estensive these effects may be in
practice.
Acknowledgment
The experimental work was done b y the author while on the staff of t h e Prairie Regional Station of the Di- vision of Buildilig Research, National Research Council, at Saskatoon, Can- ada. I t formed the basis for a thesis submitted, under a cooperative a r - rangement, to the Department o l Mechanical Engineering, University of Saskatchewan, in partial fulfillment of the requirements for the degree of
Master of Science. The author is in- debted to members of t h e staff of the College of Engineering of the Uni- versity of Saskatchewan, to
N.
B.
Hutcheon, assistant director of the Division of Building Research, a n d toG.
0. Handegord, officer.in-charge
of the Prairie Regional Station, f o r assistance and encouragement in the prosecution of this project.This paper is a contribution from the Division of Building Research, National Research Council, Canada, and is published with the approval of the director.
-