Influence of Temperature-Driven Phenology and
Photoperiodic Induction of Reproductive Diapause on
Population Dynamics of
Erythroneura
comes
(Homoptera: Cicadellidae)
TIMOTHY E. MARTINSON ANDTIMOTHY J. DENNEHylDepartment of Entomology,Cornell University,New YorkState Agricultural Experiment Station, Geneva, NY14456
Environ.Entomol.24(6): 1504-1514 (1995)
ABSTRACT The influence of degree-day accumulationsand photoperiodic induction of dia-pause on the phenology ofErythroneura C011WS (Say) was investigated. In growth chamber experiments, nymphs reared at photoperiods of<13.5:10.5 (L:D) h entered reproductive dia-pause. Egg production and proportions of gravid females in field populations dropped sharply between1and15August in both the warm(1991) and cool(1992) growingseasons,suggesting that the onset of reproductive diapause occurs in late July to early August. Stage-specific developmental times from a 1912 study of 118 leafhopper nymphs were used to estimate degree-day requirements (baselO°e) for eggs and the 5 nymphal stadia. These estimates were used to construct a stage-specificdevelopmental model, which was validated with field data collected at4vineyards in1991 and1992. The model predictions agreed well with the timing of developmental events in 4 vineyards in both 1991 and 1992, years representing extremes in temperature accumulations in western and central New York.These data suggest that ac-cumulations of>710 degree days (DD) before 1August are required to produce a 2nd gen-eration ofE. comes under climatic conditions in New York.Variationsin temperature-driven development are hypothesized to stronglyinfluence year-to-yearvariabilityin leafhopper abun-dance. Degree-day accumulations by30June correlated well with degree-days by 1August and may provide a useful early-warningsystem for predicting years in which leafhopper pop-ulation densities are above average.
KEY WORDS Erythmneura C011WS, phenology model, diapause, grapes, pest management
FROM THE LATE 1940s through the mid-1980s, routine insecticide applications based on calendar date and vine phenology relegated eastern grape leafhopper, Erythroneura comes (Say) to the status
of a minor pest that was incidentally controlled by insecticide applications directed at the grape berry moth, Endopiza viteana Clemens (Taschenberg 1973). Recent adoption of integrated pest manage-ment (IPM) practices such as Grape Berry Moth Risk Assessment (Martinson et al. 1991) and pher-omone mating disruption (Dennehy et al. 1991) by grape growers in New York and Pennsylvania has reduced pesticide inputs directed at grape berry moth and led to reemergence of this pest as an economic concern, prompting an interest in factors influencing its population ecology and manage-ment.
Historically, E. comes was considered to be the most important and devastating pest of 'Concord'
Vitis labruscana Bailey grapes, particularly in the
lake Erie region of New York, Ontario, and
Penn-1Currentaddress:Departmentof Entomology,Universityof
Arizona,Tucson,AZ85721.
sylvania (Slingerland 1904, Johnson 1914, Eyer 1931, Taschenberg and Hartzell 1949). From the late 1800s to the 1940s, observers noted that leaf-hopper outbreaks tended to occur in cycles of 2-3 yr, followed by several years in which populations failed to reach economically important levels ex-cept locally (Johnson 1914, Eyer 1931, Taschen-berg and Hartzell 1949).
The life cycle of E. comes suggests that these variations in year-to-year abundance early in the century may have been governed by temperature-driven shifts in phenology, coupled with early onset of reproductive diapause. E. comes overwinters in the adult stage in border areas and enters vine-yards shortly after budbreak. After completing postdiapause development, overwintered adults enter into an extended oviposition period lasting up to 8 wk (Johnson 1914), producing a 1st brood of nymphs. Because of a relatively extended de-velopmental time for eggs and nymphs, adults of the 1st brood typically begin appearing only in mid-July. Early 1st-brood adults become reproduc-tively mature and oviposit from late July through late August (Johnson 1914). However, Johnson's 0046-225X195/1504-1514$02.(lO/O © 1995EntomologicalSocietyof America
December 1995 MARTINSON AND DENNEHY: PHENOLOGY OF E. comes 1505
(1914) detailed observations ofleafhopper phenol-ogy showed that nymphs maturing after 27 July entered into reproductive diapause. This early on-set of reproductive diapause means that the time between appearance of reproductively active Ist-brood adults and the onset of reproductive dia-pause is short. Thus, small shifts in phenology as-sociated with variability in temperature accumu-lations could greatly influence the size of the 2nd brood and the amount of late-season injury. Pre-dicting temporal occurrence of leafhopper ovipo-sition and nymphal development would be useful in pest management, not only for timing sampling and intervention, but also for assessing the risk that late-season population growth would cause eco-nomic injury.
We describe a phenology model that uses ther-mal unit accumulations and photoperiodic induc-tion of diapause to predict timing of leafhopper population development. We first report experi-ments in which the timing of reproductive dia-pause initiation was estimated. We then use data from Johnson's (1914) observations of leafhopper phenology in 1912 to estimate degree-day accu-mulations necessary for stage-specific development. We then compare predictions from the phenology model with field data collected in 1991 and 1992. Finally, we use the model to explore the relationship between temperature accumulations and late-sea-son population dynamics.
Materials and Methods
Laboratory Photoperiod Experiments. Potted 'Concord' vines with 6-10 leaves were placed for 24 h within a laboratory colony of reproductively active
E. comes for oviposition. This colony of =100 adults
had been reared for 1 generation at 21 ± 2DCand a photoperiod of 16:8 (L:D) h. Each plant, infested with <24-h-old eggs, was removed from the colony, and placed within reach-in environmental chambers (Percival, Boone, IA) maintained at 21DC,with pho-toperiods of 16:8, 14.5:9.5, 13.5:10.5, or 12:12 (L: D) h. Five separate cohorts of eggs were established in the chambers with 16:8 and 12:12 (L:D) h pho-topcriods and 3 cohorts of eggs were established in the chambers with 13.5:10.5 and 14.5:9.5 (L:D) h photoperiods between 1 June and 24 July, 1991. Leafhoppers were reared to adulthood in the cham-bers. Five to 8 d after molting to adults, leafhoppers were aspirated into vials, and pairs of male and fe-male leafhoppers were transferred to mesh-covered clip cages (6.5 cm diameter, 3.5 cm deep). The clip cages were attached to leaves of potted Concord vines, with leafhoppers on the abaxial leaf sunace. Five to 20 pairs of leafhoppers were established from each cohort. Plants with 5-7 clip cages were then placed in a rearing room at 21 ± 2DCand 16: 8 (L:D) h. After 7-10 d, cages and leaves were re-moved from the vines and checked for the presence of live leafhoppers. Units in which the female was alive were retained, and those with dead females
were discarded. Leaves were cleared for 24 h in 95% ethyl alcohol, and eggs were counted. The pro-portion of units with eggs and the mean (±SD) number of eggs per day were calculated using data pooled from all cohorts.
Field Oviposition Experiment, Adult leafhop-pers or 5th-instar nymphs were collected in the field weekly from late July to late August, placed in clip cages, and allowed to feed and oviposit for 14 d. Leafhoppers were collected from Concord vines with an aspirator and placed (in groups of 10) into mesh-covered clip cages (6.5 cm diameter, 3.5 cm deep) on the abaxial side of Concord leaves with no visible feeding injury. Ten to 20 clip cages were set up on each date. In 1991, clip cages with 5th-instar nymphs were set up weekly from 29 July to 3 Sep-tember, and cages with adults were set up from 29 July to 10 September. In 1992, cages of adults were set up on 13 July, 27 July, and weekly thereafter until 31 August. Mter 14 d, leaves and cages were removed from vines and brought to the laboratory, where the numbers of live males, dead males, live females, and dead females were counted. Leaves were placed in 95% ethyl alcohol for 24 h to clear them, and eggs were counted. Proportions of cages with leafhopper eggs and the mean number of eggs per female per day were calculated for each sam-pling date.
Reproductive Status of E. comes Females. Adult E. comes were collected weekly from a vine-yard near Geneva, NY, during 1992 and 1993 and dissected to determine their reproductive status. Collections were made from 1 May through 3 Sep-tember in 1992. In 1993, collections were made from 7 July to 15 September. On each sampling date, leafhoppers were collected with gasoline-pow-ered leaf vacuums (Homelite, Charlotte, NC), and transferred to vials containing 70% ethyl alcohol for preservation and later processing. Twenty females were randomly selected from each sample and dis-sected to determine their ovarian development. Fe-males were classified as gravid if at least one fully developed egg with clearly visible chorion was pres-ent, or nongravid if no eggs were visible. Thus, these dissections were able to distinguish between gravid and nongravid females, which could be either prereproductive females or females that were in re-productive diapause. Proportions of gravid females and 95% CI based on binomial sampling error were calculated for each sampling date. Expected pro-portions of gravid and nongravid females were cal-culated from simulations made with the phenology model (described below), using 1992 and 1993 weather data, and were compared with observed proportions.
Phenology Model Structure. The phenology model simulates development and reproduction of a population ofE. comes over the course of a
grow-ing season, as affected by temperature and diapause induction. The time steps of the model are in de-gree-days (base lODC),and simulations are based on minimum and maximum daily temperatures
col-lected at field sites. A conversion table is used to convert cumulative degree days to Julian dates.
The duration of each developmental stage (eggs, nymphs, adults) is modeled using distributed delays (Manetsch 1976). Distributed delays use 2 param-eters, del and k, to simulate both the mean and variance of time-consuming processes. The param-eter del is the mean time spent in a delay. The pa-rameter
k
(an integer) denotes the order of differ-ential equations describing the rate at which individuals complete the delay. The variance of time spent completing a particular process in the delay is equal to del2/k.The model starts with overwintered adults. These adults, after a specified temperature accumulation (128 DD, base lO°C) is reached, complete their post-diapause development and enter into the 1st distributed delay. The 1st delay describes the mean longevity of overwintering adults after they become reproductively mature. Oviposition by adults in this stage is modeled as a function of temperature ac-cumulations. The rate of oviposition is assumed to be temperature dependent, but relatively constant throughout the life span ofE.comes adults, as found
by Johnson (1914) and Cate (1975) in his studies of
Erythroneura elegantula Osborn in California.
The eggs produced by these adults then feed di-rectly into successive delays modeling developmen-tal time in degree-days for each of the 5 nymphal instars. After passing through the 5th-instar delay, individuals enter a delay representing the preovi-positional period of adult females. Adults then ei-ther become reproductively mature and generate eggs which again pass through developmental de-lays, or they enter into reproductive diapause and do not produce any eggs. The timing of this switch is triggered by a specific calendar date. This models the assumption that diapause induction is controlled by day length, and that individuals entering adult-hood after a specific date are in reproductive dia-pause. Diapause induction probably occurs at some point during nymphal development (Cate
1975);
however the model makes no assumptions about when this occurs.
Model Parameters. Temperature accumulations were based on a developmental threshold of lO°C. This developmental threshold has not been deter-mined experimentally, but corresponds well with that determined by Cate (1975) for E. elegantula. Cumulative degree-days were calculated starting 1 April, which is the earliest time at which tempera-tures above the thermal minimum occur under New York climatic conditions.
Estimates of stage-specific temperature accumu-lations required for development (Table 1) were de-rived from data presented by Johnson (1914). In that study, Johnson reports detailed observations of developmental times of eggs and all nymphal stages, as well as longevity and fecundity of adults. These observations included starting and ending dates for all developmental stages of 114 individual nymphs and cohorts of eggs (n =312) deposited during
sev-Table I. Parameters used to model stage-specific de-velopment (degree-days above IO°e) of E. cornea
Developmental stage Degree-days± kb
S[)<1 Egg 208 ± 63 10 Nymph 1st instar 57 ± 13 19 2nd ins tar 46 ± 13 12 3rd instar 45 ± 11 17 4th instar 53 ± 12 19 5th instar 88 ± 14 39 Total 287 ± 27 Adult Postdiapause development 128 ± 28< 21 Preovipositional period 83 ± 17< 24 Avg length of ovipositional period 333 ± 111< 10 Date of diapause induction 1 August
aEstimates based on data on developmental time of individual leafhopper eggs (n =312) or nymphs (n =116) (Johnson 1914). bParameter denoting the order of differential equations used in simulation model to model variance of developmental time.
< Estimates based on descriptive data.
eral 24-h periods. Using these starting and ending dates along witl} weather data also reported in John-son (1914), we were able to estimate developmental time in degree-days for individual eggs and each of the 5 nymphal instars. From these degree-day es-timates, we calculated mean (± SD) developmental time in degree-days (base W°C), which are shown in Table 1.
Certain parameters, such as adult longevity in de-gree-days, and thermal accumulations required for preovipositional development, were not reported in detail by Johnson (1914). However, we assumed a preovipositional period (at a constant temperature of 21°C) of 7 d (83 ± 17 DD), and a 30-d (333 ±
111 DD) life span of reproductive females, based on observational data (Johnson 1914).
Stage-Specific Development in Field Popula-tions in 1991 and 1992. To validate the temper-ature-driven phenology model, we made stage-spe-cific counts of E. comes at 4 Concord vineyards in central and western New York during 1991 and 1992. These 2 growing seasons represented ex-tremes from prevailing climatic conditions. In 1991, 1611 DD (14% above average) were recorded over the course of the growing season. In 1992,1236 DO (13% below the long-tenn average) accumulated. In 1991, stage-specific nymphal counts were made at 2 vineyards in the Lake Erie region (Rammelt and Westwind) and at 2 in central New York (Erickson and Robbins Farm). In 1992, data were collected at 3 Lake Erie vineyards (Rammelt, Westwinds, and the Vineyard Laboratory) and 1 central New York vineyard (Erickson). At each of these vineyards, 20-leaf samples were collected and brought to the lab-oratory, where counts of each nymphal instar were made under dissecting microscopes. Each vineyard was sampled from 1 June through 30 September. Samples were taken twice weekly until early-instar nymphs were detected, and weekly thereafter.
Tem-December 1995 MARTINSON AND DENNEHY: PHENOLOGY OF E. comes 1507
perature data was collected at weather stations lo-cated <5 Ian from each vineyard. Stage-specific counts from each week were then examined, and data for each nymphal instar were separated into Ist- and 2nd-generation trends by finding the lowest number sampled between 2 successive population peaks. For most sites, this division was clear from examination of the data. However, during the cool 1992 season at Vineyard laboratory, Rammelt, and Westwind, separation of the 2 generations was somewhat more subjective because of an extended midseason period with low counts. At Erickson in 1992, only 1 distinct population peak was observed. Weekly sample counts for each nymphal instar were converted to cumulative proportions of the to-tal number sampled in each brood to provide a common scale for comparing observed population trends with those predicted by the phenology mod-el. For each sample date, cumulative proportion
(Pjk) of weekly stage-specific counts (Cij) over the course of the growing season (n samples taken) by sthe kth sample date were calculated for each de-velopmental stage j, using the following formula:
k
LC"
i~l I} Pjk =-n-LC"
i=1 I}Similar proportions were calculated from predic-tions generated from the phenology model, using temperature data from 1991 and 1992 for each vineyard site. Cumulative proportions from the field data and model predictions were compared by plot-ting cumulative proportions (observed and predict-ed) against calendar date for each site and year.
Degree-Day Accwnulations and Late-Season Population Growth. To determine how year-to-year variability in temperature accumulations in New York growing regions might influence late-sea-son population dynamics, simulations were run us-ing 30 yr of weather data from the 1963-1993 grow-ing seasons in western and central New York. Data for western New York were taken from a weather station at the Vineyard laboratory in Fredonia, NY. For central New York, data were taken from the N.Y. State Agricultural Experiment Station at Ge-neva. For each simulation, the parameters previ-ously described (Table 1) were used. The number of 1st-brood leafhoppers entering diapause (matur-ing after 1 August) and the number becom(matur-ing re-productively mature (maturing before 1 August) were recorded. From these simulation results, the percentage of 1st-brood adults in diapause was cal-culated as a function of degree-day accumulations by 1 August. For each simulation, the total number of Ist- and 2nd-brood nymphs produced in the sim-ulation was recorded. The ratio of 2nd-brood to 1st brood adult leafhoppers at the end of the season (1 October) was then calculated as a function of de-gree-day accumulations by 1 August. The model as-sumed that mortality factors acting on the nymphal
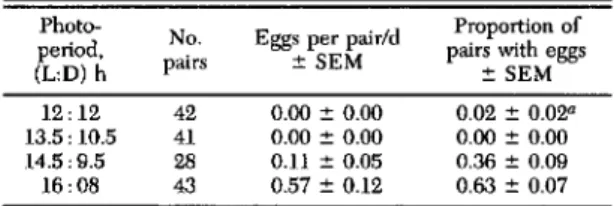
Table 2. Oviposition of E. comes reared from eggs at different pbotoperiods
Photo-No. Eggs per pair/d Proportion of
period, pairs with eggs
(L:D) h pairs ± SEM ± SEM
12: 12 42 0.00 ± 0.00 0.02 ± 0.02a 13.5: 10.5 41 0.00 ± 0.00 0.00 ± 0.00 14.5: 9.5 28 0.11 ± 0.05 0.36 ± 0.09 16:08 43 0.57 ± 0.12 0.63 ± 0.07 aOne egg was found in 1 cage.
and adult population were constant throughout the growing season.
Degree-day accumulations by 30 June and 1 Au-gust were also recorded, and 1 AuAu-gust degree-days were regressed on 30 June degree-days, to deter-mine whether degree-day accumulations at the onset of reproductive diapause could be predicted accurately by degree-day accumulations in mid-June.
Results
Laboratory Photoperiod Experiments. Rearing leafhoppers at different photoperiods ranging from 16:8 to 12:12 (L:D) h influenced both the mean number of eggs per pair and the proportion of pairs with eggs (Table 2). Sixty-five percent of pairs reared with a 16-h photophase produced an average of 0.57 eggs per day. Only 35% of pairs reared at 14.5:9.5 (L:D) h oviposited, and the mean number of eggs per pair per day dropped to 0.11. Leafhop-pers reared at photophases of <13.5 h did not ovi-posit. This experiment demonstrated that photope-riod is associated with the onset of reproductive diapause inE. comes, as is the case with the closely
related western grape leafhopper E. elegantula
(Cate 1975).
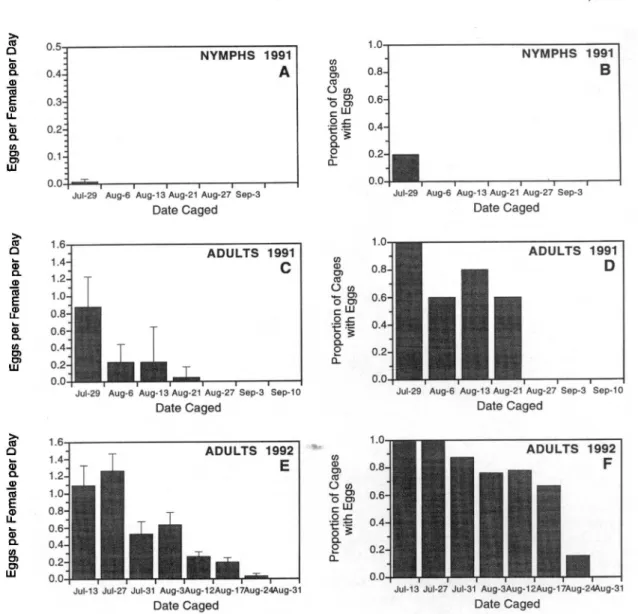
Field Oviposition Experiment. In both the 1991 and 1992 experiments that measured oviposition of field populations of E. comes, oviposition as
mea-sured by changes in the mean number of eggs ovi-posited per adult per week began to decline be-tween the last week in July and the 1st wk of August (Fig. 1 C-E). In 1991, eggs per female per cage dropped from O.9/d for individuals caged on 29 July to O.2Id for those caged on 6 August. No further oviposition was observed in cohorts caged on 27 Au-gust or later. Fifth-instar nymphs caged during the same weekly intervals produced eggs only on 29 July, and none thereafter (Fig. lA). In 1992, the rate of oviposition per female declined more gradually (Fig. IE). Cohorts caged on 27 July produced 1.3 eggs per female per day. Cohorts caged on the fol-lowing week (3 August) produced an average of 0.5 eggs per day. The rate of oviposition declined there-after until 24 August, there-after which no oviposition was noted. In both years, representing dramatically dif-ferent degree-day accumulations, oviposition ceased by 24-27 August.
>-III 0.5 1.0 0 NYMPHS 1991 NYMPHS 1991
~
m A CD 0.8B
a. 0.4 0> Q) Clla;
Om E 0.3 _0>00> 0.6 Q) c::W U.~
0.2 :e:t::o.£:: 0.4 a. 0;: til c-O> 0.1 0 0.2 0> It W 0.0-=
, , 0.0Jul-29 Aug-6 Aug-13 Aug-21 Aug-27 Sep-3 Jul-29 Aug-6 Aug-13 Aug-21 Aug-27 Sep-3
Date Caged Date Caged
>- 1.0 Cll 1.6 0 ADULTS 1991 ADULTS 1991 Qj 1.4
C
mCD 0.8D
c- O> CD 1.2 Clla;
Om 1.0 _0> 0.6 E 00>If.
0.8 c::W o.£::~
0.6 t·1:::: 0.4 c- o;: til 0.4 c-O>e
0.2 0> 0.2 a.. W 0.0 0.0Jul-29 Aug-6 Aug-13 Aug-21 Aug-27 Sep-3 Sep-10 Jul-29 Aug-6 Aug-13 Aug-21 Aug-27 Sep-3 Sep-10
Date Caged Date Caged
~
1.6 1.0 0 1992 ADULTS 1992 Qj 1.4E
mCD 0.8F
0> a. 1.2 Cll CD Om iii 1.0 _0> 0.6 E 00>If
0.8 c::o.£::W 0.4 0.61:
:!:: Qj 0;: a. 0.4 c-o 0.2 (II It Cl 0.2 Cl W 0.0 0.0Jul-13 Jul-27 Jul-31 Aug-3Aug-12Aug-17Aug-24Aug-31 Jul-13 Jul-27 Jul-31 Aug-3Aug-12Aug-17Aug-24Aug-31
Date Caged Date Caged
Fig. 1. Ovipositionbycohorts ofE. comes sampled from field populations and confined for14d in clip cages.
Oviposition rates(A, C, E) and proportion of cages with2:1egg(B, D,F;n = 10-20 cages per date) are shown.
The probable entry of diapausing females into the population is also indicated by changes in the proportion of experimental units in which eggs were detected (Fig. 1 B, D, and F). Because each unit had a cohort of 2-8 females confined for 14 d, ab-sence of oviposition probably indicated that all fe-males in the cages were in reproductive diapause. In 1991, eggs were detected in all of the 29 July units (Fig. ID). On the next sample date (6 August), we detected eggs in only 60% of the sample units. Similarly, in 1992, we found eggs in 100% of the units from the 13 July and 27 July cohorts (Fig. IF). Starting with the 31 July cohort, however, the pro-portion of units in which eggs were found declined gradually through mid-August.
These patterns are consistent with the entry of females in diapause into the population starting be-tween the last week in July and the 1st wk in Au-gust. Because females were not individually caged,
we were not able to demonstrate whether the over-all decline in egg production per female was caused by lower output per reproductive female or the re-sult of steadily declining proportions of reproductive (nondiapause) females in the population from which we were sampling. However, the gradual decline in oviposition rates and in the proportion of units with eggs is consistent with survivorship of early-matur-ing females through late Augnst and with an in-creasing proportion of diapausing females in the population starting in early August. Failure of 5th-instar nymphs caged after 6 August to oviposit (Fig. IB) supports the hypothesis that leafhoppers molt-ing to adulthood after early August entered repro-ductive diapause.
Reproductive Status of E. comes Females. In
1992, the proportion of gravid females rose sharply in early June following postdiapause development of overwintered females. It remained at 100%
Fig.2. Proportionof gravidE. comes femalesin field populationsin1992 (A) and1993 (B), determined by dis-section. Solid lines indicate proportion(±95% binomial confidenceinteIVal)obselVed;dashed lines indicate ex-pected proportionsdetermined through simulation.
through late June and July, and began to decline after the 27 July sampling period (Fig. 2A). Pro-portions of gravid females rose between the 3 Au-gust and 10 AuAu-gust samples and subsequently de-clined sharply through late August. In 1993, decline in the proportion of gravid females started in mid-July, and proceeded more gradually than in 1992 (Fig 2B). After declining in mid-July, proportions rose briefly on 27 July and declined thereafter through late August.
Trends in these data were consistent with those of the field oviposition experiment (Fig. 1), and also suggest that the onset of reproductive diapause oc-curs in late July to early August. It is important to note that our dissections distinguished only gravid from nongravid females. Our population of non-gravid females undoubtedly comprised varying mixtures of prereproductive females that subse-quently became gravid, and diapausing females. The difference in trends between 1992 and 1993 probably reflects differences in degree-day accu-mulations among the 2 yr that slowed population development in 1992. In 1992, 1st-brood adults did not begin to appear until the end of July. Thus the 1992 trend probably reflected progressive increases in proportions of females that had entered repro-ductive diapause. In 1993, 1st-brood adults began to appear in the 2nd wk in July. The earlier, more gradual decline in proportions of gravid females was probably caused by entrance into the population of
1509
prereproductive females that later would become gravid.
Phenology Model and Observed Phenology.
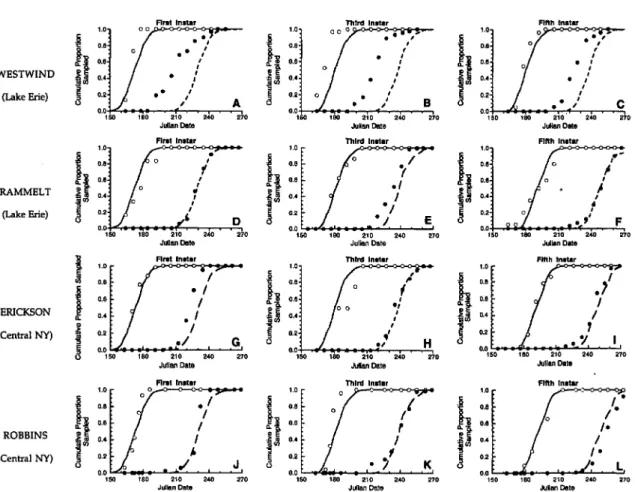
Observed population trends corresponded well with predicted population trends derived from the phe-nology model (Figs. 3 and 4). In 1991, temperature accumulations through 1 October were 1,531 DD (base lOOC) in central New York, and 1,611 DD in western New York, 15% above average. As a result of unseasonably warm temperatures in May and June, development of nymphs was accelerated in comparison with other years. However, predictions from the phenology model for both 1st- and 2nd-brood nymphs corresponded closely with observed population trends at Rammelt, Robbins, and Erick-son (Fig. 3 D-L). At Westwind, observed trends were consistently shifted earlier than those predict-ed by the model (Fig. 3 A-C). Particularly for 2nd-generation nymphal counts, observed trends were =14 d earlier than predicted trends. We attribute this discrepancy between observed and predicted trends to environmental conditions at the experi-ment site. This vineyard, planted in soils with low water-holding capacity, was subjected to severe moisture stress caused by low rainfall from mid-June through harvest. We hypotllesize that the wa-ter stress resulted in increasingly severe mortality of all life stages as the growing season progressed. As a result, egg, nymphal, and adult population densi-ties were reduced in the latter part of the growing season relative to the early part of the season. TIllS heavy mortality would shift the observed cumulative proportions of nymphal populations to earlier in the season, resulting in apparently earlier phenology than that predicted by the model. In the remaining vineyards in both central and western New York, timing of cumulative frequency of instar-specific densities was predicted closely by the model.
In 1992, seasonal thermal unit accumulations were 1,054 in central New York and 1,236 in the Lake Erie region, = 15% below average degree-day accumulations. However, during 1992, the predict-ed 1st-generation population trends also closely agreed with observed trends (Fig. 4 A-I) in both central and western New York. Predictions for 2nd-brood population trends were more variable. We believe this in large part to be because the 2nd gen-eration, though distinctly observable in western New York vineyards, was very small. Furthermore, not all individuals in either the simulation or field sampling had completed development by 30 Sep-tember, which was the termination date for both the model and field sampling. Notably, differences in cumulative degree-days in central and western New York were substantial, and the model correctly pre-dicted a single generation for the central New York vineyard, and a small 2nd generation in the 3 Lake Erie vineyards.
Predicted Timing of E. comes Development.
Thermal unit accumulations required for leafhopper development and av.erage dates at which these ac-cumulations occur in the central New York and 270 A S 1993 A S 1992 J J
MARTINSON AND DENNEHY: PHENOLOGY OF E. comes
J J 180 210 240 270 JULIAN DATE 180 210 240 JULIAN DATE 150 M 1.2
B
fJ) 1.0 Z~ 0< 0.8-~
I-W C:u. 0.6 ~Cl 0- 0.4g:~
~
0.2 0.0 120 December 1995 1.2A
M fJ) 1.0 Z~ 0< 0.8-~
I-WC:u.
0.6 ~Cl 0- 0.4g:~
~
0.2 0.0 120 150Flm Inatar Ftfth lnat., 1.0
~
1.0 1.0 0~
~
00,
II
00 , 0 .• o , 0 .•,
0 .•,
fI
00,
h
f f,
,
,
0 .•,
,
..•..
0 ••,
,
0 .• 0,
I WESTWIND 0.' 0,
U
0.',
0.' I,
,
0,
~
,
~
,
f (LakeErie) 0.' o·,
,
0.' 0,
0.',
A 8,
B <3..
,
,
c
,
,
0.0 0.0 "0 "0 .70 160 '40 '70 150 '60 .,0 '40 27DJulian Dat. Julian Dote
Firat Inl1., third Inlt.r FIfth In.tar
1.D 1.D 1.0
Ii
•
i
/I
.-0 .•,
0 .• D.•,
'/~
f D.•,
0 .• D.•,
f"I
.1~I
~
RAMMELT D.'•
,
1
0 0.' I 0.',
,
.,
•
(LakeErie)~
D.' I 0.'S
D.2,
,
0 .J E 0" F D.O 0.0 D.O 160 ,.0 "0 240 '70 160 .40 270 160 .40 270 Julian OIIteI
Rrllt Inl1., third Inlt., Fifth lnatar1.D I.D 1.D
t
t
,
h
0,' D.• 0 .• I'..•
~
0 .• • If
I •.i 0 .•,
D.• II
.•..
.,
ERICKSON D.' o If!
0.',
I...
Ii
I fj
,
(CentralNY) 0.' D.'.'
D.' ./ G 0.,
H.~
d
0.0 0.0 "0 •• 0 '70 160 •• D 27D 160 •• 0 270 Julian DateFll'llt In••• ' third Inlt.r
1.0 1.0 1.0
i
D.• • I~
D.•/
i
0 .•II
IIi
D.• I D.•r
•.i D.• ROBBINSI
D.' I 0.' Ii
1
OA (CentralNY) D.' 10 D.2 f !i D.2 .I J 0 oi
K 0 L 0.0 M "0 240 '7D 160 240 270 ,.0,
..
"D .40 270Julian Date okIlon Dot.
Fig. 3. Comparison of observed and predicted cumulativeproportions of 1st-, 3rd-, and 5th-instarE. comes nymphs observed in 4 vineyards in 1991. Lines indicate cumulative proportions of 1st-brood (solid lines) and 2nd-brood (dashed lines) nymphs predicted through simulation. Observed cumulative proportions of 1st-brood (open circles) and 2nd-brood (shaded circles) nymphs are shown.
Lake Erie growing regions are shown in Table 3. Degree-day accumulations by 1 August average 851
::!: 77 in the Lake Erie region, but only 792 ::!: 69 in central New York. As a result, dates predicted for completion of developmental stages in central New York lagged 5-10 d behind those of Lake Erie. No-table was the fact that the timing of adult emer-gence was extremely close to the hypothesized 1 August date for initiation of reproductive diapause. The model predicted that 10% of 1st-brood nymphs would enter adulthood by 29 July (central New York) or 25 July (western New York), only 2-7 d before the hypothesized initiation of reproductive diapause. Thus, it is clear that in seasons with av-erage temperature accumulations, a large propor-tion of 1st-brood E. comes enter into reproductive diapause.
Degree-Day AccwnulationB and Late-Season
Population Growth. Simulations run with weather
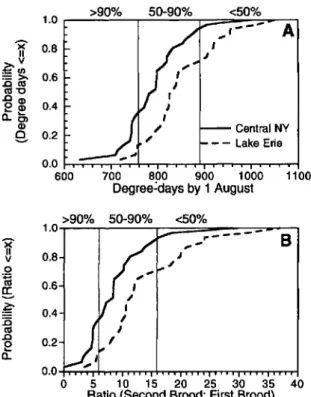
data from 1963 to 1993 showed substantial varia-tion in degree-day accumulavaria-tions by 1 August (Fig 5A). Degree-day accumulations ranged from 615 to 1,005 in central New York and from 710 to 1,300 in the Lake Erie region. Over the range of 30 yr, degree-day accumulations averaged =50 DO
less in central New York than in the Lake Erie region. Notably, these data indicate that years with <760 DO, which would result in >90% of Ist-brood adults entering into reproductive diapause, occurred 35% of the time in central New York but only 10% of the time in western New York. At the other extreme, years with >890 DO by 1 August occurred 30% of the time in western New York, but only 5% of the time in central New York. Ac-cording to model predictions, >50% of 1st-brood adults would become reproductively active under these conditions. In both regions, however, about the same proportion of years (55% in western New York and 60% in central New York) had degree-day accumulations between 760 and 890 DO by 1 August, which would result in 50-90% of adults entering into reproductive diapause.
The potential effect of variation in the propor-tion of 1st-brood adults entering diapause was as-sessed by calculating the ratio of 2nd-brood leaf-hoppers to 1st-brood leafleaf-hoppers under prevailing degree-day accumulations (Fig. 5B). With low temperature accumulations «760 DO), the po-tential population increase was <5:1; with average accumulations (760-890 DO), the potential ratio
December 1995 MARTINSON AND DENNEHY: PHENOLOGY OF E. comes 1511
FIrat Inat., Third Inatar Fifth Inlter
1.0. 1.0. 1.0.
,
it
/t
Ii
0.8,
0.8 0.8,
0.8,
~i
0.8 0.8,
':;~
.1 WESTWIND G.' /.I~
G.'j~
G.' (Lake Erie) / Ia
0.' E 0.'a
0.'·'e
,.
A 8 B 0..0. M 0..0. 1•• .40 .70 100 leo. 270. 150. 180 .40 270.F1rat Inmr TlIlrd In.lair
1.0 1.0 Q / 1.0
,
t
/ 11 0~
G.e 0..8,
0..8,
/ ~1 RAMMELTil
0.8,
0.8,
0.8.,
(Lake Erie) G.'..
,
/U
G.' • I,
~l
0.' II
Ij
0.',
~
0.2,
0.''F
D E 0.0 0.0 0..0. 270 1•• 240 270 150 180 "0. .40 270.,
..
.eo .40 Julian Oa!eF1~t
In".'
Third In.tar Fifth Inetar1.0. 1.0. 1.0.
i
0.8,
/ .~ 0.8 ./,
~
0.8P
II
VINEYARDit
0..8'.
0..8,
0..8 LAB 0.' / 0" .III
G.' (Lake Erie) /.,
0.2 0.2.,
0.2 d 'i G d H 0..0. 0.0 0..0. 150. .40 .70. 150. 180 240 270. 160. 180Flr.t Inmr Tl1lrd Inm. Fifth I•••••••
1.0 1.0 1.0.
II
0.8t
o.e~
0.8 ERICKSON 0..8 ~1 0..8 ~10..8 (Central NY)I
G.'jl
G.'H
G.' .;a
G.' 0..2j
0.2 J 0..0 0.0 0.0 1•• •• 0 .70 100 180. 150. leo.Fig. 4. Comparison of obselVed and predicted cumulative proportions of 1st-, 3rd-, and 5th-ins tar E. comesnymphs observed in 4 vineyards in 1992. Lines indicate cumulative proportions of 1st-brood (solid lines) and 2nd-brood (dashed lines) nymphs predicted through simulation. Observed cumulative proportions of 1st-brood (open circles) and 2nd-brood (shaded circles) nymphs are shown.
Table 3. Model predictions of degree-day accumulations for completion of E. comes development and average date at which degree-day accumulations occur in central New York and Lake Erie growing regions
Cumulative % of brood in stage
Parameter Stage 1st brood 2nd brood
10% 50% 90% 10% 50% 90% Degree-days" Egg 250 389 556 917 1,506 1,222 1st inStar 403 528 667 1,056 1,194 1,333 5th instar 611 750 889 1,264 1,389 1,486 Nyrnphb 472 653 819 1,139 1,306 1,458 Adult 761 889 1,028 1,292 1,403 1,486
Avg date in central N .Y.c Egg 11 June 26 June 12 July 13 Aug. 27 Aug. 19 Sept. 1st instar 27 June 9 July 21 July 27 Aug. 12 Sept.
5th instar 16 July 28 July 10 Aug. 26 Sept. Nymphb 5 July 20 July 3 Aug. 5 Sept. Adult 29 July 10 Aug. 24 Aug. 1 Oct.
Avg date in western N.y.d Egg 7 June 21 June 6 July 5 Aug. 17 Aug. 4 Sept. 1st instar 22 June 4 July 15 July 17 Aug. 31 Aug. 17 Sept. 5th instar II July 22July 3 Aug. 8 Sept. 25 Sept.
Nymphb 29 June 14 July 28 July 26 Aug. 12 Sept. 1 Oct. Adult 24 July 3 Aug. 15 Aug. 10 Sept. 26 Sept.
aBase 10·C. bAll instars.
CBased on weather data from 1963 to 1993 at N.Y. State Agricultural Experiment Station, Geneva.
Discussion
of 2nd-brood to 1st-brood leafhoppers was be-tween 5:1 and 16:1. In years with >890 DD, how-ever, the ratio ranged from 16:1 to 35:1.
Fig. 5. (A) Cumulative distribution of degree-day
(base lODe) accumulations by 1 August derived from
1963-1993 weather data at Fredonia (Lake Erie region) and Geneva (central New York), New York. (B) Predicted
maximum ratio of 2nd-brood to 1st-brood E. comes.
Numbers at top indicate expected proportions of 1st-brood E. comes entering reproductive diapause.
population dynamics and for predicting timing of population development for pest management pur-poses.
The model clearly demonstrates that only a small fraction of 1st-brood E. comes completes de-velopment in time to become reproductively ma-ture and produce a 2nd brood in New York. Total developmental time, from egg to egg, requires an average of 623 DD. With postdiapause develop-ment of overwintered adults included, we estimate that at least 710 DD are required to produce re-productively active 1st-brood adults. Our experi-mental evidence, and that of Johnson (1914), in-dicates that diapause induction occurs between the last few days in July and the 1st wk of August. Therefore, an important factor limiting potential population growth in New York conditions is the relatively short time between the appearance of 1st-brood adults and the onset of reproductive dia-pause around 1 August. Average accumulations of 792 (central New York) to 861 (Lake Erie) DD by this date suggest that in average years, between 60 and 75% of 1st-brood adults enter reproductive diapause.
The short period between maturation of early 1st-brood adults and the photoperiodic-mediated initiation of diapause, however, suggests that the potential size of the 2nd brood can vary tremen-dously with small changes in degree-day accumu-lations that accelerate or delay development. Ex-amination of year-to-year variability in weather data suggests that >90% of 1st-broo~ E. comes en-ter reproductive diapause in 10% (Lake Erie) to 35% (central New York) of the years. In these years, the potential for late-season population growth and subsequent heavy foliar injury would be low. At the other extreme, in 5% (central New York) to 30% (western New York) of the past 30 yr, the expected proportion of 2nd-brood adults in reproductive diapause was <50%. Under these conditions, the potential for rapid late-season pop-ulation growth and severe foliar injury would be great.
We examined degree-day accumulations by 1 August from Erie, PA, between 1900 and 1925, during which 3 outbreak periods (1901-1904, 1909-1912, and 1921-1925) were reported to have occurred in the Lake Erie region (Slingerland 1904, Hartzell 1912, Johnson 1914, Eyer 1931). Results (Fig. 6) show that during each leafhopper outbreak, degree-day accumulations we)] in excess of 760 occurred during the year preceding or the 1st yr of the reported outbreak. Although other factors (notably low amounts of rainfall during the early part of the growing season) (Eyer 1931) were hypothesized to be associated with outbreaks, it is likely that higher-than-average thermal accumula-tions were a major factor associated with the onset of these outbreaks.
As growers in New York adopt IPM practices that have greatly reduced the application of rou-tine insecticide sprays to vineyards, a major con-<:50%
...'---
A
Central NY - - lake Erie 50-90% 700 600 900 1000 1100 Degree~days by 1 August >90%We have shown that a simple model based on ReId-collected data from 1912 was able to accu-rately predict the timing of population develop-ment ofE. comes in 2 growing regions in New York
during 1991 and 1992. The 2 major assumptions of the model are that (1) the rate of development is linearly related to temperature, and that (2) Ist-brood adults emerging before a specific date (1 August) become reproductively active, whereas those maturing after the date enter reproductive diapause. These assumptions undoubtedly simplifY how these 2 factors function in influencing phe-nology and population dynamics. Nevertheless, they were able to accurately predict seasonal tim-ing of instar-specific development in 2 growtim-ing seasons representing extremes in temperature ac-cumulations under New York climatic conditions, except in 1 vineyard with severe water stress (Fig. 3 A-C). We therefore believe that this model, al-though simplistic, provides a good foundation for evaluating how temperature influences late-season
1.0 X- 0.6 II ~v ._ Ul 0.6 = >-.cltl ltlu .cQ) 0.4 ~Q)
o..c,
Q)e.
0.2 0.0 600 >90% 50-90% <:50% 1.0..
---
B
X-,.
.•.
II 0.6 J v 0"
~
0.6!E.
~
0.4 :0 ltl .c 0.2~
0.. 0.0 0 5 10 15 20 25 30 35 40December 1995 MARTINSON AND DENNEHY: PHENOLOGY OF E. comes 1513
Fig. 6. Degree-day accumulations by 1 August at Erie,
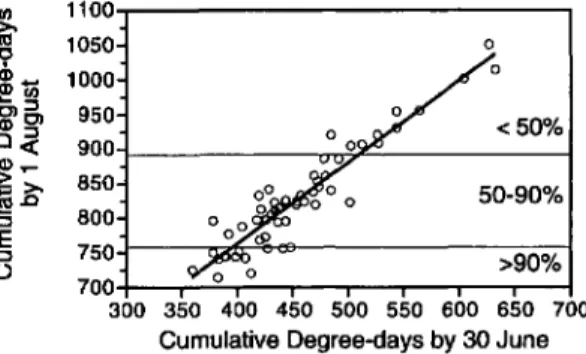
PA, from 1900 to 1925, during which 3 leafhopper out-hreaks (1901-1904, 1909-1912, and 1921-1925) were re-ported by Johnson (1914), Hartzell (1912) and Eyer (1931). >90% <50% o 50-90% 1100 1050 1000 950 900 850 800 750 700 300 350 400 450 500 550 600 650 700 Cumulative Degree-days by 30 June
References Cited
Cate, J. R. 1975. Ecology of Enjthroneura elegantula
Osborn (Homoptera: Cicadellidae) in grape agroeco-systems in California. Ph.D. dissertation, University of Califomia, Berkeley.
Dennehy, T.
J.,
L. G. Clark, andJ.
S. Kamas. 1991.Pheromonal control of the grape berry moth: an ef-fective alternative to conventional insecticides. New York's Food and Life Sci. Bull. 135.
Eyer, J. R. 1931. The relation.of temperature and
rainfall to outbreaks of the grape leafhopper,
Ery-throneura comes Say. Ann. Entomol. Soc. Am. 24:
238-259.
Hartzell, F. Z. 1912. The grape leafhopper and its
con-trol. N.Y. Agric. Exp. Stn. Geneva Bull. 344.
Johnson, F. 1914. The grape leafhopper in the Lake
Erie Valley. U.S. Dep. Agric. Bull. 19.
Jubb, G. L., Jr., L. Danko, and C. W. Haeseler.
1983. Impact of Erythroneura comes Say
(Homop-tera: Cicadellidae) on caged 'Concord' grapevines. Environ. EntomoI. 12: 1576--1580.
Mane18ch, T. J. 1976. Time-varying distributed delays
and their use in aggregative models of large systems. IEEE Transactions on Systems, Man and Cybernetics 6: 547-553.
June. Degree-days by 30 June correlate well with
degree-days by 1 August (Fig. 7, degree-day 1
Au-gust
=
291+
1.19 (degree-day 15 June), r2=
0.88). Therefore, the degree-day accumulations by
30 June could serve as a predictor of the risk of
damaging late-season population growth and allow
appropriate early intervention in years when
tem-perature accumulations indicated a large 2nd
brood was probable.
Fig. 7. Correlation of cumulative degree-days on 30
June and 1 August. Percentages indicate expected pro-portions of 1st-brood E. comes entering reproductive
dia-pause. Regression equation isy
=
291+l.19xr2=
0.88.Acknowledgments
We thank Jan Nyrop (Cornell University) and Greg
English-Loeb (Cornell University) for reviewing the
manuscript. Rick Dunst, Ted Taft, Jr., Steve Lefko, and Sara Martini (Cornell University) assisted with the field work. This work was funded, in part, by the New York Wine and Grape Foundation and Grape production Re-search Fund, and the Sustainable Agriculture ReRe-search and Education Grants Program of the USDA.
OUTBREAK 700 900 800 600 1000 1200 1100 Iii ::l Cl ::l «
1\i
en >-C§ W W II: Cl~
cern has been that leafhoppers, which were
pre-viously controlled by sprays applied for other pests,
would again become a major concern. Our studies
of leafhopper population dynamics suggest,
how-ever, that leafhoppers do not reach economically
significant population densities in most vineyards
during normal years. Recent surveys of leafhopper
population densities in vineyards without
insecti-cide treatments (Martinson et aI. 1994) showed
that seasonal population densities exceeded the
proposed threshold level of 5 nymphs per leaf in
only 2-25% of vineyards surveyed from
1989-1992. Results of our simulations suggest that
tem-perature accumulations permitting only a small,
partial 2nd generation in most years are a major
factor limiting population growth. Therefore,
area-wide, economically significant leafhopper
infesta-tions are likely to be common only in years with
above-average degree-day accumulations. The
historical data indicate that these conditions occur
only in 1-3 yr in 10 under New York climatic
con-ditions. The limiting effect of temperature also
provides a clear rationale for avoiding routine
in-secticide sprays directed at suppressing
leafhop-pers, except possibly in extremely hot years.
Degree-day estimates of E. comes phenology
~rovided by this simulation model will provide
use-ful information for management of this pest in
New York. Phenology predictions (Table 3) can be
used to time sampling and to assess the need for
insecticide applications. Timing sampling at =650
DO, midway in leafhopper nymphal development
(Table 3), would in most cases allow assessment of
peak 1st-brood nymphal populations and
interven-tion before significant foliar injury became
appar-ent.
Equally important, evaluation of degree-day
ac-cumulations during the early part of the growing
season may be useful in assessing the risk of large,
damaging 2nd-brood populations later in the
sea-son. Much of the variability in degree-day
Martinson, T. E., C.J.Hoffman, T.J.Dennehy, J.S.
Kamas, and T. Weigle. 1991. Risk assessment of
grape berry moth and guidelines for management of the eastern grape leafhopper. New York's Food and Life Sci. Bull. 138.
Martinson, T. E., T.J. Dennehy, and C.J.Hoffman.
1994. Phenology, within-vineyard distribution, and
seasonal movement of eastern grape leafhopper (Ho-moptera: Cicadellidae) in New York vineyards. Envi-ron. Entomol. 23: 236-244.
Slingerland, M. V. 1904. The grape leafhopper.
Cor-nell Univ. Agric. Exp. Stn. Bull. 215.
Taschenberg, E. F., and F. Z. Hartzell. 1949. Grape
leafhopper control-1944 to 1947. N.Y. State Agric.
Exp. Stn. Geneva Bull. 738.
Taschenberg, E. F. 1973. Economic status and control
of grape leafhopper in western New York. Search Agric. (Geneva, NY). 3.
Received for publication 22 March 1995; accepted 11