Chlorine Demand in Haitian Water Supplies
bySara Jo Elice
S.B. Environmental Engineering (2001) S.B. Urban Studies and Planning (2001) Massachusetts Institute of Technology
Submitted to the Department of Civil and Environmental Engineering In Partial Fulfillment of the Requirements for the Degree of
MASTER OF ENGINEERING
IN CIVIL AND ENVIRONMENTAL ENGINEERING
at the
MASSACHUSETTS INSTITUTE OF TECHNOLOGY
JUNE 2002
© 2002 Sara Jo Elice All rights reserved.
The author hereby grants to MIT permission to reproduce and distribute publicly paper and electronic copies of this thesis document in whole and in part.
A ti Signature of Author
Sara Jo Elice Departnf f v'iind Environme9fal Engineering
Certified by
Dr. Philip Gschwend Ford Professor of Engineering in Civil and Environmental Engineering Thesis Advisor
Certified by
Dr. E. Eric Adams Senior Research Associate in Civil and Environmental Engineering Thesis Advisor
Certified by
Daniele L nigne Lecturer, Department of C'vil and Environmental Engineering
I?
- Thesis AdvisorAccepted by , 4
m-_____________Oral Buyukozturk
MASSACHUSETTS INSTITUTE OaBukotr
OFTECHNOLOGY
I
Chairman, Departmental Committee on Graduate StudiesJUN
3 2002
Chlorine Demand in Haitian Water Supplies
bySara Jo Elice
Submitted to the Department of Civil and Environmental Engineering In Partial Fulfillment of the Requirements for the Degree of Master of Engineering in Civil and Environmental Engineering
Abstract
Gift of Water, Inc., an NGO committed to providing safe drinking water in Haiti, has developed a two bucket filtration system that uses a combination of bleach and physical filters to disinfect and purify water. Currently 5 ml of 5.25 percent bleach are used for disinfection in the top bucket, and five drops of bleach are added to the bottom bucket. For health, economic and social reasons, it would be beneficial to reduce the amount of bleach used for disinfection.
In order to establish a safe reduction of bleach it is necessary to determine the chlorine demand of Haitian drinking water supplies. Chlorine demand is the amount of bleach that must be added to achieve a desired residual concentration. This residual is based on the concentration necessary to destroy pathogens of concern over the half hour contact time that Gift of Water recommends.
During the month of January 2002, water from 13 sources in Haiti was chlorinated with 1 ml, 3 ml, 5 ml, and 10 ml of bleach and tested for free and total chlorine residuals. The water was also tested for six water quality parameters: ammonia concentration, iron concentration, temperature, pH, conductivity, and turbidity.
Chlorine residual measurements were higher than expected, most likely due to stratification in the buckets, causing some or all of the bleach in each bucket to be "held up" at the surface rather than fall to the bottom and mix along the way. Due to the high readings, the chlorine demand of the system cannot be determined from this study; However the implementation of mixing is recommended, either through the use of a third bucket to pour water onto bleach in the top bucket or by creating a paddle made of the same material as the buckets that will be used to stir the water.
Thesis Supervisor: Dr. Philip Gschwend
Title: Ford Professor of Engineering in Civil and Environmental Engineering Thesis Supervisor: Dr. E. Eric Adams
Title: Senior Research Associate in Civil and Environmental Engineering Thesis Supervisor: Daniele Lantagne
Acknowledgments
I would like to thank first and foremost Daniele Lantagne, Dr. Philip Gschwend, and Dr. E. Eric Adams, who have provided exceptional guidance and support throughout my work on this thesis. I could not have completed this project without the help of each of them. I would also like to thank everyone in the Parson's laboratory and the Department of Civil and Environmental Engineering that have provided support during my work on this project, especially John MacFarlane who has assisted me several times with all things laboratory related and Michael Pullin who got me through my last minute lab work.
There were several people who made this project possible by providing hospitality and aid in conducting fieldwork. Thank you to Phil and Barb Warwick who have made Gift of Water, Inc. a success and to Nathan and Wanda Dieudonne for watching out for our needs when we were in Haiti. I greatly appreciate the help of all of the technicians who assisted us with our field experiments.
A very special thank you must be extended to Matt Cyr who traveled around Haiti and helped more than can be imagined with everything from running experiments to staying healthy and happy.
I've really enjoyed and appreciated working with the entire H2Eau team on this
project. Thank you to Michael Borucke, Julia Parsons, and Arun Varghese.
Lastly, I want to thank all of the friends and family who have supported and encouraged me, especially my parents, Deborah and Celestino Elice, my little sis, Gianna Elice, and my fiance, Corey Gerritsen.
Table of Contents
A b stTact ... 3 Acknowledgments ... 4 List of Figures ... 6 List of Tables ... 6 1 Introduction ... 7 1.1 H a iti ... 71. 1.2 W ater Needs in Haiti ... 8
1.2 Gift of W ater, Inc ... 8
1.2.1 The Gift of W ater,, Inc. Filter Setup ... 9
1.3 Purpose of Study ... 10 2 Chlorination ... 13 2.1 Sodium Hypochlorite ... 13 2.2 Disinfectant Species ... 14 2.3 Available Chlorine ... 16 2.4 Chlorine Demand ... 17 2.5 Breakpoint Chlorination ... 17 3 Pathogens ... 20 3.1 Pathogens of Concern ... 20
3.2 M echanisms of Pathogen Inactivation ... 21
3.3 Ct values ... 22
3.3.1 Pathogen specific Ct values ... 22
4 M ethodology ... 24
4.1 Field W ork in Haiti ... 24
4. 1. 1 Description of Source Types ... 25
4.2 M ethods Utilized in Field ... 27
4.2.1 Experimental Setup ... 27
4.2.2 Chlorine Residual Testing ... 28
4.2.3 W ater Quality Parameters ... 31
4.3 Follow-up Laboratory W ork ... 33
4.3.1 Haitian W ater Testing ... 33
4.3.2 DU Series 600 Spectrophotometer ... 35
4.3.3 Stratification Experiments ... 36
4.3.4 TOC M easurements ... 37
4.4 Discussion of uncertainties ... 38
5 Results ... 40
5.1 W ater Quality Parameter Data ... 40
5.2 Chlorine Data ... 41
5.2.1 Contribution of Combined Chlorine to Total Residual ... 41
5.2.2 High Chlorine Residuals ... 43
5.2.3 Lower Chlorine Residuals ... 51
5.2.4 Time of Residual Formation ... 52
6 Conclusions and Recommendations ... 54
7 References ... 55
List of Figures
Figure 1 M ap of Haiti. ... ..-- ... ...---..-...--- -- 7
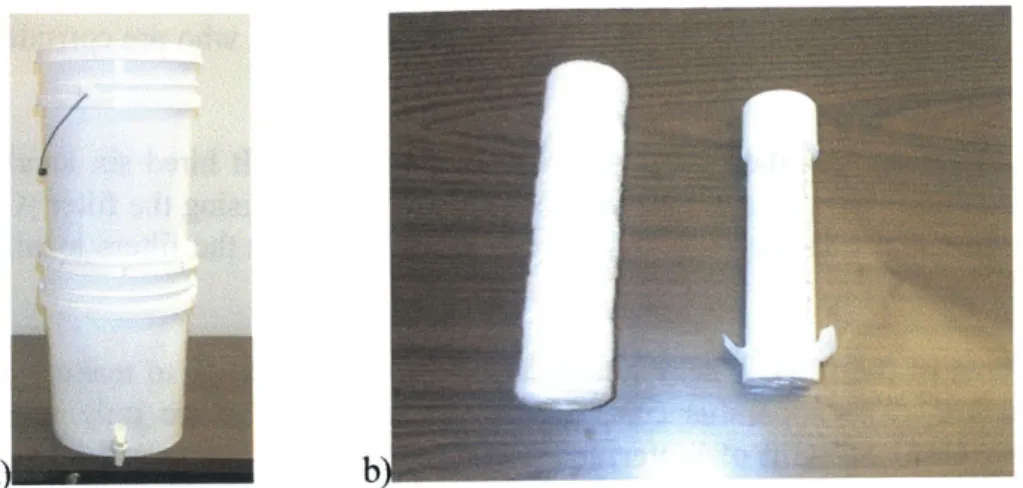
Figure 2 a) A full filtration system setup. b) The two filters used in the system, from left to right, the polypropylene filter and the granular activated carbon filter...10
Figure 3 Dependency on pH of the ratio of HOCI to OCV...14
Figure 4 Germicidal efficiencies of hypochlorous acid, hypochlorite ion, and monochloramine...15
Figure 5 Breakpoint Chlorination Curve... -... 18
Figure 6 M ap of Haiti. Red suns indicated cities visited... 24
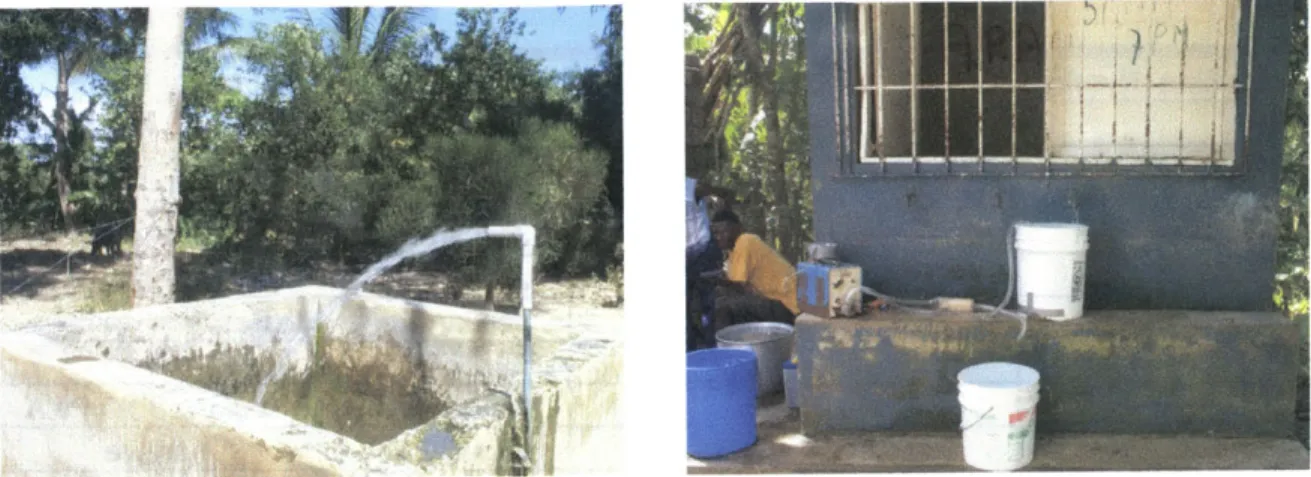
Figure 7 Examples of a free flowing captage (Dumay 5) and a fauceted captage (Bas Limbe 2). ... 26
Figure 8 An example of a groundwater well (Dumay 4), being pumped by a child...26
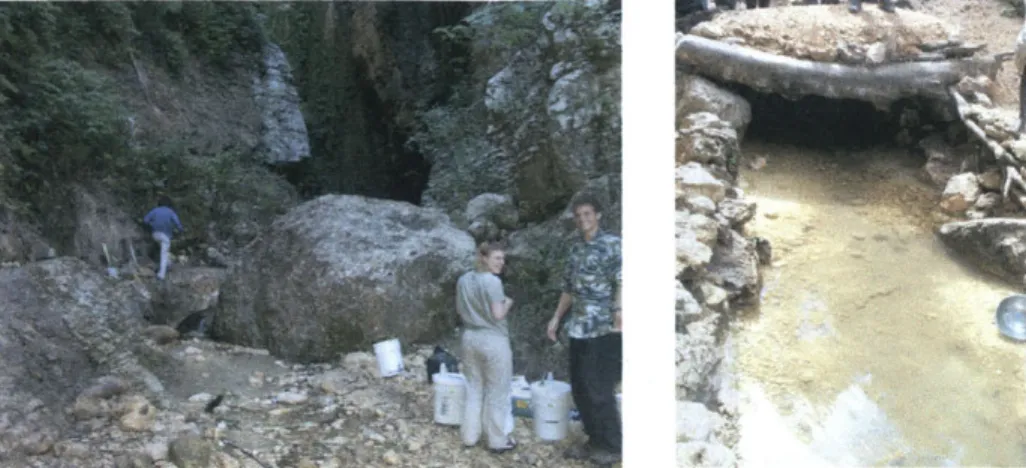
Figure 9 Examples of a stream (Fon Veret 2) and a spring developing into a stream (Barasa 1)...27
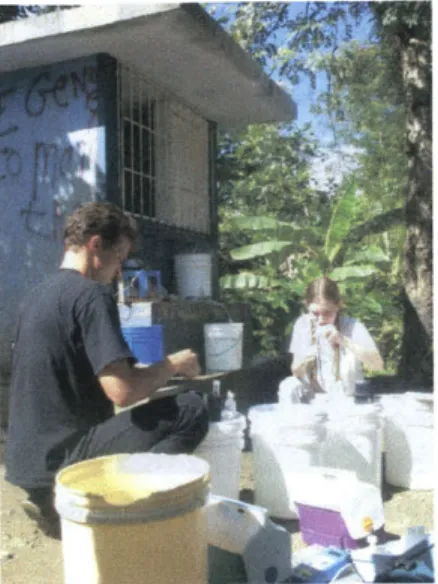
Figure 10 The experimental field setup at Bas Limbe 2, showing the four top buckets being sampled...28
Figure 11 Calibration curve for the LaMotte 1200 Colorimeter...30
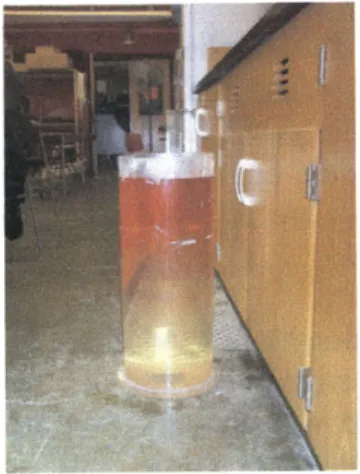
Figure 12 Artificial stratification. Hotter and therefore less dense water is red in color...36
Figure 13 Calibration curve for TOC measurements...38
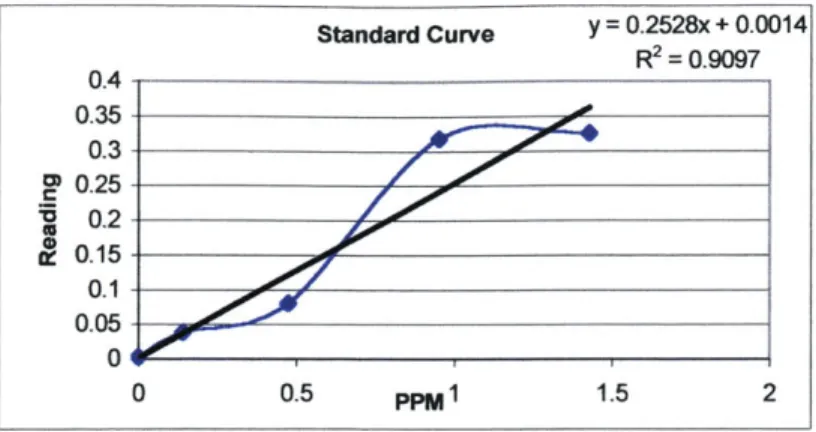
Figure 14 Sample standard curve from laboratory experiments...39
Figure 15 Free chlorine residual vs. total chlorine residual in the 1, 3, 5, and 10 ml buckets...42
Figure 16 Energy transfer into water vs. water temperature...45
Figure 17 Example of the way bleach that may have been spread over the surface area of a bucket. ... 47
Figure 18 Comparison of stratified and well-mixed concentrations for varying depths of stratification. ... 48
Figure 19 Mixing of 1 ml of bleach in a stratified water column...48
Figure 20 Mixing of 10 ml of bleach in a stratified water column if added in a single plume (a) or spread around the water surface (b)... ---... 49
Figure 21 Free chlorine residual measurements at 10-minute intervals...52
Figure 22 Combined chlorine residual measurements at 10-minute intervals...53
List of Tables
Table I Values of the ionization constant, K,, of hypochlorous acid at different temperatures...14Table 2 Pathogens associated with waterbome disease. ... 20
Table 3 Known Ct values for the inactivation of pathogens of concern. ... 23
Table 4 List of sampling sites, type of water source, date sampled, and local name...25
Table 5 Amount of 600 ppm NaOCl solution added to beakers in a laboratory corresponding to buckets used for sam pling in the field... ... ---... 34
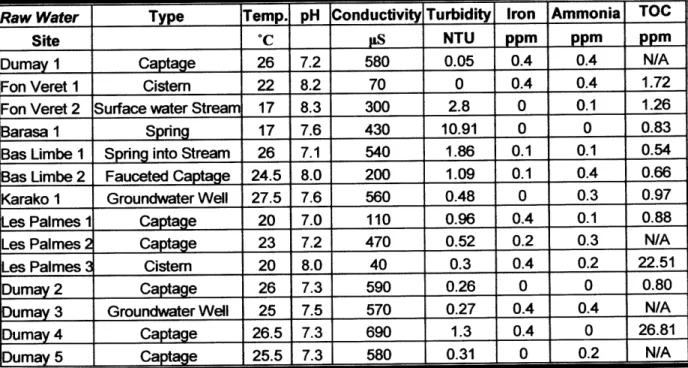
Table 6 W ater quality data for raw water at each site... 40
Table 7 Combined Chlorine Residual Measurements in ppm of Cl...43
Table 8 Total Chlorine Residual Measurements in ppm of Cl'. Raw water readings greater than 0 are most likely due to interference from Mn 4 or non-dissolved pieces of DPD tablet...44
Table 9 Comparison of laboratory and field chlorine data from Dumay. Measurements are in ppm of total chlorine residual ... ... ---.. ... 50
Table 10 Comparison of laboratory and field chlorine data from Les Palmes 2. Measurements are in ppm of total chlorine residual... ...---... 50 Table 11 Les Palmes total chlorine residual measurements (ppm) compared to the average residual values for all
I
Introduction
1.1
Haiti
Haiti occupies 27,750 square kilometers of land on the west side of the island Hispaniola in the Caribbean (Figure 1). The Dominican Republic occupies the eastern side of the island. Haiti has a population of 8 million people, approximately 2 million of whom live in the capital city of Port-au-Prince (World Bank Group, 2002; Lonely Planet, 2002).
CUBA ie de la Tortue
Port-de-Paix
Cap-Hatien *Gonaives
Gole de iE~
GSaint-,Marc .Hinche le de laGon ve Hispaniola Jdrdmie *J PORT-AU-PRINCE MiragoAne*
Los Cayes. -Jacmel
DOMINICAN REPUBLIC
Caribben Sea 0 3 60km
o 30 60nf
(US Central Intelligence Agency, 2001) Figure 1 Map of Haiti.
Haiti is the poorest nation in the Western Hemisphere. Seventy-five percent of the population lives in absolute poverty, mostly living off of subsistence agriculture (Maguire et al., 1996). The distribution of wealth is exceptionally unbalanced, with one percent of the population owning approximately half the wealth. The nation also has a large foreign debt.
There is very little infrastructure of any sort in Haiti, including roads, electricity, and water supply. There is also a lack of adequate medical care. The average life expectancy is only 53 years and the infant mortality rate is 73 in 1000 live births (World Bank Group, 2002). Waterborne disease is a major cause of illness in the population, and particularly of death in children under the age of five.
1.1.2 Water Needs in Haiti
Haiti simply does not have the resources to create an infrastructure for water sanitation and delivery. Not only has Haiti been economically devastated by political instability and long-term debt, but it has also been environmentally ravaged. Extensive deforestation has reduced surface water levels and left many areas where rivers once ran, dry. People often have to journey over 45 minutes just to reach a source for drinking water, and once the water is collected, they must travel back home carrying gallons of water. Where surface water is the primary source of drinking water, it is generally used for washing as well. In order to retrieve water that is free from soaps, people must travel further upstream for their drinking water.
International aid agencies have stepped in to ameliorate the situation somewhat. Agencies from Japan, the United States, and elsewhere have installed groundwater wells in villages, as well as piped water from mountain springs down to some villages located in valleys. This helps bring the water closer to the people; however it does not solve a related problem, which is the quality of the water.
Because the water that people collect is untreated, there is no assurance that it does not contain pathogens that can cause severe illness or death. In developed nations, government agencies often regulate the disinfection and delivery of water. However in Haiti the government agencies responsible for water and sanitation do not have the resources to ensure safe drinking water for the Haitian population.
Because no national or even regional solutions to the lack of clean water infrastructure are foreseeable, it was necessary to develop a means of producing safe drinking water on a local level. Point-of-use water filtration systems (water purifiers which are utilized in the home or other site of water usage) have been successful in bringing health to people in many developing nations.
1.2 Gift of Water, Inc.
The non-profit organization, Gift of Water, Inc. (GWI), known prior to 2000 as Industry for the Poor, Inc (IPI), has been working on point-of-use water treatment in Haiti since 1995 (Gift of Water, Inc., 2000). GWI was created by Phil Warwick, a Florida engineer, to provide water filtration in countries lacking water treatment and sanitation infrastructure. Initially, the organization worked with Adopt-a-Village Medical Mission to analyze epidemiological studies, and found that gastro-intestinal problems were common and believed to be caused by bacteriological pathogens in drinking water sources.
In response to this finding, Industry for the Poor, Inc. performed a cost analysis in order to begin development of an in-home gravity-driven water filtration system intended to remove pathogens and volatile chemicals (Gift of Water, Inc., 2000). In 1996, GWI began a pilot program in Dumay, a town near Port-au-Prince, with 56 families purchasing filters (Gift of Water, Inc., 2000). In addition, 12 filtration systems were donated to the University Hospital in downtown Port-au-Prince. There was a significant decline in gastro-intestinal
diseases with the use of the filter, particularly in young children, who are considered the most vulnerable.
Gift of Water, Inc. then began to expand its program. It hired six local technicians, who were trained to provide technical assistance to the families using the filter (Gift of Water, Inc., 2000). In 1997, a factory was built in Dumay to assemble the filters locally, with parts shipped from the US.
The cost of the filter is heavily subsidized by GWI in order to make it affordable to Haitian families. The apparatus costs US$15.29, but families are only required to pay approximately US$1.85 (Gift of Water, Inc., 2000). Operating expenses for the filter include replacement chlorine and granular activated carbon, and run families approximately US$0.42 per year.
Overall, the Gift of Water, Inc. filter and its use have been deemed a success. Since the Haitian Ministry of Health has approved the filter, GWI's program has reached seven villages, providing filtration systems that serve over 22,000 people (Gift of Water, Inc., 2000). The filters and the education provided by the program are thought to be responsible for a 90 percent decrease in water related diseases in children under five. The trained local technicians monitor each family that owns a filter to ensure that filters are used correctly and consistently.
1.2.1 The Gift of Water, Inc. Filter Setup
The Gift of Water, Inc. filtration system is comprised of two five gallon plastic buckets, stacked on top of each other, and two types of filters through which water must pass (Figure 2). Both buckets are 36 cm high with a diameter of 28 cm. The top bucket contains a polypropylene filter through which water must pass before traveling through a check valve into the lower bucket. This filter is designed to reduce turbidity and remove suspended solids from the water. On the other side of the check valve, attached to the lid of the bottom bucket is a granular activated carbon (GAC) filter, intended to remove chlorination by-products and other chemicals from the water. There is a spout on the bottom bucket to obtain water, as dipping unsterile cups into the bucket could cause contamination of the filtered water.
a)b
Figure 2 a) A full filtration system setup. b) The two filters used in the system, from left to right, the polypropylene filter and the granular activated carbon filter.
The water is chlorinated in both the top and bottom buckets. In the top bucket, 5 ml of 5.25 percent sodium hypochlorite solution (Clorox bleach) is currently added to approximately five gallons of water. A lid is placed on the bucket to prevent contamination and the bleach is allowed to act for half an hour. In Haiti, people are told to let the bucket sit for the amount of time it takes to cook a pot of beans (Lantagne, 2001 a). After half an hour, the top bucket is placed on the bottom bucket and the check valve is opened to allow water to pass through the two filters into the bottom bucket. Five drops of bleach (0.2-0.25 ml) are placed in the bottom bucket in order to provide a chlorine residual to prevent the regrowth of bacteria and other pathogens. The water is considered finished and safe to drink after it has all passed into the bottom bucket.
1.3
Purpose of Study
The purpose of this study was to determine the chlorine demand in Haitian drinking water sources in order to establish the most efficient amount of chlorine to use in the Gift of Water, Inc. filtration system. Minimization of the amount of chlorine in the top bucket is beneficial in a number of ways, but enough chlorine must be added to ensure that pathogens of concern are destroyed. Since it is important to have a chlorine residual in water that sits for a time before being used, a reduction of chlorine in the bottom bucket was not considered in this study.
A reduction in the amount of sodium hypochlorite added to the top bucket can be beneficial in several ways. First, chlorine and disinfection-by-products can have negative effects on human health. The World Health Organization (WHO) and the Centers for Disease Control and Prevention (CDC) have determined that the benefits of chlorine, primarily killing pathogens and reducing water-borne diseases, are worth the cost of ingesting chlorinated compounds (Centers for Disease Control and Prevention, 2002b; World Health Organization, 1997). To fully reduce risk, however, the amount of chlorine used in disinfection should be minimized. The addition of chlorine to water creates harmful by-products, such as trihalomethanes, some of which are known carcinogens. A field study conducted on the use
of the Gift of Water, Inc. filter found that trihalomethanes are present in all finished water samples, but generally meet the World Health Organization (WHO) standards for each compound (Lantagne, 2001b). However it was found that one sample did not meet the WHO standard for total trihalomethanes, the sum of the concentrations of all four trihalomethane species: chloroform, dibromochloromethane, bromodichloromethane, and bromoform.
The GAC filter in the Gift of Water, Inc. filtration system is intended to remove disinfection by-products, including trihalomethanes. The filter has a limit to the amount of chemical it can remove, and when that limit is reached there is breakthrough of chemical compounds in the finished water. For this reason, Gift of Water, Inc. has designed its program so that the filter is changed periodically. Unfortunately, field research determined that, in practice, the GAC filters were not replaced as often as needed (Lantagne, 2001b). Although this problem is beginning to be addressed, minimizing the amount of chlorine used in the Gift of Water, Inc. filtration system will make it possible to reach the WHO trihalomethane standards for a longer period of time with the same GAC filter.
Minimizing the chlorine addition to the Gift of Water, Inc. filtration system could also have economic benefits and might allow for a wider distribution of GWI's program (Warwick, 2002). 5.25 percent bleach is not extremely stable, particularly in the heat and sunlight of Haiti. There is concern within GWI over whether the strength of the bleach has diminished and may not provide enough germicidal strength. Phil Warwick took this possibility into account when he determined the amount of chlorine that should be added to the top bucket, and therefore included a safety factor in his recommendation (Lantagne, 2001b). A lower concentration bleach solution would deteriorate more slowly, thereby providing GWI with more confidence in the strength of their bleach solution (White, 1986). The safety factor for bleach instability could thus be reduced when using a lower concentration solution.
Gift of Water, Inc. is currently investigating the generation of chlorine in Haiti. Currently bleach is imported from the Dominican Republic or the United States. If Gift of Water, Inc. does implement chlorine generation, the organization will most likely turn to the recommendations of a study completed by Nadine van Zyl one year ago in conjunction with GWI. The study recommends the use of the SANILEC-6 unit, made by Exceltec International Corporation. This generator, however, would create a lower concentration sodium hypochlorite solution (0.8%), with the benefits of stability described above and a shorter storage time because it can be delivered and used by costumers soon after generation (van Zyl, 2001). van Zyl has recommended a reduction in the final expected concentration in the Gift of Water top bucket from 16 ppm to 5 ppm, and calculated that 10 ml of the generated solution be added to the top bucket of the filtration system. In order to determine if this lower concentration of chlorine provides adequate disinfection, the chlorine demand of the drinking water sources in Haiti must be determined.
Finally, a reduction in the amount of chlorine used in the Gift of Water, Inc. filtration system can have a social impact as well. The introduction of chlorine into a community that has always drunk water without the addition of chemicals can be difficult. The education that Gift of Water provides through training sessions and technician visits has helped people understand the importance of chlorination; however there may be reluctance on the part of
some Haitians to use the filter. Reducing the amount of chlorine added while still achieving the same health benefits might increase the social acceptance of the filtration system. With less chlorine, there is less breakthrough of chlorinated compounds into the finished water, and therefore less of a chemical taste. If the water doesn't taste strongly like chemicals, more people are likely to subscribe to the use of chlorine for disinfection.
Overall, lowering the amount of chlorine used in the Gift of Water, Inc. filtration system will have a positive impact. A reduction in the chlorine input can provide health, economic, and social benefits. However, in order to lower the amount of bleach used for disinfection and still guarantee safe drinking water, it is necessary to understand the chlorine demand of the water in order to assure that there will always be enough chlorine residual to inactivate pathogens. This study investigates the chlorine demand of Haitian water supplies.
2 Chlorination
2,1
Sodium Hypochlorite
Hypochlorite was one of the first forms of chlorine used for disinfection. It is found in one of two forms, calcium hypochlorite (CaOCl) and sodium hypochlorite (NaOCl). The bleach used in the Gift of Water, Inc. filtration system is a 5.25 percent solution of sodium hypochlorite. When bleach is mixed with water, the following reaction occurs,
NaOCl+ H20 - HOCi + Na+(OH) Eq. 1
creating the germicidal species hypochlorous acid (White, 1986).
Sodium hypochlorite is a powerful oxidant and is of great value for disinfection. However, a solution of sodium hypochlorite is not completely stable. A high concentration solution will deteriorate much faster than a weak solution (White, 1986). Spontaneous decay can take place within a bleach solution through the interaction of hypochlorous acid and hypochlorite ion (Hoffman et al., 1981). Hypochlorous acid can oxidize hypochlorite ion through the following reaction:
OCI + 2 HOCl -+
C10
3 + 2 HCl Eq. 2The pH is driven down by the formation of hydrochloric acid, which causes more HOCl to form and react with OCF. For this reason, higher concentration solutions will degrade faster because there is more HOCl available for this oxidation reaction to occur. For example, the half-life of sodium hypochlorite is approximately 60 days for an 18 percent available chlorine solution, whereas a 3 percent available chlorine solution has a half-life of 1700 days (Lawrence and Block, 1968). These times are highly dependent on other parameters as well. Sodium hypochlorite solutions will degrade faster at higher temperatures, under UV radiation, and in the presence of metals such as copper, nickel, cobalt, and iron.
The stability of sodium hypochlorite is of considerable concern in the Gift of Water, Inc. filtration system. Currently, the majority of bleach in Haiti is imported from the United States or the Dominican Republic. By the time the bleach has traveled into Haiti and to the villages in which it will be used, a significant amount of time has elapsed and the bleach has had an opportunity to degrade. This is particularly problematic in a tropical country like Haiti, where heat and sunlight can accelerate the degradation of the sodium hypochlorite solution.
2.2
Disinfectant Species
The most germicidal chlorine species is hypochlorous acid, HOCI, which dissociates to form hypochlorite ion, OCI~. HOCi destroys pathogens approximately 40-100 times more effectively than OCr (White, 1986; Metcalf & Eddy, 1991).
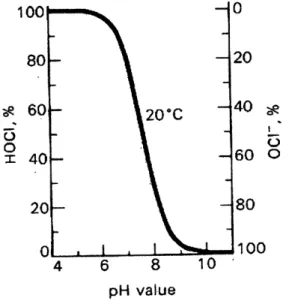
The ratio of HOCI to OC- is dependant upon the pH of a water sample (Figure 3). At a low pH there will be more hypochlorous acid. As the pH rises, the acid will dissociate into H' and hypochlorite ion (White, 1986). As the pH falls again, hypochlorous acid reforms.
100 -0 80- -20 60- 20*C ~40* X40- 60 0 20 ~80 0 , 100 4 6 8 10 pH value
(Metcalf & Eddy, 1991) Figure 3 Dependency on pH of the ratio of HOCI to OC1.
At higher temperatures the curve in Figure 3 moves to the left, because the tendency of hypochlorous acid to dissociate is greater at higher temperatures (Table 1). Water temperatures in Haiti range from approximately 17-27 C. Thus, at higher temperatures there is less HOCl present at a given pH than there would be at lower temperatures (Liptak, 1974).
Temperature Ki X 108 *IC mol/L 0 1.49 5 1.75 10 2.03 15 2.32 20 2.62 25 2.9
(Metcalf & Eddy, 1991) Table 1 Values of the ionization constant, Ki, of hypochlorous acid at different temperatures.
Chloramines are produced when ammonia is present in a water sample. three species of chloramines, which are collectively called combined monochloramine (NH2Cl), dichloramine (NHCl2), and trichloramine or nitrogen (NC13). They are formed through the following reactions that occur stepwise:
Formation of monochloramine: NH3 + HOCI - NH2C + H20
Formation of dichloramine: Formation of trichloramine:
NH2Cl + HOCi - NHCl2 + H20 NHCl2 + HOCl
+
NC3 + H20The three chloramine species are present in different proportions depending on the pH of the water. When the pH is greater than 8.5 monochloramine is the dominant species. When the pH is less than 4.5 trichloramine is generally predominant. Between pH 4.5 and 8.5
both monochloramine and dichloramine exist, however above pH 6 monochloramine is the more abundant of the two (Bitton, 1999).
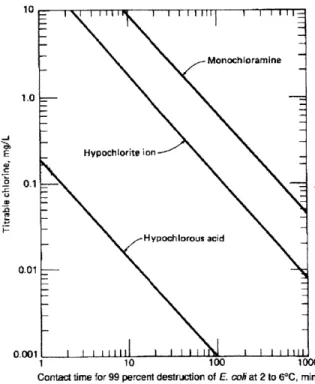
These species are significantly less germicidal than hypochlorous acid, (Figure 4). However, if given sufficient contact time, monochloramine can be as effective at destroying pathogens as hypochlorous acid (Metcalf & Eddy, 1991). Trichloramine is virtually non-germicidal. In the Gift of Water, Inc. filtration system, the contact time is fixed at half an hour, so it is important to account for the reduced germicidal ability of any chloramines produced during the use of the filter.
10 1.0 -j M T 0.1 0.01 A 001
K
r
1
--
I
I
i
i
Ii
MonochIoramine HypocHslorite ion Hypochiorous acid I I I i I II 10 100 1000Contact time for 99 percent destruction of E coli at 2 to 60C, min
(Metcalf & Eddy, 1991) Figure 4 Germicidal efficiencies of hypochlorous acid, hypochlorite ion, and monochloramine.
There are chlorine: trichloride Eq. 3 Eq. 4 Eq. 5
The presence of dichloramine and trichloramine in finished drinking water is not desirable. These species both produce an offensive odor. Trichloramine creates such an odor at the low concentration of only 0.02 ppm. Because of the smell and taste, the presence of these compounds in drinking water might dissuade a person from chlorinating their water.
When referring to the amount of chlorine in a water sample, HOCI and OClV are collectively referred to as free residual. A measurement of chloramines is called combined residual. The addition of the two is total residual.
2.3
Available Chlorine
Available chlorine (Av Cl2) is a phrase that was created in order to compare the potential oxidizing power of various chlorine compounds (White, 1999). As White said , "the term 'available chlorine' has no place in the field of water and waste treatment." However, available chlorine is used to describe the concentration of chlorine that is necessary to kill certain pathogens, so it is important to have an understanding of the term.
The initial definition of available chlorine was based on the iodometric method, in which the amount of iodine liberated from potassium iodide in a solution containing chlorine is proportional to the oxidizing power of the chlorine (White, 1999). All chlorine with a valence of +1 should react to liberate iodine from potassium iodide to produce elemental iodine. It takes one CC atom to create one molecule of elemental iodine, 12.
The concept of available chlorine can be quite confusing as the oxidizing species is Cl+, but available chlorine is a calculation of the weight of Cl2 needed to liberate the same amount of I2 from potassium iodide (White, 1999). For this reason, available chlorine is thought of in terms of Cl2 not Clr, and the abbreviation is Av Cl2. However, since only one of
the chlorine atoms in Cl2 has a valence of +1, the available chlorine in any chlorine compound
is twice the amount of Clr that is present.
Available chlorine can be thought of as the oxidizing percentage of the mass of a disinfectant. In the case of sodium hypochlorite, the following calculation can be carried out to determine this percentage:
Molecular Weight of Cl+ * 2 = 35.5 * 2 = 95.4% Eq. 6 Molecular Weight of NaOCI 74.5
where the 2 is intended to account for two chlorine atoms in one molecule of elemental chlorine.
2.4 Chlorine Demand
Metcalf & Eddy (1991) defines chlorine demand as "the amount of chlorine that must be added to reach a desired level of residual." Aside from reactions with ammonia species, sodium hypochlorite reacts with many other substances in water. These reactions reduce the amount of chlorine residual available for disinfection, which in turn increases the amount of sodium hypochlorite that must be added to water in order to meet the chlorine demand of the system.
Turbidity can have a great effect on the chlorine demand of the system as it is composed of both inorganic and organic matter. Turbidity can reduce the effectiveness of chlorination through absorption of chlorine species (Metcalf & Eddy, 1991). Also, microorganisms are somewhat protected when attached to particulate matter and are more resistant to disinfection than microorganisms that are freely suspended in water (Bitton, 1999). United States Environmental Protection Agency standards allow only 1 nephelometric turbidity unit (NTU) in drinking water.
Total organic carbon (TOC), which is associated with turbidity, exerts a very large chlorine demand (Bitton, 1999). The presence of dissolved organic compounds can result in lowered disinfection efficiency. In addition, organic matter is responsible for reacting with chlorine to produce harmful chlorination-by-products, such as trihalomethanes.
A subset of TOC, those organic compounds with unsaturated bonds, may pose another problem when studying chlorine demand. These compounds, as well as those with polycyclic rings containing hydroxyl groups and those containing sulfur groups, react readily with chlorine to produce substances that appear as chlorine residual and cause falsely high readings when tests are conducted (Metcalf & Eddy, 1991). However, Metcalf & Eddy states that these compounds are assumed to have little or no germicidal ability.
Other substances that can create a significant chlorine demand are hydrogen sulfide, iodine, nitrite, and heavy metals, particularly iron and manganese (Bitton, 1999; Gordon et al.,
1987).
2.5 Breakpoint Chlorination
Breakpoint chlorination refers to the process by which chlorine reacts with all oxidizable species in a water sample up until the point where the reactions do not further consume chlorine that is added to the water. The point at which all additional chlorine added becomes free residual is called the breakpoint.
Chlorine has four stages of chemical reactions in a water sample (Figure 5). The length of each stage is dependent upon what other chemicals are present. Ammonia content has the greatest affect on the breakthrough curve due to the production of chloramines through the reactions of ammonia and chlorine. The first stage of chemical reactions occurs just after chlorine is added to a water sample. Chlorine is a strong oxidant and will react with
reducing compounds, such as ferrous and manganous, which destroy the germicidal ability of the chlorine by reducing it to chloride ion, which has a valence of -I (Metcalf & Eddy, 1991). Compounds produced during this stage are not included in the calculations of residual chlorine. The chlorine that is used in this stage is considered the initial chlorine demand of the water (Emergency Treatment Methods, 2002).
During stage 2, chlorine reacts with ammonia to create combined residual, mostly monochloramines, which has significantly less germicidal potency than hypochlorous acid, but is still considered an effective disinfectant. Chlorine will also begin oxidizing organic compounds, again destroying the germicidal potential of some of the chlorine added to a water sample. The residual during this stage is predominantly composed of chloramines, but there is some free residual present.
DESTRUCTIONOFCNLORINE
B YREDUCIHG COMPOUNDS
FORMATIONOFTREE LRE
0-F FREE CLORIE
I IAND PRESENCE OF COMPLEX
+EDLORO -ORAICCOCHPOULDS I I NHOT DESTROYED UI EI I DESTRUCTION4 SI OF C OLORAMINESE WO 4
0
% 0401
:N
0
0
-
%
W O-3 FORMATION OFOLOPAMINES&
ZI OMIDATIOt4OF ORGANIC COMPOUNDS
O.Z.CHLER CELARIEE
/ I = M
04 I COYCHLORINELOADDED
(Department of Education of the State of Queensland, Australia, 2002)
Figure 5 Breakpoint Chlorination Curve
Stage 2 ends and stage 3 commences when free residual that is present in the water begins to further oxidize the chloramines and any remaining oxidizable material. Monochloramines are oxidized again to become dichloramines, which can further be oxidized to form nitrogen trichloride, a non-germicidal compound. The hump in the breakpoint curve between stages 2 and 3 generally occurs when the molar concentrations of chlorine and ammonia are equivalent (Chungrok ENC Company, 2002). As chlorine is added and the molar ratio of chlorine to ammonia exceeds 1: 1, dichloramines are formed. Further oxidation occurs as chloramines are oxidized to nitrogen gas, nitrate, nitrogen trichloride and other compounds. The complete oxidation of chloramines is shown in the following equation:
This reaction generally takes place when the molar ratio of chlorine to ammonia is between 7.5:1 and 11:1 (Bitton, 1999).
Once the breakpoint is reached and all ammonia compounds are completely oxidized, any further chlorine added to the water can form and remain as free residual because there is no longer any chlorine demand. (This assumption does not account for compounds that might react with chlorine over a longer timescale. Therefore the free residual might still have a slight chlorine demand.) This portion of the breakthrough curve has a 45' slope because the amount of free residual created is directly proportional to the amount of chlorine added in a one-to-one relationship.
If the amount of chlorine used in disinfection does not surpass the breakpoint, it is important to account for the presence of the less germicidal species in combined chlorine residual when determining a contact time. It is also important to account for pH's effect on the ratio of hypochlorous acid to hypochlorite ion.
The breakpoint curve is a good indicator of the manner in which chlorine reacts with substances and produces germicidal residuals or non-germicidal compounds. Chlorine's interactions with these compounds that cause chlorine demand will be investigated in this study, with particular attention paid to ammonia since this interaction produces species that are still germicidal, even though less so than hypochlorous acid.
3 Pathogens
3.1 Pathogens of Concern
There are four categories of pathogens that are of concern when discussing waterborne disease in humans: bacteria, viruses, protozoa, and helminthes (Table 2).
Organism Disease Remarks
Bacteria
Escherichia coli Gastroenteritis Diarrhea
Legionella
pneumophila Legionellosis Acute respiratory illness
Leptospira Leptospirosis Jaundice, fever (Weil's disease)
Salmonella typhi Typhoid fever High fever, diarrhea, ulceration
Salmonella Salmonellosis Food poisoning
Shigella Shigellosis Bacillary Dysentery
Vibrio cholerae Cholera Extremely heavy diarrhea, dehydration
Yersinia enterolitica Yersinosis Diarrhea
Viruses
Adenovirus (31 types) Respiratory disease
Enteroviruses (67 Gastroenteritis, heart
pes) anomalies, meningitis
epatitis A Infectious hepatitis Jaundice, fever
Norwalk agent Gastroenteritis Vomiting
Reovirus Gastroenteritis
Rotavirus Gastroenteritis
Protozoa
Balantidium coli Balanticliasis Diarrhea, dysentery
Cryptospordium Cryptosporidiosis Diarrhea
Amebiasis (amoebic Prolonged diarrhea with bleeding, abscesses of
Entamoeba histolytica dysentery) the liver and small intestine
Giardia /amblia Giardiasis Mild to sever diarrhea, nausea, indigestion elminths
scaris lumbricoides Ascariasis
Enterobius vericularis Enterobiasis Roundworm infestation
Fasciola hepatica Fascioliasis Sheep liver fluke
Hymeno/epis nana Hymenolepiasis Dwarf tapeworm
Taenia saginata Taeniasis Beef tapeworm
Taenia solium Taeniasis Pork tapeworm
Trichuris trichiura Trichuriasis Whipworm
(Metcalf & Eddy, 199 1) Table 2 Pathogens associated with waterborne disease.
Each class of pathogen contains many infectious species that can cause various illnesses. Viruses are the smallest pathogen in size, and bacteria are the next smallest. Viruses and the smaller bacteria are generally too little to be filtered, as is most likely the case in the Gift of Water, Inc. filter. The polypropylene filter in the top bucket of the filtration system is has a five micron pore size, such that some protozoa and helminthes will be filtered, but not all (Dann, 2002).
Travelers to Haiti are advised to receive inoculations for several waterborne diseases including Polio and Hepatitis A, both of which are caused by viruses, and typhoid fever, which is caused by the bacterium Salmonella typhi. As well, Campylobacter, Toxigenic
Escherichia coli (E. coli), Shigella, and Vibrio cholerae, the pathogen that causes cholera, are
considered bacteria of concern in Haiti (Tauxe, 2001).
A common ailment, and one of great concern is gastroenteritis. Bacterial gastroenteritis can be caused by Shigella, Salmonella, Toxigenic E. coli, Campylobacter,
Vibrio cholerae, and Yersinia (White, 1986; Metcalf & Eddy, 1991). Many viruses and
protozoa cause gastroenteritis as well. Norwalk virus and Rotavirus are believed responsible for 77 percent of acute waterborne gastroenteritis (White, 1986). They are extremely resilient viruses, and it is believed that Rotavirus can survive modern wastewater treatment.
Symptoms of gastroenteritis include diarrhea, stomach cramping, nausea, vomiting, fever, and headaches (Public Health Division of the Government of Victoria, Australia, 2002). Of particular concern are diarrhea and vomiting, which can cause dehydration, a condition that is exacerbated by the fact that the water used for rehydration will most likely contain the same pathogens that caused the illness in the first place. This cycle can only be ended if water is properly disinfected.
The scope of this study has been limited to bacteria that cause gastroenteritis, since this is an extremely common ailment. If there is confidence that the majority of the bacteria that cause gastroenteritis are destroyed, a large percentage of waterborne illness should be eliminated.
3.2 Mechanisms of Pathogen Inactivation
Chlorine works to deactivate pathogens through a variety of mechanisms. Bacterial cells are the easiest targets of chlorination because chlorine causes significant damage to many parts of the bacterial cell (Bitton, 1999). Chlorine can attack the cell wall or membrane, leading to a disruption in cell permeability and other cell functions, such as DNA synthesis and nutrient transport. Chlorine also damages nucleic acids and enzymes, causing a cell to lose survival functions. In multicellular organisms, chlorine must deactivate a large number of cells before inactivation of the organism takes place. A large portion of the organism is shielded by outer layers of cells, which must be significantly damaged before the organism can be destroyed, therefore multicellular organisms are significantly more difficult to inactivate than single-celled bacteria.
Chlorine destroys viruses through two primary mechanisms. Both bacterial phage f2 and poliovirus type 1, for example, are inactivated primarily by damage to nucleic acids. Rotaviruses, on the other hand, are inactivated through attack of the virus' protein coat.
3.3 Ct values
The effectiveness of chlorination on a pathogen can be represented by the Ct value. The "C" in the Ct values represents the chlorine concentration, usually expressed as mg/l, and the "t" in the Ct value represents the contact time, usually expressed in minutes, required to kill a percentage of a population at a specific pH and temperature (Bitton, 1999). This value is often called a k-factor, although in actuality the relationship between k and Ct is expressed by the following:
k = Cnt Eq. 8
where n is a factor that determines the relative importance of contact time versus disinfection concentration. When n is less than one, contact time is the more important factor for effective disinfection. When n is greater than one, the chlorine concentration is more important. Often n is close enough to one that k can be considered simply C*t.
Changes in temperature and pH both alter the k-factor for a given organism. As pH increases Ct generally increases, requiring either more disinfectant or a longer contact time (Bitton, 1999). Temperature has the opposite affect; Ct decreases with increases in temperature, requiring lower concentrations and contact times for effective disinfection.
3.3.1 Pathogen specific Ct values
Bacteria are the easiest pathogens to inactivate using chlorine (Table 3). Generally treatment of water with 1 mg/l, or even less, for 30 minutes is sufficient to kill a significant percentage of bacterial cells. The rugose strain of Vibrio cholerae is one exception, as it requires twice the concentration, 2 mg/l, over a 30-minute period.
Viruses can be significantly harder to kill. Viruses require a Ct value of at least 15-30 min-mg/l, while only the most hardy of bacteria require Ct values that large. The less resilient bacteria require Ct value in the range of 0.5-3 min-mg/l. After chlorination many viruses are still viable; such as Norwalk Agent (Liptak, 1974).
Av Cl2 Concentration Time Temperature Reduction Microorganism Ct pH C % Bacteria Campylobacter 0.1 5 0.5 8.0 25 99.99 jejuni Escherichia coil 0.2 15 3 7.0 25 99.99 Salmonella typhi 0.5 6 3 ? 20 99 higella 0.05 10 0.5 7.0 20-29 99.6-100 dysenteriae Vibrio cholerae 1.0 <1 <1 7.0 20 100 smooth strain) Vibrio cholerae 2.0 30 60 7.0 20 > 99.99 (rugose strain) Yersinia 1.0 30 30 7.0 20 92 enterolitica Viruses
Norwalk agent 0.5-1.0 30 15-30 7.4 20 Not
completely
inactivated
Rotavirus 0.5-1.0 30 15-30 7.4 25 100
(Centers for Disease Control and Prevention, 2002a) Table 3 Known Ct values for the inactivation of pathogens of concern.
In order to eliminate a significant proportion of the risk from the pathogens listed in Table 3 in the half hour contact time used in the Gift of Water, Inc. filter, it is necessary to have an available chlorine concentration of 2 mg/l. If the more virulent strains, such as the rugose strain of Vibrio cholerae, are not present in the drinking water source, it is possible to attain reasonable disinfection with a 1 mg/l concentration of available chlorine.
Because a single unit of sodium hypochlorite is equivalent to 95.4 percent of a unit of Av Cl2, in order to create an available chlorine residual of lppm in a system with no chlorine demand, it would be necessary to create a concentration of 1.05 ppm NaOCl. The bleach currently used in the Gift of Water, Inc. filtration system is a 5.25 percent by weight sodium hypochlorite solution. Therefore the five gallon Gift of Water bucket will have 1.05 ppm NaOCl concentration when 0.378 ml of bleach are added. Even if the water contained the rugose strain of Vibrio cholera, it would still be possible to use less than 1 ml of bleach to kill the pathogens of concern if the water had no chlorine demand. A safety factor of 2 should be multiplied by this amount in order to account for uncertainties in Ct values or variations in temperature and pH. In a chlorine-demand-free system it would be acceptable to use only 1.5 ml of bleach for adequate disinfection. This number must be increased proportional to the chlorine demand of the system.
4 Methodology
4.1
Field
Work
in
Haiti
Field work for this study took place in Haiti during the month of January 2002. Sites were selected from among the villages within which Gift of Water, Inc. has established filtration programs. Six villages were chosen: Dumay, Fon Veret, Barasa, Karako, Bas Limbe, and Les Palmes. One to four water sources was studied in each village, and the number and type of sources varied from village to village.
CUBA Ale do la Tortue Acean
WLcdward Port-de-Pax
Passage .. &s h
Cap-H n
Gonaives
Go~le de le Gonive Sit
Saint-*Marc ,Hinche
le de la Gonive
Hispaniola
.Jdrdmie PORT-AU-PRINC
MiragoAne
*
Dlyayes.- LesPaaes " Jacmel
DOMI REP Caribbean Sea Fon NICAN' JBLIC o 30 60 u m o 30 60 ff
(US Central Intelligence Agency, 2001) Figure 6 Map of Haiti. Red suns indicated cities visited.
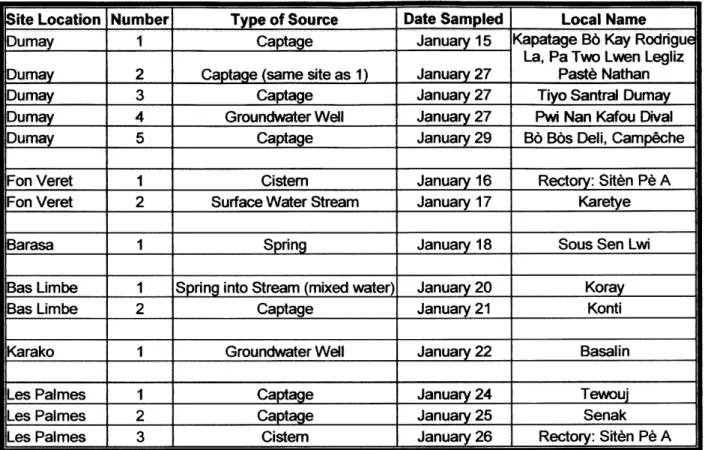
There were five different types of water sources examined in this study: groundwater wells, surface water streams, springs, cisterns, and captages. Captages are outputs of water that have been piped down a mountain from a spring. Depending on the climate, geography, and resources available, some villages had only one type of source while others had varying source types. Also, some villages had only one or two sources from which people gathered drinking water during the winter, while others had several sources from which people could choose. This study aimed to examine a representative set of water sources both across each village and across the entire country. Table 4 shows the number and types of sources studied in each village, as well as the date that sampling took place and the local name of the source, so that those familiar with the villages may have an additional reference. Individual sources will further be referred to by location and number, as shown in the table.
Site Location Number Type of Source Date Sampled Local Name
Dumay 1 Captage January 15 Kapatage B6 Kay Rodrigue
La, Pa Two Lwen Legliz
Dumay 2 Captage (same site as 1) January 27 Paste Nathan Dumay 3 Captage January 27 Tiyo Santral Dumay
Dumay 4 Groundwater Well January 27 Pwi Nan Kafou Dival
Dumay 5 Captage January 29 B6 Bbs Deli, Camp~che
Fon Veret 1 Cistem January 16 Rectory: Siten P6 A
Fon Veret 2 Surface Water Stream January 17 Karetye
Barasa 1 Spring January 18 Sous Sen Lwi
Bas Limbe 1 Spring into Stream (mixed water) January 20 Koray Bas Limbe 2 Captage January 21 Konti
Karako 1 Groundwater Well January 22 Basalin
Les Palmes I Captage January 24 Tewouj Les Palmes 2 Captage January 25 Senak
Les Palmes 3 Cistern January 26 Rectory: Siten P6 A
Table 4 List of sampling sites, type of water source, date sampled, and local name.
4.1.1 Description of Source Types
Captages were the most common source type sampled in this study. These sources were created mainly by foreign aid organizations that piped water underground from mountainous springs down to lower elevations where people then gathered water from a fountain. Piping the water, rather than allowing it to flow naturally down the mountain in streams, allowed for routing of the water to specific locations, as well as theoretically decreased contamination of the water from animals and other contaminant sources along the path down the mountain because the water is closed off from these sources.
Since captages are based mainly on the gravitational flow of water, much like a continuously running stream, the water from a captage is continuously flowing and always available unless the spring has run dry. In Bas Limbe, however, the captage had been stopped
by a faucet that released water only when needed. It is unknown exactly where the water is
stored when the faucets are turned off, but most likely it was stored in a concrete structure adjacent to the faucet. Figure 7 shows an example of each type of captage.
Figure 7 Examples of a free flowing captage (Dumay 5) and a fauceted captage (Bas Limbe 2). Groundwater wells were sampled in two of the villages in which sampling took place. These sources are pumping stations that bring water from the ground to the surface for collection (Figure 8).
Figure 8 An example of a groundwater well (Dumay 4), being pumped by a child.
Streams were found in several villages, but only certain ones were used for drinking. People were conscious of the other uses of surface water, such as bathing and laundry, and, when possible, would hike further upstream than where these activities were taking place in order to collect drinking water.
The sources of the streams are springs, places where groundwater reaches the surface and flows as surface water. In places where springs flow slowly, often drinking water is a mixture of water flowing from the spring and that which has already become part of the
Figure 9 Examples of a stream (Fon Veret 2) and a spring developing into a stream (Barasa 1). Cisterns were also commonly used for drinking water in Haiti. These sources collect rainwater, often on a roof or in a large freestanding structure. The water is then piped to a faucet for collection, either indoors or outdoors.
4.2 Methods Utilized in Field
Several tests were conducted in the field in order to determine what characteristics of the water affected chlorine demand. I chose six water quality parameters to investigate: ammonia concentration, iron concentration, temperature, pH, conductivity, and turbidity. As well, I sampled for free and total chlorine residuals in each of my water samples.
4.2.1 Experimental Setup
At each site my experimental setup consisted of several Gift of Water, Inc. filter top buckets, containing polypropylene filters, filled with source water. To each bucket a different amount of bleach was added in order to determine how a range of bleach concentrations were affected by the chlorine demand of the water supply. When filled, each bucket held approximately 5 gallons of water. At the majority of sites, 4 top buckets were used with a 1ml addition, 3 ml addition, 5 ml addition, and 10 ml addition of 5.25 percent bleach. The Dumay 1 setup had a 2 ml addition bucket instead of a 3 ml addition bucket. The Dumay 2 and Dumay 4 setups lacked 10 ml buckets.
Each bucket was tested for the six water quality parameters and residual chlorine as described below, with duplicates conducted on every tenth sample. Testing was completed half an hour after the addition of chlorine, which is the amount of time Gift of Water instructs filter owners to wait before allowing the water to pass to the lower bucket. The six tests were also conducted on a raw water sample.
Figure 10 The experimental field setup at Bas Limbe 2, showing the four top buckets being sampled. In addition to the tests done on each bucket, one sample was chosen at random at each of the first ten sites to be tested for chlorine residual every 10 minutes in order to determine the variation over time of chlorine residual in a sample.
4.2.2
Chlorine Residual Testing
4.2.2.1 DPD Chemistry
The sampling of chlorine residual in my water samples was conducted through a colorimetric method, utilizing N, N diethyl-p-phenylenediamine sulfate (DPD) tablets as the color-producing reagent. Two types of DPD tablets were used, and only DPD-1, which measured the free residual available in the sample, is composed of N, N diethyl-p-phenylenediamine sulfate. DPD-3, the active ingredient of which is potassium iodide, gave a measure of the total residual after addition to a sample already containing DPD-1.
The basis for the ability of this reaction to proceed is chlorine's desire for electrons. Chlorine, a halogen, is extremely electronegative with a value of 3.0 on the Pauling scale (Alberty, 1997). Oxygen, however, is even more electronegative with a value of 3.5. When hypochlorous acid is formed, the oxygen is the atom in the middle with a hydrogen atom and a chlorine atom attached on opposite sides. The oxygen draws the electrons away from the chlorine atom, giving the chlorine a positive polarity. Because of this, the chlorine is willing to accept electrons from another molecule that will give them up, so that when a reducing compound is added, the chlorine will break off from the hypochlorous acid molecule and form a compound with a reducing substance.
The process by which DPD works is as follows. The active ingredient in the DPD-1 tablets, N, N diethyl-p-phenylenediamine sulfate is an organic compound with a benzene ring base. The substances, such as reduced nitrogen compounds, around the benzene ring are available for oxidation by chlorine and will break away from the DPD to form a compound
with the more electronegative chlorine. Each DPD must give two electrons in the following reaction:
Cl2 + DPD -> 2CV + DPD+2 Eq. 9
(Total Residual Chlorine LaMotte Method 7916, 1996)
This oxidation causes the DPD to change from colorless to the red or pink color read by the spectrophotometer.
The DPD-3 reaction adds more red color to the solution in proportion to the amount of combined chlorine available in the sample. In chloramines, the chlorine is attached to a nitrogen atom that is equally as electronegative as chlorine. Chlorine therefore wants to combine with something less electronegative than itself, but because it has not given up its electrons like it had to oxygen in hypochlorous acid, the attraction to reducing agents is not so strong that DPD can strip the chlorine from the chloramine molecules. DPD-3 tablets contain potassium iodide. Chloramines oxidize the iodide ion, forming IC. DPD is able to liberate the iodine from the chlorine atom, similar to the way in which DPD reacted with hypochlorous acid. The reaction between iodine and DPD forms a further red color read by the spectrophotometer (Total Residual Chlorine LaMotte Method 7916, 1996).
It should be noted that the addition of potassium iodide would produce a similar reaction with hypochlorous acid and hypochlorite ion, so that it is important to get a free chlorine reading without the presence of iodine in the water or the reading will be inaccurately high. Other compounds that can cause false high readings in the timeframe of the testing procedure include bromine and bromamines, ozone, hydrogen peroxide, oxidized manganese, permanganate, and monopersulfate. Most likely, many of these interferences were not encountered during my sampling in Haiti, although it is possible that oxidized manganese may have led to some false high readings.
It is also recommended that glassware be acid washed between samples to remove any residues of potassium iodide that might cause combined chlorine to show up in a test for free chlorine. Due to limitations in the field my glassware could only be rinsed thoroughly multiple times with the sampling water or distilled water to remove any residues from previous tests. This may have contributed to falsely high free chlorine readings, however the total chlorine readings should still have read approximately the correct value.
4.2.2.2 LaMotte 1200 Colorimeter
The chlorine residual readings were taken with a LaMotte 1200 Colorimeter, a single wavelength, direct-reading instrument. LaMotte brand DPD-1 and DPD-3 tablets were utilized. The colorimeter comes with 10ml glass colorimeter tubes used in the sampling procedure, a tablet crusher used to dissolve DPD tablets, a wiping cloth, and a water sampling bottle used to collect sample.
The colorimeter has a chlorine residual detection range of 0-4.00 ppm of Cl' (LaMotte 1200 Colorimeter Instruction Manual, 2002). Because some samples into which bleach had been added were expected to have readings approaching or higher than the detection limit, all samples were diluted by approximately 19:1 using a 10 ml graduated cylinder. Dilutions were made with distilled water.
The LaMotte 1200 Colorimeter, when calibrated to measure chlorine, utilizes a 530 nm wavelength to detect the intensity of color caused by the reaction of chlorine and the DPD tablets (Figure 11).
DC1 200 Cl Calibration
- fas vs tablets
fins vs tablets Regr
fas tablets Pred1 -
-fas vs tjablets Order 2 b[0] 0 bjl 1.7096332308 b-21 0 :202220483 .- . . 0.0 0.2 0.4 0.6 0.8 1.0 1.2 1.4 1.6 absorbance at 530 nm (DC1200 Cl Calibration Curve, 2002) Figure 11 Calibration curve for the LaMotte 1200 Colorimeter.
The colorimeter was calibrated once per week using LaMotte's Chlorine Standards for Model 1200. This is a secondary standard kit containing a blank, as well as three standards for low, midrange, and high chlorine calibrations. The instrument had been borrowed from Gift of Water, Inc. and had previously been calibrated with primary standards.
Before collecting sample water in order to bottle was then filled and colorimeter tube was also
sample had been diluted. with distilled water.
a sample, the water sampling bottle was rinsed three times with wash away any residue of previous water samples. The sampling only water from this bottle was used in the colorimetric analysis. A rinsed three times with either sample water, or distilled water if the The graduated cylinder used for dilutions was rinsed three times
Either 10 ml of pure or diluted sample was placed in a colorimeter tube, which was then capped and wiped down with the wiping cloth. The colorimeter requires no warm-up
45 Fr 4.0-3-65 3.0- 2.5-2.0 1-05 1 .0 0.5-0.0 -1.8