Development of a Hydrogel-based Biocompatible
Platform for Studying Metabolic Interactions
between Algae and Bacteria
by
Hyungseok Kim
B.S., Seoul National University (2017)
Submitted to the Department of Mechanical Engineering
in partial fulfillment of the requirements for the degree of
Master of Science in Mechanical Engineering
at the
MASSACHUSETTS INSTITUTE OF TECHNOLOGY
May 2020
© Massachusetts Institute of Technology 2020. All rights reserved.
Author . . . .
Department of Mechanical Engineering
May 15, 2020
Certified by . . . .
Cullen R. Buie
Associate Professor
Thesis Supervisor
Accepted by . . . .
Nicolas Hadjiconstantinou
Graduate Officer, Department of Mechanical Engineering
Development of a Hydrogel-based Biocompatible Platform
for Studying Metabolic Interactions between Algae and
Bacteria
by
Hyungseok Kim
Submitted to the Department of Mechanical Engineering on May 15, 2020, in partial fulfillment of the
requirements for the degree of
Master of Science in Mechanical Engineering
Abstract
Metabolic interaction between algae and bacteria is an essential topic to develop algal crops as a source of biofuels and to understand nutrient cycling in ocean ecosys-tems. To date, studying chemical exchange between these microbial species based on molecular di↵usion processes has been chellenging due to a lack of an appropriate co-culture system. In this thesis, a hydrogel-based biocompatible platform is pro-posed to study the interaction between algae and bacteria in a systematic way. By using this platform, di↵erent species of microorganisms are physically separated each other by culturing them in individual wells, while allowing an exchange of metabo-lites by chemical di↵usion through the nanoporous hydrogel wall. In the first chapter, I discuss ongoing e↵orts to understand interaction between algae and bacteria and experiments to culture algal species. In the second chapter, I introduce the hydrogel-based platform and discuss how it can be designed to incubate microorganisms with a spatially controlled biomolecular di↵usion. In the final chapter, I discuss a commu-nity structure of associated bacteria co-cultured with their algal host Phaeodactylum tricornutum, which is shaped by di↵usion process using the hydrogel-based platform. Thesis Supervisor: Cullen R. Buie
Acknowledgments
I would like to thank my advisor, Professor Cullen R. Buie, for his invaluable guid-ance and inspirations throughout the study. His careful and consistent advisory has supported me to withstand during my first graduate program at MIT.
The accomplishment in my Master’s program would not have been made without the advice from my colleagues in the Laboratory for Energy and Microsystems Inno-vation. I would like to thank Dr. Christopher A. Vaiania and Dr. Chelsea Catania for training me on the essential microbiological techniques and on the fabrication of hydrogel devices. I would like to thank Sijie Chen and Dr. Po-Hsun Huang for providing sincere comments to help me continue the research and graduate study.
I would also like to thank my research collaborators in Lawrence Livermore Na-tional Laboratory, Dr. Xavier Mayali and Dr. Je↵rey A. Kimbrel, for providing insightful ideas to me as a beginning experimentalist in the algal research field.
The experience with my family during the past several months has been partic-ularly extensive; however, I believe it has strengthened my motivation to pursue the graduate study further.
Contents
1 Overview of metabolic interaction between algae and bacteria 15
1.1 Algae as biofuel source . . . 15
1.2 Phycosphere and bacterial community . . . 16
1.3 Metabolic interaction between algae and bacteria . . . 17
2 Culture and maintenance of algal species 19 2.1 Preparation of seawater media and transfer of algal cultures . . . 19
2.2 Growth of axenic and xenic Phaeodactylum tricornutum . . . 20
2.2.1 Materials and methods . . . 21
2.2.2 Results and discussion . . . 22
3 Hydrogel-based di↵usion assay for studying bacterial growth 25 3.1 Background . . . 25
3.2 Material characterization of hydrogel-based platform . . . 27
3.2.1 Synthesis of nanoporous structured poly(2-hydroxethyl methacrylate-co-ethylene glycol dimethacrylate) (HEMA–EDMA) . . . 27
3.3 Hydrogel-based antibiotics di↵usion assay for incubating Escherichia coli . . . 29
3.3.1 Materials and methods . . . 29
3.3.2 Results and discussion . . . 31
3.4 Communication between genetically engineered E. coli strains in hydrogel-based assay . . . 33
3.4.2 Results and discussion . . . 35 3.5 Concluding remarks . . . 38 4 Hydrogel-based co-culture platform for studying bacterial
commu-nities with algal host 41 4.1 Background . . . 41 4.2 Materials and Methods . . . 42 4.2.1 Strains and culturing conditions . . . 42 4.2.2 Experimental design and preparation of hydrogel platform . . 42 4.2.3 Sample collection, sequencing and analysis . . . 44 4.3 Results and discussion . . . 44
4.3.1 Bacterial communities are spatially a↵ected by di↵usion of algal exudates . . . 44 4.3.2 Individual bacterial taxa have unique growth dependency to
algal host . . . 45 4.4 Limitations and future work . . . 46 A MATLAB code for counting the number of algal cells from
micro-scope images 49
B MATLAB code for visualizing absorbance reads from plate reader (hydrogel device multiwell design) 51 C Shortcomings in mutiwell hydrogel devices 53
List of Figures
2-1 Cell abundances of axenic P. tricornutum and co-culture with Mari-nobacter sp. 3-2. (a) Growth of algae measured by cell density under flask and glass tube cultures. (b) Growth of algae measured by chloro-phyll abundance under flask and glass tube cultures. . . 22 2-2 Summarized results of growth measurements of axenic P. tricornutum
and co-culture with Marinobacter sp. 3-2 in 96-well plate. (a) Maxi-mum chlorophyll flourescence during the incubation period under dif-ferent concentration of bicarbonate sodium. (b) Maximum growth rate of algal cultures calculated using Equation 2.1 during the incubation period under di↵erent concentrations of bicarbonate sodium. . . 23 2-3 Growth curves of axenic P. tricornutum and co-culture with
Mari-nobacter sp. 3-2 measured by chlorophyll a fluorescence under 96-well plate culture, where bicarbonate sodium was added to the media with di↵erent concentrations as follows: (a) 0 mM, (b) 1 mM, (c) 2 mM, (d) 5 mM, (e) 10 mM and (f) 20 mM. . . 24 3-1 Experimental setup for incubating E. coli in hydrogel-based di↵usion
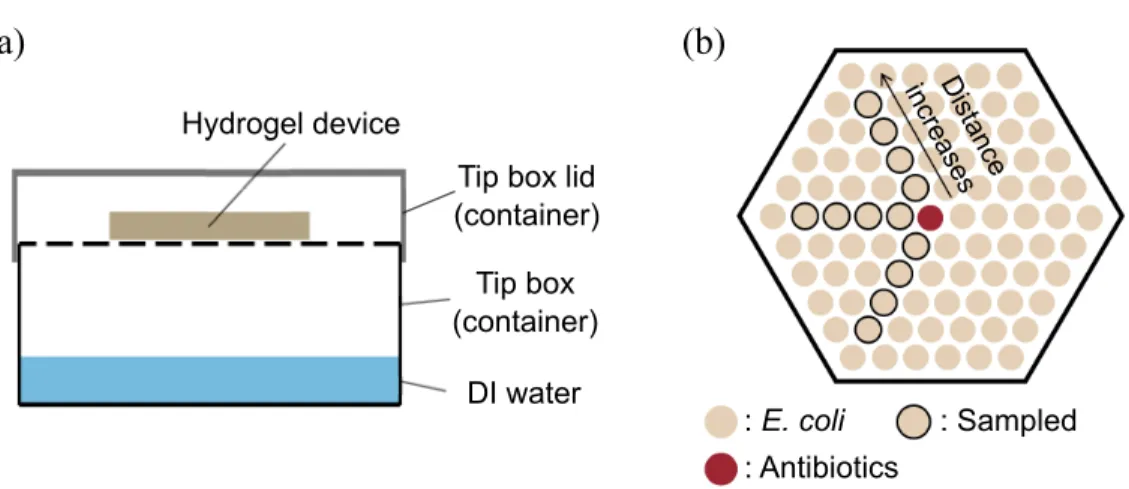
assay. (a) Side view of hydrogel device and its container where the water is constantly evaporated from the bottom and keeps the device hydrated. (b) Top view of a device where an antibiotic can di↵use through hydrogel barrier and a↵ects the growth of E.coli plated in each well. . . 30
3-2 (a) Growth measurements of E. coli after 6 h incubation in a hydrogel device treated with three di↵erent antibiotics. (b) Molecular structure of carbenicillin, tetracycline and kanamycin used in the experiment. . 32 3-3 Schematic diagrams of hydrogel devices to co-culture producer and
indicator strains. (a) A hexagonal design with the same dimensions as antibiotics di↵usion assay (see Figure 3-1). Wells are outlined for which cultures were sampled to quantify the cell abundance. (b) A multiwell design compatible with using multichannel pipettes. Wells plated with producer strain are denoted with red color and indicator strain with beige color. . . 34 3-4 Cell abundance measurements of indicator strain (BL21 AMK77, K12
T9002) in hexagonal hydrogel devices. Indicator strain is either co-cultured with BL21 AMK75 (test) or monoco-cultured with BL21 AMK77 (control). Averages of 4 measurements are displayed with standard deviation. Experiments repeated twice with indicator strain BL21 AMK77 (first two graphs) and once with strain K12 T9002 (third graph). 36 3-5 Visualization of cell abundances in multiwell hydrogel devices. Here
BL21 AMK75 and BL21 AMK77 strains are used as a producer and indicator strain respectively. In each experiment, strains were co-cultured (a) simultaneously for 16 h, (b) sequentially for 6 h or (c) sequentially for 13 h. . . 37 3-6 Absorbance readings using plate reader from multiwell-design hydrogel
devices, plotted by the distance from the producer strain. Averages of 6 reads under the same distance are plotted with standard deviation. Two strains were incubated (a) simulataneously for 16 h in Experiment 2 or (b) sequentially for 6–13 h in Experiment 3. . . 38
4-1 Schematic diagram of experimental setup for incubating P. tricornutum and bacterial communities in a hydrogel device. Bacterial cells are plated in surrounding wells located in a hexagonal array having three distances from the center. Algal cells (test) or f/2-Si medium without cells (control) is plated in the center well. . . 43 4-2 Principal coordinate analysis of bacterial community compositions
un-der two incubating conditions (with or without algal host at the center well). . . 45 4-3 Principal coordinate analysis of bacterial community compositions in
each layer under two incubating conditions (with or without algal host at the center well). P values were measured from testing permuta-tional multivariate analysis of variance with test and control samples. Asterisks denote statistical significance from the test at p 0.005. . . 46 4-4 Mean relative abundance of bacterial communities plotted by genera.
Values less than 0.5% were removed from the list. . . 47 C-1 Schematic diagram displaying wells that were contaminated by droplets
fallen by dewing in multilwell design of hydrogel devices, incubated for (a) 6 h and (b) 13 h. . . 53 C-2 chematic diagram displaying wells that were dried out by evaporation
in multilwell design of hydrogel devices, incubated for (a) 6 h and (b) 13 h. . . 54
List of Tables
3.1 Chemical properties and concentrations of three antibiotics used in the experiment [5]. . . 32 3.2 Bacterial strains used in the experiments. . . 34 3.3 Experimental conditions for co-culturing E. coli strains in hydrogel
Chapter 1
Overview of metabolic interaction
between algae and bacteria
1.1
Algae as biofuel source
Algae are considered as one of the promising renewable energy sources due to their high lipid productivity per area compared to other biofuel candidates such as land crops [31]. To cultivate a large amount of biomass for lipid production, it is critical to develop a system that allows a stable, scalable and cost-efficient environment for growing algal cells. Two widely known methods to meet these criteria are an outdoor open pond systems and closed bioreactors. Open pond systems allow algal species to grow under outdoor environment in a mass scale. On the other hand, closed bioreactors provide a more stable and controllable physiological condition for algae, however they require a higher cost to maintain throughout the incubating period [7, 11].
One major challenge dealing with a large scale of algal biomass is that various environmental conditions drive the system to become difficult to predict. Such con-ditions include fluctuating physiological parameters (sunlight, temperature) or an intrusion of unwanted microorganisms. Specifically, the culturing system produces large amounts of dissolved organic carbon via photosynthesis which is a nutritional source for hetetrotrophic microorganisms. This can sometimes result in a culture
failure (pond crash) if the intrusive microorganisms produce any algicidal compounds [10].
1.2
Phycosphere and bacterial community
Although the intrusion of heterotrophic bacteria to a mass algal culture is inevitable, e↵ort has been made to study how bacterial communities can coexist with the algal host. In general, a growth of heterotrophic bacteria is supported by metabolites produced by algae which called dissolved organic carbon (DOC).
On the single cell scale, there is a zone where algal exudate nutrients are rich and allows bacterial cells to thrive, called the “phycosphere”[1]. It has been hypothesized that the phycosphere would play a central role in algal-bacterial interaction due to a higher concentration of DOC can be generated near the algal cells by di↵usion. A direct visualization of the phycosphere was carried on by imaging movement of chemo-tactic bacteria in real-time that gather around a lysed algal cell [34]. By measuring the swimming speed of bacteria that is correlated to the gradient of algal metabolite concentration such as dimethylsulphoniopropionate [33], the researchers were able to verify that chemotactic activity can increase near the algal cell.
Another strategy for bacteria to exploit the algal exudates is by direct attachment. A number of bacterial species have been identified to show an ability to attach to the algal cell surface, especially for algicidal bacteria [22]. It has recently been revealed that long-term outdoor cultivation of algal species can create a favorable condition for heterotrophic bacteria to form a biofilm on the algal cell surface [30, 20]. Further-more, it has been shown that a long-term co-cultivation of algae with environmental bacterial commuinties can uniquely shape the structure of bacterial communities [19].
1.3
Metabolic interaction between algae and
bac-teria
Although a variety of bacterial taxa have been found to co-exist with algal cultures in the natural environment, analyzing detailed interaction between algae and bacterial communities has been difficult due to the complex nature underlying the multispecies system. Overall, marine bacteria use organic carbons exuded by diatoms for the growth and convert them into carbon dioxide. Generally called as a remineralization, the process can take a major part in carbon cycling in the ocean [1].
On the other hand, certain species of bacteria can produce micronutrients that can a↵ect the growth of algal host. One of the widely known micronutrients that is known to enhance algal growth is vitamins such as cobalamin (viatamin B12). Cobalamin has been long recognized as a requirement for many algal species since the cells do not have the metabolic ability to produce it. Another widely known micronutrient is metal ions such as iron which exists as a small organic compound (siderosphere) in aquatic environment. It has been revealed that vibrioferrin, one of the iron complex of siderospheres, can be produced by ocean bacteria such as the genus Marinobacter [2].
Parasitism between algae and bacteria has also widely been reported which plays a major role in terminating algal bloom in the ocean. Algicidal compounds that are produced by bacteria can span a wide variety of chemical structures depending on the algal host and bacterial species [25].
Chapter 2
Culture and maintenance of algal
species
To study algal species in a laboratory requires a proper practice to maintain algal culture without any external contamination. This section describes a protocol to prepare glassware and seawater media that are used to culture algal species and a measurement of growth using cell count and fluorescence of chlorophyll.
2.1
Preparation of seawater media and transfer of
algal cultures
F/2 media is one of the widely used nutrient-enriched seawater for culturing algal species. When using commercially available seawater, sea salt (Instant Ocean, Blacks-burg, VA) was first dissolved into deionized water (final concentration 30 g L 1) which
was then filtered with 0.2–1µm pore membrane to remove particulates. Then nutrient stocks were sequentially added as follows: 0.1% v/v of 75 g L 1sodium nitrate
(Sigma-Aldrich), 0.1% v/v of 5 g L 1 sodium phosphate monobasic monohydrate
(Sigma-Aldrich), 0.1% v/v of 30 g L 1 sodium metasilicate nonahydrate (Sigma-Aldrich),
0.1% v/v of trace metal solution (direct purchase from National Center for Marine Algae and Microbiota) and 0.05% v/v of vitamin solution. Vitamin solution stock
was prepared by adding 200 mg thiamine hydrochloride, 100 mg L 1 biotin and 1
g L 1 cyanocobalamin to a liter of deionized water. After adding stock nutrients the
medium was autoclaved and stirred for several hours to allow ambient air to dissolve into the media with final pH ⇠8.0. As silicic acid can enhance precipitation during the autoclaving procedure, it is preferred not to add when culturing algal species that do not require silicate to grow (called as f/2-Si media).
Axenic and co-culture algal stocks were regularly transferred on every 2–3 weeks by inoculating 100 µL culture into 7–10 mL f/2-Si media in glass tubes. To check for any contamination between cultures, samples were streaked on Zobell marine broth agar plate (15 g L 1 agar, 1 g L 1 yeast extract, 5 g L 1 peptone in filtered seawater)
and incubated at 30 C for 2–3 days until bacterial colonies start to appear. Algal stocks were maintained under a batch condition at 20 C in a 12 h light/12 h dark diurnal cycle (200 µmol m 2s 1).
2.2
Growth of axenic and xenic Phaeodactylum
tricornutum
Examining an abundance of culture is the first step to perform microbial research as it easily provides essential information on cell physiology to design the experiments [4]. In this section a growth experiment of axenic and bacterial co-cultures of algal species Phaeodactylum tricornutum is introduced. P. tricornutum is widely known as a model species for algal research as its growth is robust in a diverse environment with a high lipid productivity [13] and its genome has been fully sequenced allowing researchers to better understand physiological characteristics [8]. As a model species to co-culture with algae, bacterium Marinobacter sp. 3-2 is used in this experiment; genus Mariobacter is recognized as bacterial taxon that is commonly found in the ocean environment with algal host. The strain 3-2 has recently been isolated from an outdoor culture of P. tricornutum [30].
2.2.1
Materials and methods
Axenic culture of P. tricornutum was obtained from the National Center for Marine Algae and Microbiota (NCMA) and maintained in f/2 medium as described in Section 1.2.1. Co-culture stock of P. tricornutum and Marinobacter sp. 3-2 was created by inoculating a colony (grown on Zobell marine broth agar plate) into axenic algal culture and maintained for 1 year.
For algal growth measurement, stock cultures were inoculated into fresh f/2 medium to achieve a final algal density of ⇠1 ⇥ 105 cells ml 1. At least three biological
repli-cates of mono- and co-culture were created and incubated as described in Section 1.2.1. Throughout the experiment the following pre-sterilized culture vessels were used for incubation: 50 mL flasks (Corning), 16 mm-diameter glass tubes (Corning) and 96-well plates (Nunc). In order to test the e↵ect of dissolved inorganic carbon on the interaction between P. tricornutum and Marinobacter sp. 3-2, 0–20 mM sodium bicarbonate was added to the 96-well plate cultures.
Cell abundances were measured on every 24 hours either by counting the number of cells or by reading the flourescence intensity of chlorophyll a. For counting the cell numbers, 12 µL of samples were injected into a hemocytomter which was mounted on an inverted fluorescence microscope (Eclipse Ti, Nikon). Images were taken using Texas Red® filter to excite chloroplast of each cell under 4 times of magnification and were processed to count the cells using customized MATLAB codes (Mathworks) (Ap-pendix A). For measuring chlorophyll abundance, a plate reader (Varioskan, Thermo Scientific) was used to read chlorophyll a flourescence intensity with 430/660 nm ex-citation/emission wavelength, after plating 200 µL samples into 96-well plates. Algal growth rate (µ) was calculated by using chlorophyll flourescence as follows:
µN = ln
(Biomass on day N )
2.2.2
Results and discussion
Growth of axenic cultures P. tricornutum and co-cultures with Marinobacter sp. 3-2. under di↵erent culture vessels were measured by counting the number of cells or by reading chlorophyll flourescence intensities where the results are given in Figure 2-1. When the algal cells were cultured in either glass tubes or flasks, there was no significant di↵erence in cell density between axenic and xenic algal cultures, implying the existence of Marinobacter sp. 3-2 did not a↵ect the cell division of P. tricornu-tum. However, both axenic and co-cultures reached di↵erent maximum chlorophyll flourescence intensities depending on the culture vessels; flasks cultures had⇠4 times higher chlorophyll abundance than glass tube cultures whereas cell densities remained similar (Figure 2-1(b)). As flasks provide a higher surface area exposed to air com-pared to glass tube cultures, it was hypothesized that the aeration may play a role in expressing chlorophyll in algal cultures but not in the rate of cell division.
0 5 10 15 Time (days) 10-2 10-1 100 101 Chlorophyll a (RFU) Axenic (flasks) Co-culture (flasks) Axenic (tubes) Co-culture (tubes) 0 5 10 15 Time (days) 104 105 106 107
Cell density (cells mL
-1 ) Axenic (flasks) Co-culture (flasks) Axenic (tubes) Co-culture (tubes) (a ) (b)
Figure 2-1: Cell abundances of axenic P. tricornutum and co-culture with Marinobac-ter sp. 3-2. (a) Growth of algae measured by cell density under flask and glass tube cultures. (b) Growth of algae measured by chlorophyll abundance under flask and glass tube cultures.
To test the hypothesis axenic and bacterial co-cultures of P. tricornutum were incubated in 96-well plates where sodium bicarbonate was added with concentration ranging 0–20 mM as a source of dissolved organic carbon into the media. During the incubation the cell abundances were tracked by measuring fluorescence intensity of chlorophyll a on every 24 hours. Interestingly, co-culture with Marinobacter sp. 3-2
had several folds higher chlorophyll fluorescence compared to the axenic P. tricornu-tum, even when the bicarbonate sodium was not added to the media (Figure 2-2). Furthermore, the mutualistic e↵ect by Marinobacter sp. 3-2 on algal growth declined when sodium bicarbonate was added to the media with a higher concentration.
It is notable that when bicarbonate sodium was added to the media with a higher concentration (5–20 mM), there was no clear di↵erence of growth between axenic and co-culture of P. tricornutum, as shown in Figure 2-3 (d-f). One possible explanation could be that the mutualistic interaction was shadowed by a high concentration of bi-carbonate sodium over 5 mM which may no longer create any physiologically-relevant condition. 0 5 10 15 20 Bicarbonate concentration (mM) 0 1 2 3 4 5 Chlorophyll a (RFU) Axenic Co-culture 0 5 10 15 20 Bicarbonate concentration (mM) 0.2 0.4 0.6 0.8 1 1.2 1.4 Growth rate (d -1 ) Axenic Co-culture (a ) (b)
Figure 2-2: Summarized results of growth measurements of axenic P. tricornutum and co-culture with Marinobacter sp. 3-2 in 96-well plate. (a) Maximum chlorophyll flourescence during the incubation period under di↵erent concentration of bicarbonate sodium. (b) Maximum growth rate of algal cultures calculated using Equation 2.1 during the incubation period under di↵erent concentrations of bicarbonate sodium.
2 4 6 8 10 12 Time (days) 10-2 10-1 100 101 Chlorophyll a (RFU) 0 mM Axenic Co-culture 2 4 6 8 10 12 Time (days) 10-2 10-1 100 101 Chlorophyll a (RFU) 20 mM Axenic Co-culture 2 4 6 8 10 12 Time (days) 10-2 10-1 100 101 Chlorophyll a (RFU) 10 mM Axenic Co-culture 2 4 6 8 10 12 Time (days) 10-2 10-1 100 101 Chlorophyll a (RFU) 5 mM Axenic Co-culture 2 4 6 8 10 12 Time (days) 10-2 10-1 100 101 Chlorophyll a (RFU) 2 mM Axenic Co-culture 2 4 6 8 10 12 Time (days) 10-2 10-1 100 101 Chlorophyll a (RFU) 1 mM Axenic Co-culture (a) (b) (c) (d) (e) (f)
Figure 2-3: Growth curves of axenic P. tricornutum and co-culture with Marinobacter sp. 3-2 measured by chlorophyll a fluorescence under 96-well plate culture, where bicarbonate sodium was added to the media with di↵erent concentrations as follows: (a) 0 mM, (b) 1 mM, (c) 2 mM, (d) 5 mM, (e) 10 mM and (f) 20 mM.
Chapter 3
Hydrogel-based di↵usion assay for
studying bacterial growth
3.1
Background
In nature microbial species exist within communities, where metabolic interaction between microorganisms play a key role to sustain the complex system. One of the most efficient ways that microorganisms interact each other is by exchanging biomolecues cues via di↵usion. Molecular transport based on di↵usion can take much less time than by convection under an aquatic environment with a lengthscale of a microorganism (known as Kolmogorov scale) [1, 32]. Theoretical calculation also suggests that the microorganism can acquire 50 times more nutrients by molecular di↵usion than cellular swimming under low stirring number [37].
To understand how di↵usion contributes to microbial communication, attempts have been made to develop an in vivo co-culture platform that allows an observation of microbial species under a controlled environment. Membrane-based chambers are a widely accepted method for establishing such environment, which co-cultures two or more microbial species in each chamber where metabolites can di↵use through a porous membrane. Ichip, for example, provides an incubation of yet unculturable microbial species by allowing di↵usion of nutrient sources that are provided from the natural samples [27]. Dual-chamber system is another example, two chambers are
con-nected to each other by porous membrane which prevents physical contact but allows chemical communication between the two microbial species. This system has been de-veloped for several biological downstream analyses, such as plate reader-compatible in situ growth measurement [26], metabolomics [28], or microscope imaging for tracking cellular swimming [15] and biofilm formation [35].
As these methods have been introduced very recently challenges still exist in en-hancing the functionality of the platform. For example, when a permeable membrane is used for molecular di↵usion it has not been achieved to design a co-culture platform to incubate and sample more than two species. As the membrane cannot provide a firm support to the platform it is often combined with metal or plastic frame, and leakage can occur when it is sealed with gasket [35]. A frame that permits interaction between multiple species has proven difficult to design.
A fully structured, biocompatible hydrogel is one way to mitigate the issues with cell leakage and platform design that can still allow biomolecules to di↵use through. Photopolymerization of methacrylates can meet such requirements, as the chemi-cal crosslink under ultraviolet light maintains the hydrogel structure under a variety of biochemical conditions as well as providing strong mechanical stability. It has also been proven that the methacrylate-based hydrogel is biocompatible with cul-turing cells in vivo. For example, mammalian cells can be e↵ectively incubated on a layer of poly(2-hydroxethyl methacrylate-co-ethylene glycol dimethacrylate) (HEMA– EDMA) [17], where the copolymer has previously used as a surface coating [21] and gel chromatography [12].
With such biocompatibility and mechanical stability of HEMA–EDMA, in a recent paper by Ge et al. two engineered Escherichia coli strains were co-cultured in a multiwell chamber by maintaining chemical communication without physical contact between each other [16]. As an extension from this work, in the first section of this chapter, a protocol to synthesize HEMA–EDMA is described. In the subsequent two sections, it is shown how biomolecular di↵usion can be controlled to a↵ect the microbial growth in the hydrogel-based platform with incubation experiments using E. coli as a model species.
3.2
Material characterization of hydrogel-based
plat-form
3.2.1
Synthesis of nanoporous structured poly(2-hydroxethyl
methacrylate-co-ethylene glycol dimethacrylate) (HEMA–
EDMA)
Designing a hydrogel device
When designing a device dimension for microbial incubation it is necessary to consider a physical environment that the cells will be placed under. Typically 100–150 µL well volume can maintain enough cell culture without evaporation loss during several weeks of incubation. Wall thickness is another important parameter as it determines how e↵ective metabolites will di↵use between culture wells. If it is too thin, however, the wall can easily break due to brittle nature of phytopolymerized HEMA–EDMA; at least 1.3–1.5 mm of thickness is preferred to tolerate physical stress applied on the hydrogel. Finally, the design needs to be able to prevent any cross-contamination between adjacent wells, especially by maintaining the hydrogel region dry above the surface of the liquid culture. Ideally this is not possible to achieve because water penetrates into the pores in the hydrogel structure due to capillary e↵ect [18], and this will drag the meniscus of liquid culture near to the top of the device. To minimize the capillarity it is recommended to design a round shaped well and plate culture of a volume less than the half of the single well volume.
Preparation of acrylic and polydimethylsiloxane (PDMS) molds
A CAD software (Solidworks, Dassault Systmes) was used to design a hydrogel device. Drawing files were exported and an acrylic mold was created by lasercutting an 1/4” acrylic sheet (Universal Laser Systems). The surface of acrylic parts was cleaned by deionized water and dried out by blowing compressed air to remove any dust generated from lasercutting process. Acrylic adhesive (Weld-On Adhesive) and epoxy adhesive
(3M) were used to attach between acrylic parts and to the container (petri dish). After curing adhesives for ⇠18 h, polydimethylsiloxane (PDMS) (Sylgard 184, Dow Corning) was cast onto the acrylic mold and cured at 80 C for >3 h. PDMS mold was carefully detached from acrylic surface by dispensing isopropyl alcohol into the area between PDMS and acrylic molds.
Surface modification of glass substrate
In order to develop a covalent crosslink with HEMA–EDMA polymer, the glass surface was functionalized to incorporate an anchor-group for methacrylates [17]. In detail, a 75 mm ⇥ 50 mm glass slide was sequentially soaked in 1 M hydrochloric acid for 1 h, rinsed with deionized water, soaked in 1 M sodium hydroxide for 1 h and rinsed with deionized water. After drying the glass surface under the ambient air, 250µL solution containing 19% 3-(trimethoxysilyl)propyl methacrylate, 76% ethanol and 5% acetic acid was uniformly dropped on the substrate which was repeated twice after 30 min. The solution was removed from the glass slide by throughly rinsing with acetone. Polymerization of nanoporous HEMA–EDMA
Prepolymer solution HEMA–EDMA was first prepared by mixing a monomer 2-hydroxyethyl methacrylate (HEMA; 24 wt.%, Sigma-Aldrich), a crosslinker ethylene glycol dimethacrylate (EDMA; 16 wt.%, Sigma-Aldrich), a porogen 1-decanol (12 wt.%, Sigma-Aldrich) and cyclohexanol (48 wt.%, Sigma-Aldrich) and a photoinitia-tor 2,2-dimethoxy-2-phenylacetophenone (DMPAP; 1 wt.%), then the mixture was stored at room temperature under no light. The prepolymer solution was cast onto the PDMS mold and a glass slide was carefully placed on the mold with a direc-tion that the pre-treated surface meets the soludirec-tion (it is important not to allow any bubbles to penetrate into while the glass is being placed). The solution was then poly-merized under ultraviolet light with a wavelength 365 nm by using a commercial UV lamp (VWR) for 15 min. The photopolymerized devices were detached from PDMS mold and subsequently stored in a jar containing methanol (VWR), and the solvent was replaced every day twice to remove any porogen and uncrosslinked monomers
remaining in the hydrogel. Before the microbial incubation experiment the devices were immersed in an autoclaved glass jar with growth medium for two days (bacteria) or 1–2 weeks (algae).
3.3
Hydrogel-based antibiotics di↵usion assay for
incubating Escherichia coli
After characterizing the material property of polymer HEMA–EDMA, next it was explored whether the microbial growth can be controlled by biomolecular di↵usion in the hydrogel device. In the first experiment, three antibiotics were tested to inhibit a growth of wild type E. coli through di↵usion in the device.
In a disc assay for antibiotics, an agar plate is used where an antibiotic di↵uses through the gel matrix uniformly and creates a circular zone where bacterial growth is e↵ectively inhibited [36]. Inspired from this conventional disc assay, an experi-ment with a multiwell hydrogel device was designed to test di↵usion of antibiotics by incubating and measuring the growth of bacteria.
3.3.1
Materials and methods
Preparation of devices and antibiotics
Hydrogel devices were prepared as described in the Chapter 3.2.1, aseptically taken out from LB medium jar, and placed on a sterilized device container. At the bottom of the container 20 mL deionized water was poured to maintain the device hydrated during the incubation period (Figure 3-1(a)). In order to plate cells and an antibiotic on the device, culture medium was completely removed from each well. For test conditions three 10 µL antibiotic solutions (50 mg ml 1 carbenicillin, 25 mg ml 1
kanamycin, 5 mg ml 1 tetracycline in deionized water) were individually plated in
the center well located at the device. For a control condition deionized water was plated in the center well, and the experiments were replicated 3–4 times.
Strain and culturing condition
A wild type E. coli strain K12 was recovered from frozen glycerol stock by inoculating it into liquid LB medium and grown overnight (37 C, 250 r.p.m.). After diluting the cells at OD600 of ⇠ 0.005, 10 µL culture was directly plated into each well in the
device except for the center well. Experimental setup
The hydrogel devices with container was incubated at 37 C, 250 r.p.m. for 6 h. After the incubation 7 µL cells from each well were sampled and the absorbances (wavelength 600 nm) were measured using a microcuvette (Agilent) and UV-vis spec-trophotometer (Shimadzu). In each device, three directions with an equal distance from the center and four distances in a same direction were chosen to measure cell abundances (Figure 3-1(b)). : E. coli : Antibiotics : Sampled Distance increa ses (b) (a) Hydrogel device
Tip box lid (container) Tip box (container)
DI water
Figure 3-1: Experimental setup for incubating E. coli in hydrogel-based di↵usion assay. (a) Side view of hydrogel device and its container where the water is constantly evaporated from the bottom and keeps the device hydrated. (b) Top view of a device where an antibiotic can di↵use through hydrogel barrier and a↵ects the growth of E.coli plated in each well.
3.3.2
Results and discussion
Inhibition of bacterial growth is spatially a↵ected by antibiotic di↵usion Bacterial abundance from hydrogel well at di↵erent distances from the center was measured after 6 h of incubation as shown in Figure 3-2(a). The result showed that the bacterial growth was inhibited less when the culture well was located farther away from the center, suggesting that the amount of antibiotics that has reached to the well decreased followed by di↵usion. Also optical densities of E. coli plated adjacent to the center were near to zero, implying the copolymer HEMA–EDMA can serve as a porous material for molecular transport. Furthermore, plating each antibiotic at the center resulted in a distinct inhibitory level on E. coli growth along the distance from the center. For instance, carbenicillin was the strongest antibiotic that blocked any microbial growth over three row-distances from the center.
Molecular properties can correlate the antimicrobial activity on bacteria To explain the di↵erences in inhibitory level by antibiotics on E. coli, their molecular structures and chemical properties were compared to each other as shown in Figure 3-2(b) and Table 3.1. First, by comparing minimum inhibitory concentrations (MIC) to their actual values used for the experiment, it can be assumed that the amount of tetracycline was less severe than other antibiotics to impact the bacterial growth. Sec-ond, the partition coefficients were di↵erent between carbenicillin and kanamycin as well as their molecular structure, implying two antibiotics would have di↵erent bind-ing affinities to the copolymer HEMA–EDMA. As hydroxethyl methacrylate (HEMA) harbors a hydrophilic pendent group it is likely that carbenicillin can bind better to the copolymer than kanamycin.
It should be noted that performing additional experiments can provide a better insight on the current growth measurements. Specifically, during the incubation with hydrogel devices bacterial cells are continuously exposed with antibiotic where its con-centration can be estimated by each well location. In order to decouple the factors a↵ecting the microbial growth in the current results, two experimental designs are
suggested. First experiment is to measure di↵usivity of antibiotic that pass through the hydrogel substrate. This will enable accurate modeling of concentration distri-bution across the wells in a device. Second experiment is to study growth response of bacteria by varying concentration of antibiotics under MIC. The relationship be-tween the abundance and antimicrobial concentration (as similar to dose–response) can provide a more systematic understanding on the current results with hydrogel incubation.
Kanamycin Tetracycline
Carbenicillin
(a) (b)
Figure 3-2: (a) Growth measurements of E. coli after 6 h incubation in a hydrogel device treated with three di↵erent antibiotics. (b) Molecular structure of carbenicillin, tetracycline and kanamycin used in the experiment.
Carbenicillin Tetracycline Kanamycin Molecular weight (g mol 1) 378.4 444.435 484.5
Concentration used (mg ml 1) 50 5 25
Minimum inhibitory
concentration (MIC) (µg ml 1) 2 1 1
Partition coefficient 1.13 -1.3 -6.3
Table 3.1: Chemical properties and concentrations of three antibiotics used in the experiment [5].
3.4
Communication between genetically engineered
E. coli strains in hydrogel-based assay
After verifying that structured HEMA–EDMA can e↵ectively control biomolecular di↵usion that a↵ects bacterial growth, it was further explored whether microbial in-teraction can occur via chemical di↵usion under this hydrogel-based platform. In this section, co-culture experiments of two genetically engineered E. coli strains are introduced, where an antimicrobial peptide was produced from one strain and in-hibited a growth of another strain. The procedures were proposed and discussed in order to observe a clear communication between two bacterial strains under various co-culturing conditions in the hydrogel-based platform.
3.4.1
Materials and methods
Strains and device preparation
Three genetically engineered E. coli strain BL21 AMK75, BL21 AMK77 and K12 T9002 were provided by C. Vaiania (Voigt Lab) and Q. Wang. A “producer” strain BL21 AMK75 can generate microcin C which is a class of small antibacterial agent (< 10 kDa), and the growth of “indicator” strains, BL21 AMK77 and K12 T9002 is inhibited by microcin C [24]. All strains were genetically modified to express an amplicillin-resistant gene (Table 3.2). The cells were recovered from frozen glycerol stock by inoculating into liquid LB medium with carbeniciilin (50 µg ml 1). The
inocula were grown for 16 h at 37 C, 250 r.p.m.. Hydrogel devices were prepared as described in the Chapter 3.2.1 with liquid LB medium added with carbenicillin (50 µg ml 1).
Experimental design
To explore whether two E. coli strains can communicate each other via di↵usion of microcin through the hydrogel, the assays were designed in a way to resemble an agar-based bacterial lawn method [36]. As summarized in Figure 3-3, the protocols
E. coli strain Description Source Producer BL21 AMK75 Ampicillin resistant, produces
microcin C by expressing pAMK-164
C. Vaiania (Voigt Lab) Indicator BL21 AMK77 Ampicillin resistant C. Vaiania
(Voigt Lab) Indicator K12 T9002 Ampicillin resistant
(expresses pSB1A3) Q. Wang Table 3.2: Bacterial strains used in the experiments.
were sequentially modified from the previous ones to optimize observation of strain-to-strain communication. In all experiments, a control condition was designed by replacing plate strain BL21 AMK75 with BL21 AMK77 on the center well with the same initial cell density (row 5 column 6) as shown in Figure 3-3(b).
(a)
(b)
Figure 3-3: Schematic diagrams of hydrogel devices to co-culture producer and indica-tor strains. (a) A hexagonal design with the same dimensions as antibiotics di↵usion assay (see Figure 3-1). Wells are outlined for which cultures were sampled to quan-tify the cell abundance. (b) A multiwell design compatible with using multichannel pipettes. Wells plated with producer strain are denoted with red color and indicator strain with beige color.
Incubation, sample collection and analysis
To incubate the hydrogel devices, bacterial cultures previously grown overnight were diluted at the rates listed in Table 3.3. After removing the LB medium from the devices 20 µl cells were plated in each well. Specifically, whereas in experiment 1 and 2 the strains were incubated simultaneously, in experiment 3 indicator strain was plated after incubating producer strain for 24 h to allow microcin C to di↵use
No. Geometry Strains used Dilution rate (P, I)
Incubation
time (h) Co-culture timing 1 Hexagonal K12 T9002 BL21 AMK75 BL21 AMK77 5⇥ 102, 106 16 Simultaneous 2 Multiwell BL21 AMK75 BL21 AMK77 5⇥ 10 2, 107 16 Simultaneous 3 Multiwell BL21 AMK75 BL21 AMK77 103, 106 24 (P) + 6, 12 (I) Sequential Table 3.3: Experimental conditions for co-culturing E. coli strains in hydrogel devices (P: producer strain, I: indicator strain).
throughout the wells.
After incubation the cultures were sampled to quantify the cell abundance from each well in the device. In experiment 1, each sample was diluted by 10 times (from 5µl), 7 µl of cells was transferred to microcuvette (Agilent) and their abundance was measured by UV-vis spectrophotometer (Shimadzu) (600 nm wavelength). In experi-ment 2 and 3, 10µl samples were diluted by 10 and 5 times respectively, transferred to 96-well plates and their abundances were measured by plate reader (Varioskan) (600 nm wavelength). The reads were plotted by visualizing with color using a customized MATLAB code (Mathworks) (Appendix B).
3.4.2
Results and discussion
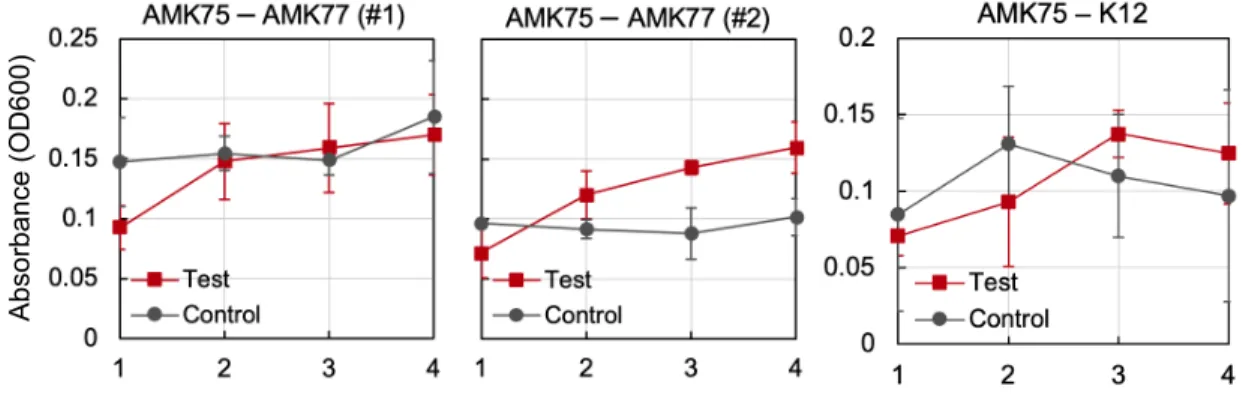
Growth results of E. coli strains cultured in hexagonal and multiwell hydrogel devices are shown in Figure 3-4 and 3-5. As seen in the first two graphs in Figure 3-4, for test condition using strain BL21 AMK77 as an indicator a continuous increase of absorbance was observed as the wells are located farther away from the producer strain, whereas there was no clear tendancy of absorbance in control over the well locations. Specifically, for wells adjacent to the center (row 1) in all two replicating experiments, the absorbance reads were lower when the indicator strains were co-cultured with producer strain, indicating the growth inhibition applied by E. coli strain BL21 AMK75.
Distance from the producer strain (number of rows)
Absor
bance (OD6
00)
Figure 3-4: Cell abundance measurements of indicator strain (BL21 AMK77, K12 T9002) in hexagonal hydrogel devices. Indicator strain is either co-cultured with BL21 AMK75 (test) or monocultured with BL21 AMK77 (control). Averages of 4 measurements are displayed with standard deviation. Experiments repeated twice with indicator strain BL21 AMK77 (first two graphs) and once with strain K12 T9002 (third graph).
a few technical limitations were observed which has led to design the device with multiwell geometry. First, there was a significant loss of culture volume due to evap-oration during the 16 h incubation period, especially for wells located at the boundary on a device. Although the evaporation was inevitable due to a continuous exposure of the device to the air, it was explored whether the evaporation can be minimized by increasing the well volume. Second, the cell abundance measurements using mi-crocuvette resulted in a high inaccuracy, because of a low sampling volume as well as an excessive time consumed to wash the microcuvette at every measurement. To circumvent these disadvantages a multiwell hydrogel device was devised to provide 1) easier steps for reading the absorbance using multichannel pipette and 96-well plate reader and 2) higher well volumes to minimize the culture loss by evaporation.
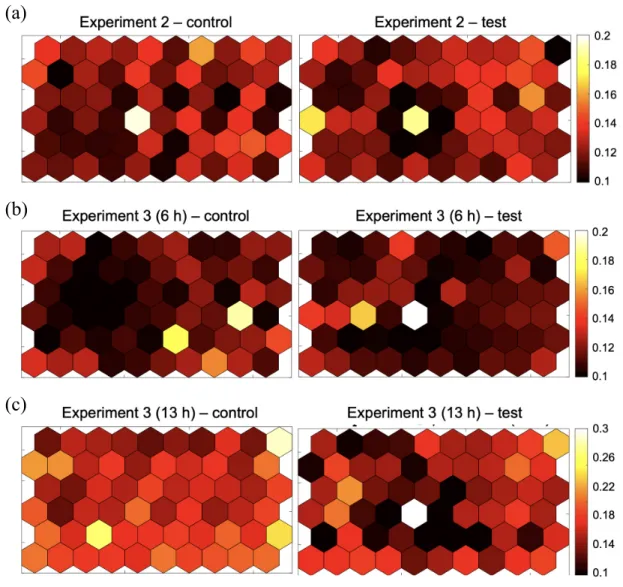
As expected, by using multiwell hydrogel devices compatible with multichannel pippettes, the measurement time was significantly reduced by reconstructing the in-formation on cell abundance from every well with Matlab code (Figure 3-5, Appendix B). However, as a significant volume loss by evaporation was still observed for wells located at the boundary (Appendix C), the reads were excluded from the visualiza-tion. Another shortcoming on the multiwell design was that a few wells have been
contaminated by droplets fallen from the container lid during the incubation period (Appendix C).
(a)
(b)
(c)
Figure 3-5: Visualization of cell abundances in multiwell hydrogel devices. Here BL21 AMK75 and BL21 AMK77 strains are used as a producer and indicator strain respectively. In each experiment, strains were co-cultured (a) simultaneously for 16 h, (b) sequentially for 6 h or (c) sequentially for 13 h.
In order to quantitatively compare the cell abundances between test and control conditions, the absorbance readings were plotted by the distance from the producer strain as shown in Figure 3-6. In experiment 2 where two strains were co-cultured simultaneously, a positive correlation is observed between the absorbance and the distance from the producer strain. This implies a gradient of microcin C concentration can be generated throughout the device during the bacterial growth. On the other
hand, when indicator strain was sequentially plated after incubating producer strain for 24 h, it was only after 13 h of co-culture when the growth indicator strain started to be inhibited by the producer strain (Experiment 3, Figure 3-6(b)). The two growth measurements with di↵erent incubation period indicate that there may exist a critical timepoint on the growth phase of E. coli where the inhibitory e↵ect by microcin C begins [24].
(a) (b)
Figure 3-6: Absorbance readings using plate reader from multiwell-design hydrogel devices, plotted by the distance from the producer strain. Averages of 6 reads under the same distance are plotted with standard deviation. Two strains were incubated (a) simulataneously for 16 h in Experiment 2 or (b) sequentially for 6–13 h in Experiment 3.
3.5
Concluding remarks
In this chapter, a hydrogel-based platform was introduced for incubating microbial species exposed under di↵usion of growth inhibitor throughout the device. In the first experiment using hydrogel devices as antibiotics di↵usion assay, di↵erent antibiotics were tested how they can di↵use through the hydrogel wall to inhibit the growth of E. coli. In the second experiment two genetically engineered E. coli strains were co-cultured to see if they can communicate via di↵usion of microcin C as an antimi-crobial peptide. The two incubation experiments show that the structured copolymer HEMA–EDMA can be used as a promising material for incubating microbial species while systematically controlling the di↵usion of biomolecules. Nonetheless, it remains
to be explored how the incubation protocol can be further optimized to prevent tech-nical issues during the experiment such as evaporation.
Chapter 4
Hydrogel-based co-culture
platform for studying bacterial
communities with algal host
4.1
Background
Microbial interaction between algae and associated bacteria has been recognized as one of the major contributions to the ocean ecosystem [1] and biofuel production [9]. There is a growing evidence that the algal-bacterial interaction can occur in a diverse way such as direct cell-to-cell attachment [19, 30, 20, 22], chemotaxis [33, 34, 15] or exchange of biomolecules within a phycosphere [1, 32]. It has been shown that the community structure of bacteria can be uniquely shaped by the algal host [19, 20, 6] through these processes, although it still remains unclear why specific bacterial taxa can respond to the algal host during long-term co-cultivation.
One widely known factor on shaping the community structure of associated bac-teria is metabolite di↵usion of algal exudate, as in the oceanic environment most bacterial taxa can exploit nutrients via di↵usion process [37]. However it has been challenging to assess the e↵ect of di↵usion process since the conventional batch co-culture system does not provide to do so.
In this chapter, a hydrogel-based platform is introduced as a tool to study how bacterial community structures are shaped by their location from the algal host. As similar to the previous chapter a spatially defined environment is given within the hydrogel device where algal exudate can reach out to the surrounding communities with di↵erent concentration.
4.2
Materials and Methods
4.2.1
Strains and culturing conditions
For algal species axenic P. tricornutum was obtained and its stock culture was main-tained as described in Section 1.2.2. For bacterial communities, two types of culture were obtained from Lawrence Livermore National Laboratory (CA, USA) [19, 30]. In brief, bacterial filtrate was first generated from an outdoor sample by removing larger algal cells with 0.6–1µm filter (“seawater communities”). Then enriched communities associated with algal phycosphere were generated after co-culturing the bacterial fil-trate with P. tricornutum, then centrifuging to enrich bacterial cells that are attached to the surface of algal cells (“phycosphere enrichments”). Two bacterial community samples were maintained by co-culturing with P. tricornutum until being used for the experiment, under a batch condition at 20 C in a 12 h light/12 h dark diurnal cycle (200 µmol m 2s 1).
4.2.2
Experimental design and preparation of hydrogel
plat-form
In order to analyze bacterial community structure at di↵erent distances from the algal host, hydrogel devices were designed to allow incubation of an array of bacterial wells simulatneously, similar to the previous chapter as shwon in figure 4-1. In detail, for incubating bacterial comunities three di↵erent distances from the center were designed in a hydrogel device. On the outmost layer, sterile f/2 medium was plated in order to prevent evaporation from the cultures during the incubation period. To see if there is
a change in structure of bacterial communities by the presence of algal host,⇠1 ⇥ 106
cells ml 1 of P. tricornutum was plated in the center well (test condition) and the
results were compared to control condition where algal cells were not plated in the center well. Phycosphere enrichment samples were used as a bacterial community which were plated in the surrounding wells in the hexagonal array.
Figure 4-1: Schematic diagram of experimental setup for incubating P. tricornutum and bacterial communities in a hydrogel device. Bacterial cells are plated in sur-rounding wells located in a hexagonal array having three distances from the center. Algal cells (test) or f/2-Si medium without cells (control) is plated in the center well. The hydrogel device was prepared as described in Chapter 2.2.1 with f/2 medium when immersing the devices in the jar for a week. The devices were taken out from the jar and placed onto incubating container (GasPak EZ container systems, BD) which was filled with f/2 medium to maintain the environment hydrated throughout the incubating period. All preparation steps were performed under sterile condition with a laminar flow hood to prevent any contamination. The container with hydrogel devices were incubated for one week, at 20 C in a 12 h light/12 h dark diurnal cycle (200 µmol m 2s 1).
4.2.3
Sample collection, sequencing and analysis
After a week of incubation, 100 µl samples were collected by tranferring into 96-well filter plates. After washing the cells once with deionized water and removing any liquid media from the samples, the filter plate was stored in -20 C for further analysis. DNA was extracted from the frozen samples by heat lysing and a number of PCR cycles were performed accordingly. The PCR contained 140 µl of 5 prime mix, 1.4 µl of 100 µM forward 16S primer, 1.4 µl of 100 µM reverse 16S primer and 207.2 µl of DNA template. Cycling conditions were as follows: denaturation at 94 C for 3 min, followed by 35 cycles of denaturation at 94 C for 45 s, annealing at 51 C for 30 s and extension at 72 C for 1.5 min. The final extension was conducted at 72 C for 10 min and the samples were hold at 4 C. After amplifying 16S ribosomal RNA genes with PCR the samples were sequenced on an Illumina MiSeq. After retrieving ribosomal amplicon sequence variants (ASVs) the read pairs were trimmed, aligned using Muscle [14] and grouped into a tree with fasttree [29]. Sequences were analyzed by R using phyloseq package 1.30.0 [23]. Samples with total reads less than 100 were removed. Phyloseq 1.30.0 was used to perform Principle Coordinate Analysis (PCoA) and vegan 2.5.6 was used to perform permutational multivariate analysis of variance (PERMANOVA) [3].
4.3
Results and discussion
4.3.1
Bacterial communities are spatially a↵ected by
di↵u-sion of algal exudates
After obtaining the ASV table of 16S rRNA gene, it was explored whether the com-munity structure of bacterial samples can be a↵ected by the presence of algal host. To do this, principle coordinate analysis was visualized on all samples including control and test conditions and their statistical di↵erence was tested using PERMANOVA, as shown in Figure 4-2. With a significance p = 0.005, the hypothesis was rejected that the test and control conditions are similar to each other. Overall, the result
suggests a proof of concept with the hydrogel platform to culture algae and bacterial community.
Figure 4-2: Principal coordinate analysis of bacterial community compositions under two incubating conditions (with or without algal host at the center well).
Next, it was further explored whether the bacterial community structures can be a↵ected by the location of culture wells, specifically on the distance from the center (algal host). After grouping the samples by layer PERMANOVA test was performed to see whether there is a statistical di↵erence between two incubating conditions (test and control) in each layer-based group. Interestingly, a statistical significance (p 0.005) on the di↵erence between two conditions was observed for samples that were plated in wells in layers 1 and 3.
4.3.2
Individual bacterial taxa have unique growth
depen-dency to algal host
After comparing community structures of bacteria that were co-cultured with algal host to the negative control, an abundance of each taxon was quantified to see which bacterial taxa were responsible for the potential di↵erence in their structures. The relative abundance of each taxon was calculated by merging counts of each ASV under
Figure 4-3: Principal coordinate analysis of bacterial community compositions in each layer under two incubating conditions (with or without algal host at the center well). P values were measured from testing permutational multivariate analysis of variance with test and control samples. Asterisks denote statistical significance from the test at p 0.005.
the same genus and dividing them to the total ASV counts of sample in each well. The mean relative abundances and standard deviations were calculated from 18 samples from the equal layer value and incubating condition (6 wells in a layer of device, 3 devices in total). As shown in Figure 4-4, three genera (Algoriphagus, Oceanicaulis and Muricauda) displayed a specific trend depending on the layer (distance from the center) and culturing conditions. In detail, they showed a relatively higher abundance in the layer 1 when co-cultured with algal host compared to the control; however, for the samples plated in layer 3 wells the genera showed an opposite trend. The results here imply that there exists a potential metabolic dependency of specific genera on P. tricornutum among the phycosphere-enriched communities.
4.4
Limitations and future work
Although the results suggest hydrogel devices can be used as a novel co-culture plat-form for metabolic communication between P. tricornutum and bacterial communi-ties, the trends observed from the relative mean abundances are less convincing due to the large errors between replicates. Future work targets identification of a di↵erent approach to better interpret the current sequencing data with less error.
Figure 4-4: Mean relative abundance of bacterial communities plotted by genera. Values less than 0.5% were removed from the list.
Another limitation is the current incubating procedures for microbial cells in the hydrogel devices. To prevent evaporation during the incubation period, all devices were submerged in a f/2-Si medium and it allowed unwanted metabolite exchange between the devices. Specifically, this can a↵ect the bacterial community structures under control condition (no algal cells at the center) by exposing them with algal exudates di↵used from the test condition through the medium outside of the device. The incubating environment may be enhanced by using separate dishes between dif-ferent condition to keep the devices hydrated without the cross-exchange of algal metabolites.
Appendix A
MATLAB code for counting the
number of algal cells from
microscope images
1 % % 11/1/18 Created by H y u n g s e o k Kim ( h s k i m m @ m i t . edu ) ,
2 % % 10/4/19 Modified , due to a change in img size (2048 px
-in 4 X )
3 clc ; clear ; close all ;
4 set (0 , ’ D e f a u l t A x e s F o n t N a m e ’ , ’ Calibri ’) 5 set (0 , ’ D e f a u l t A x e s F o n t S i z e ’ , 15) 6 set (0 , ’ D e f a u l t A x e s f o n t W e i g h t ’ , ’ normal ’) 7 set (0 , ’ D e f a u l t T e x t F o n t N a m e ’ , ’ Calibri ’) 8 set (0 , ’ D e f a u l t T e x t F o n t S i z e ’ , 15) 9 set (0 , ’ D e f a u l t T e x t f o n t W e i g h t ’ , ’ bold ’) 10 11 fileloc = { ’ 2019 -09 -21 ’ }; 12 N = size ( fileloc ,2) ; 13 dens = zeros (N ,6) ; 14 vol = 0.4910 e -3; % mL 15 dil = 1; 16 17 for t = 1: N 18 cd ( ’D :\ Algae - b a c t e r i a \2019 -09 -19 Pt Ax ,+ ARW1R1 ,+
-ARW1Y1 ,+ ARW7G5W ( glass tubes ) ’) ;
19 cd ( fileloc { t }) ;
20 for i = 1:3 % R e p l i c a t e
22 for j = 1:5 % Window s e q u e n c e 23 A = imread ( sprintf ( ’ Pt + A R W 7 G 5 W _ R % -d _ T x R e -d _ 4 X _ D i l % -dx_ %02 -d . jpg ’ ,i , -dil , j ) ) ; 24 if size ( size ( A ) ,2) == 3 25 A2 = r g b 2 g r a y ( A ) ; 26 A2 = i m b i n a r i z e ( A2 , ’ global ’) ; 27 else , A2 = i m b i n a r i z e (A , ’ global ’) ; 28 end 29 [L , n ] = bwlabel ( A2 ) ; 30 cnt = cnt + n ; 31 disp ( n ) ; 32 end
33 dens (t , i ) = cnt /( vol * j ) * dil ( t ) ;
34 end
Appendix B
MATLAB code for visualizing
absorbance reads from plate reader
(hydrogel device multiwell design)
1 % % 10/1/19 Created by H Y U N G S E O K KIM ( h s k i m m @ m i t . edu )
2 clc ; clear ; close all ;
3 set (0 , ’ D e f a u l t A x e s F o n t N a m e ’ , ’ Calibri ’) 4 set (0 , ’ D e f a u l t A x e s F o n t S i z e ’ , 15) 5 set (0 , ’ D e f a u l t A x e s f o n t W e i g h t ’ , ’ normal ’) 6 set (0 , ’ D e f a u l t T e x t F o n t N a m e ’ , ’ Calibri ’) 7 set (0 , ’ D e f a u l t T e x t F o n t S i z e ’ , 20) 8 set (0 , ’ D e f a u l t T e x t f o n t W e i g h t ’ , ’ normal ’) 9 10 l = 8; % # rows 11 b = 12; % # cols 12 str = { ’ ctrl ’ , ’ test ’ }; 13 str2 = { ’ Control ’ , ’ Test ’ }; 14 hrs = [6 , 13];
15 cd ( ’C :\ Users \ hskim \ Desktop \ LEMI \ Co - polymer with Chris
-\2019 -10 -31 _AMK75 &77 ’) ;
16 rd = zeros (l ,b ,4) ; % 1 -2 for 6 hrs , 3 -4 for 13 hrs
17 for i = 1:4
18 stk = zeros (l , b ) ;
19 for run = 1:5
20 raw = dlmread ( sprintf ( ’% dhrs_ % s_ % d . txt ’ , hrs ( ceil (
21 str {1*( mod (i ,2) ==1) +2*( mod (i ,2) ==0) } , run ) , ’\ t -’ ,[4 1 11 12]) ;
22 blk = mean ( raw (1 ,:) ) ; % blank media
23 raw = raw - blk ; % offset by blank media
24 stk = stk + raw ; 25 end 26 rd (: ,: , i ) = stk / run ; 27 end 28 29 xhex = [0 1 2 2 1 0]; % x - c o o r d i n a t e s of the v e r t i c e s 30 yhex = [2 3 2 1 0 1]; % y - c o o r d i n a t e s of the v e r t i c e s 31 boxloc = [100 100; 800 100; 100 600; 800 600]; 32 33 % figure ( ’ Position ’ ,[100 ,100 ,800 ,950]) ; 34 for j = 1:4 35 figure ( ’ P o s i t i o n ’ ,[ boxloc (j ,:) ,700 ,250]) ; 36 % subplot (2 ,1 , j ) ; 37 C = rd (: ,: , j ) ; 38 for i = 1: b % column 39 for k = 2: l -1 % row
40 patch (( xhex + mod (k ,2) ) +2*( i -1) , yhex +2*( k -1)
-,...
41 C ( l +1 - k ,6* mod ( i +1 ,2) + ceil ( i /2) ) ) ; %
-i n c l u d e s the f-irst column
42 % patch (( xhex + mod (k ,2) ) +2*( i -1) , yhex +2*( k -1)
-,...
43 % C ( l +1 - k ,6* mod (i ,2) + floor ( i /2) +1) ) ; %
-does not include the first column
44 hold on ;
45 end
46 end
47 % patch (( xhex + mod (4 ,2) ) +2*5 , yhex +2*3 , ’ w ’) ;
48 title ( sprintf ( ’% dhrs , % s ’ , hrs ( ceil ( j /2) ) , str2 {1*( mod (
-j ,2) ==1) +2*( mod (-j ,2) ==0) }) ) ;
49 axis ([ - inf inf - inf inf ]) ;
50 set ( gca , ’ Y T i c k L a b e l ’ ,[]) ; 51 set ( gca , ’ X T i c k L a b e l ’ ,[]) ; 52 caxis ([0 0.5]) ; 53 box on ; 54 c o l o r b a r ; 55 c o l o r m a p ( hot ) ; 56 end
Appendix C
Shortcomings in mutiwell hydrogel
devices
(a)
(b)
Experiment 3 (6 h), control Experiment 3 (6 h), test
Experiment 3 (13 h), control Experiment 3 (13 h), test
Figure C-1: Schematic diagram displaying wells that were contaminated by droplets fallen by dewing in multilwell design of hydrogel devices, incubated for (a) 6 h and (b) 13 h.
(a)
Experiment 3 (13 h), control Experiment 3 (13 h), test
(b)
Experiment 3 (6 h), control Experiment 3 (6 h), test
Figure C-2: chematic diagram displaying wells that were dried out by evaporation in multilwell design of hydrogel devices, incubated for (a) 6 h and (b) 13 h.
Bibliography
[1] S. A. Amin, M. S. Parker, and E. V. Armbrust. Interactions between Diatoms and Bacteria. Microbiology and Molecular Biology Reviews, 76(3):667–684, sep 2012.
[2] Shady a Amin, David H Green, Mark C Hart, Frithjof C Kºpper, William G Sunda, and Carl J Carrano. Photolysis of iron siderophore chelates promotes bacterial algal mutualism. Proceedings of the National Academy of Sciences, 106(40):17071–17076, 2009.
[3] Marti J. Anderson. A new method for non-parametric multivariate analysis of variance. Austral Ecology, 26(1):32–46, 2001.
[4] Robert A. Anderson. Algal culturing techniques. Academic Press, 2005.
[5] Jennifer M. Andrews. Determination of minimum inhibitory concentrations. Journal of Antimicrobial Chemotherapy, 48(suppl 1):5–16, jul 2001.
[6] Gregory Behringer, Michael A. Ochsenk¨uhn, Cong Fei, Jhamal Fanning, Julie A. Koester, and Shady A. Amin. Bacterial communities of diatoms display strong conservation across strains and time. Frontiers in Microbiology, 9(APR):1–15, 2018.
[7] Michael A. Borowitzka. Commercial production of microalgae: ponds, tanks, and fermenters. In Journal of Biotechnology, volume 70, pages 313–321. 1999. [8] Chris Bowler, Andrew E. Allen, Jonathan H. Badger, Jane Grimwood, Kamel
Jabbari, Alan Kuo, Uma Maheswari, Cindy Martens, Florian Maumus, Robert P. Otillar, Edda Rayko, Asaf Salamov, Klaas Vandepoele, Bank Beszteri, Ansgar Gruber, Marc Heijde, Michael Katinka, Thomas Mock, Klaus Valentin, Fr´ederic Verret, John A. Berges, Colin Brownlee, Jean Paul Cadoret, Anthony Chiovitti, Chang Jae Choi, Sacha Coesel, Alessandra De Martino, J. Chris Detter, Colleen Durkin, Angela Falciatore, J´erome Fournet, Miyoshi Haruta, Marie J.J. Huys-man, Bethany D. Jenkins, Katerina Jiroutova, Richard E. Jorgensen, Yolaine Joubert, Aaron Kaplan, Nils Kr¨oger, Peter G. Kroth, Julie La Roche, Erica Lindquist, Markus Lommer, V´eronique Martin-J´ez´equel, Pascal J. Lopez, Susan Lucas, Manuela Mangogna, Karen McGinnis, Linda K. Medlin, Anton Montsant,
Marie Pierre Oudot Le Secq, Carolyn Napoli, Miroslav Obornik, Micaela Schnit-zler Parker, Jean Louis Petit, Betina M. Porcel, Nicole Poulsen, Matthew Robi-son, Leszek Rychlewski, Tatiana A. RynearRobi-son, Jeremy Schmutz, Harris Shapiro, Magali Siaut, Michele Stanley, Michael R. Sussman, Alison R. Taylor, Assaf Vardi, Peter Von Dassow, Wim Vyverman, Anusuya Willis, Lucjan S. Wyrwicz, Daniel S. Rokhsar, Jean Weissenbach, E. Virginia Armbrust, Beverley R. Green, Yves Van De Peer, and Igor V. Grigoriev. The Phaeodactylum genome reveals the evolutionary history of diatom genomes. Nature, 456(7219):239–244, 2008. [9] Laura T. Carney and Todd W. Lane. Parasites in algae mass culture. Frontiers
in Microbiology, 5(JUN):1–8, 2014.
[10] Laura T. Carney, Joshua S. Wilkenfeld, Pam D. Lane, Owen D. Solberg, Zachary B. Fuqua, Nina G. Cornelius, Shaunette Gillespie, Kelly P. Williams, Tzachi M. Samocha, and Todd W. Lane. Pond Crash Forensics: Presumptive identification of pond crash agents by next generation sequencing in replicate raceway mass cultures of Nannochloropsis salina. Algal Research, 17:341–347, jul 2016.
[11] Yusuf Chisti. Biodiesel from microalgae. Biotechnology Advances, 25(3):294–306, 2007.
[12] J. Coupek, M. Krivakova, and S. Pokorny. New Hydrophilic Materias for Chromatography: Glycol Methacrylates. J Polym Sci, Part C, Polym Symp, 42(42):185–190, 1973.
[13] Fayza Daboussi, Sophie Leduc, Alan Mar´echal, Gwendoline Dubois, Val´erie Guyot, Christophe Perez-Michaut, Alberto Amato, Angela Falciatore, Alexan-dre Juillerat, Marine Beurdeley, Daniel F. Voytas, Laurent Cavarec, and Philippe Duchateau. Genome engineering empowers the diatom Phaeodactylum tricornu-tum for biotechnology. Nature Communications, 5(May):1–7, 2014.
[14] Robert C. Edgar. MUSCLE: Multiple sequence alignment with high accuracy and high throughput. Nucleic Acids Research, 32(5):1792–1797, 2004.
[15] Anna Gaines, Miranda Ludovice, Jie Xu, Marc Zanghi, Richard J. Meinersmann, Mark Berrang, Wayne Daley, and Doug Britton. The dialogue between protozoa and bacteria in a microfluidic device. PLoS ONE, 14(10), 2019.
[16] Zhifei Ge, Peter R. Girguis, and Cullen R. Buie. Nanoporous microscale microbial incubators. Lab on a Chip, 16(3):480–488, 2016.
[17] Florian L. Geyer, Erica Ueda, Urban Liebel, Nicole Grau, and Pavel A. Levkin. Superhydrophobic-superhydrophilic micropatterning: Towards genome-on-a-chip cell microarrays. Angewandte Chemie - International Edition, 50(36):8424– 8427, aug 2011.
[18] Jonghyun Ha and Ho-Young Kim. Capillarity in Soft Porous Solids. Annual Review of Fluid Mechanics, 52(1):263–284, 2020.
[19] Je↵rey A. Kimbrel, Ty J. Samo, Christopher Ward, Daniel Nilson, Michael P. Thelen, Anthony Siccardi, Paul Zimba, Todd W. Lane, and Xavier Mayali. Host selection and stochastic e↵ects influence bacterial community assembly on the microalgal phycosphere. Algal Research, 40:101489, jun 2019.
[20] Ines Krohn-Molt, Malik Alawi, Konrad U. F¨orstner, Alena Wiegandt, Lia Burkhardt, Daniela Indenbirken, Melanie Thieß, Adam Grundho↵, Julia Kehr, Andreas Tholey, and Wolfgang R. Streit. Insights into Microalga and Bacteria Interactions of Selected Phycosphere Biofilms Using Metagenomic, Transcrip-tomic, and Proteomic Approaches. Frontiers in Microbiology, 8(OCT):1–14, oct 2017.
[21] Pavel A. Levkin, Frantisek Svec, and Jean M.J. Fr´echet. Porous polymer coat-ings: A versatile approach to superhydrophobic surfaces. Advanced Functional Materials, 19(12):1993–1998, 2009.
[22] Xavier Mayali and Farooq Azam. Algicidal bacteria in the sea and their impact on algal blooms. Journal of Eukaryotic Microbiology, 51(2):139–144, mar 2004. [23] Paul J. McMurdie and Susan Holmes. Phyloseq: An R Package for Reproducible
Interactive Analysis and Graphics of Microbiome Census Data. PLoS ONE, 8(4), 2013.
[24] Anastasia Metlitskaya, Teymur Kazakov, Gaston H. Vondenho↵, Maria Novikova, Alexander Shashkov, Timofei Zatsepin, Ekaterina Semenova, Na-talia Zaitseva, Vasily Ramensky, Arthur Van Aerschot, and Konstantin Severi-nov. Maturation of the translation inhibitor microcin. Journal of Bacteriology, 191(7):2380–2387, 2009.
[25] Nils Meyer, Arite Bigalke, Anett Kaulfuß, and Georg Pohnert. Strategies and ecological roles of algicidal bacteria. FEMS Microbiology Reviews, 41(6):880–899, nov 2017.
[26] Thomas J. Moutinho, John C. Panagides, Matthew B. Biggs, Gregory L. Med-lock, Glynis L. Kolling, and Jason A. Papin. Novel co-culture plate enables growth dynamic-based assessment of contact-independent microbial interactions. PLoS ONE, 12(8):1–12, 2017.
[27] D. Nichols, N. Cahoon, E. M. Trakhtenberg, L. Pham, A. Mehta, A. Belanger, T. Kanigan, K. Lewis, and S. S. Epstein. Use of ichip for high-throughput in situ cultivation of ”uncultivable microbial species. Applied and Environmental Microbiology, 76(8):2445–2450, 2010.