HAL Id: hal-00317255
https://hal.archives-ouvertes.fr/hal-00317255
Submitted on 19 Mar 2004
HAL is a multi-disciplinary open access
archive for the deposit and dissemination of
sci-entific research documents, whether they are
pub-lished or not. The documents may come from
teaching and research institutions in France or
abroad, or from public or private research centers.
L’archive ouverte pluridisciplinaire HAL, est
destinée au dépôt et à la diffusion de documents
scientifiques de niveau recherche, publiés ou non,
émanant des établissements d’enseignement et de
recherche français ou étrangers, des laboratoires
publics ou privés.
Long-term changes in hydrographic conditions in
northern Adriatic and its relationship to hydrological
and atmospheric processes
N. Supi?, B. Grbec, I. Vilibi?, I. Ivan?i?
To cite this version:
N. Supi?, B. Grbec, I. Vilibi?, I. Ivan?i?. Long-term changes in hydrographic conditions in
north-ern Adriatic and its relationship to hydrological and atmospheric processes. Annales Geophysicae,
European Geosciences Union, 2004, 22 (3), pp.733-745. �hal-00317255�
SRef-ID: 1432-0576/ag/2004-22-733 © European Geosciences Union 2004
Annales
Geophysicae
Long-term changes in hydrographic conditions in northern Adriatic
and its relationship to hydrological and atmospheric processes
N. Supi´c1, B. Grbec2, I. Vilibi´c3, and I. Ivanˇci´c1
1Center for Marine Research, Institute Rudjer Boˇskovi´c, Rovinj, Croatia 2Institute of Oceanography and Fisheries, Split, Croatia
3Hydrographic Institute of the Republic of Croatia, Split, Croatia
Received: 31 October 2002 – Revised: 4 September 2003 – Accepted: 28 October 2003 – Published: 19 March 2004
Abstract. A very long data series (1921–2000) of
hydro-graphic parameters (temperature, salinity and density) col-lected in surface and bottom layers at a station in the coastal zone in the northeastern Adriatic was analyzed. Seasonal and interannual variability of the three parameters is described on the basis of monthly and yearly averages. The seasonal cy-cles obtained were found to be typical for the northern Adri-atic. Interannual analysis showed that there was no trend in temperature, salinity and density in the region during the in-terval analyzed. The long-term series of yearly means of hydrographic parameters were related to the long-term se-ries of yearly means of several hydrological/atmospheric pa-rameters using different time lags of between 0 and 4 years. These parameters are surface heat flux gained by insolation Qs computed for Trieste, precipitation P in Trieste, Po River discharge rate R and two atmospheric oscillation indexes, a Mediterranean Oscillation (MO) index and North Atlantic Oscillation (NAO) index. At zero time lag the interannual changes at the surface were found to be significantly related to changes in the Qs and NAO index (temperature) and R (salinity and density). At the same time lag the changes in the bottom were found to be related to the MO index (tem-perature, salinity and density). Additionally, bottom salinity and density were significantly related to R at a time lag of 1 year.
Key words. Oceanography: Physical (air-sea interactions;
hydrography)
1 Introduction
It is generally known that the hydrographic characteristics (e.g. temperature, salinity and density) of the northern Adri-atic are under the influence of air-sea fluxes (e.g. under the influence of air-sea heat flux Q and air-sea water flux W) and the Po River discharge rates (e.g. Franco and Michelato,
Correspondence to: N. Supi´c
1992; Orli´c et al., 1992). Additionally, they are influ-enced by periodical inflow of more saline water of Mediter-ranean origin (e.g. Franco and Michelato, 1992). In the mid-dle Adriatic, inflow of very saline water from the Mediter-ranean is considered to be connected to the sea-level pres-sure difference between the mid North Atlantic and south-east Mediterranean, named the Mediterranean Oscillation in-dex (MO inin-dex; Grbec et al., 2003). A positive MO inin-dex (higher pressure over the Atlantic and lower pressure over the Mediterranean) induces inflow of Levantine Intermediate Water (LIW) into the Adriatic and a rise of salinity in the region (Grbec et al., 2002; Appendix).
The North Atlantic Oscillation (NAO) is a large-scale mode of natural climate variability having large impacts on weather and climate in the North Atlantic region and over Europe. It is often defined through an oscillation index as the sea-level pressure difference between the polar low and the subtropical high. It exerts a dominant influence on winter-time temperatures across much of the Northern Hemisphere. Consequently, surface air temperatures and sea surface tem-peratures across wide regions – including the Mediterranean as well – are significantly correlated with interannual NAO fluctuations (Hurrel and Vanloon, 1997). In the northern Adriatic region, significant correlation was found between net heat flux and NAO index (Dulˇci´c et al., 2004). The anal-ysis of data from the period 1966–1992 showed that seasonal and interannual variations of hydrographic conditions in the northern Adriatic are related to the corresponding changes in surface fluxes (air-sea heat flux, air-sea water flux, air-sea buoyancy flux) and in the Po River discharge rate (Supi´c et al., 1997; Supi´c and Ivanˇci´c, 2002). The impact of long-term changes in the MO and NAO indexes on hydrographic con-ditions of the region has not been analysed to date.
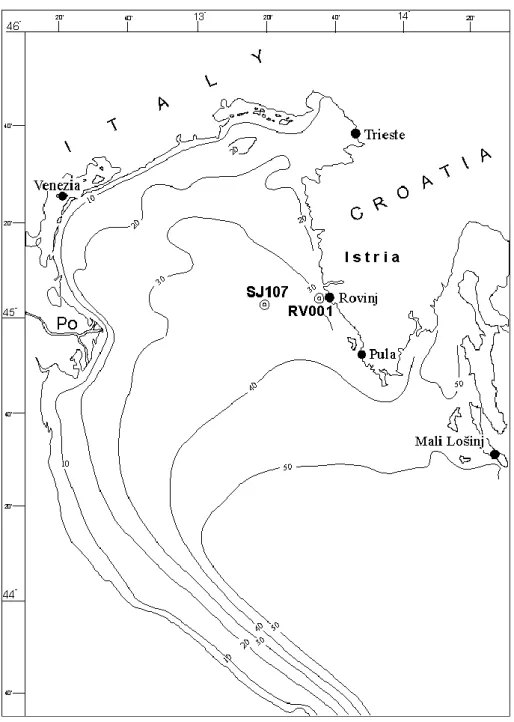
In this paper we discuss seasonal and interannual variabil-ity of hydrographic conditions in the northern Adriatic us-ing a long time series of temperature, salinity and density data. The data were collected at station RV001 in the coastal zone of the northeastern Adriatic (Fig. 1) between 1921 and 2000. Seasonal and interannual analyses were performed on
734 N. Supi´c et al.: Long-term changes in hydrographic conditions in northern Adriatic
Fig. 1. The northern Adriatic with the oceanographic stations and bathymetric lines.
the basis of monthly and yearly averages of hydrographic pa-rameters. We compare a long-term series of yearly means of hydrographic data to a long-term series of yearly means of several atmospheric and hydrological parameters, by means of single and double correlation analysis. These parameters are incoming heat and water fluxes in the northern Adriatic Qs and P, Po River discharge rate R, as well as MO and NAO indexes.
After presenting data and methods used (Sect. 2) we de-scribe and discuss our findings (Sect. 3). Finally, the results are summarized in Sect. 4.
2 Data and methods
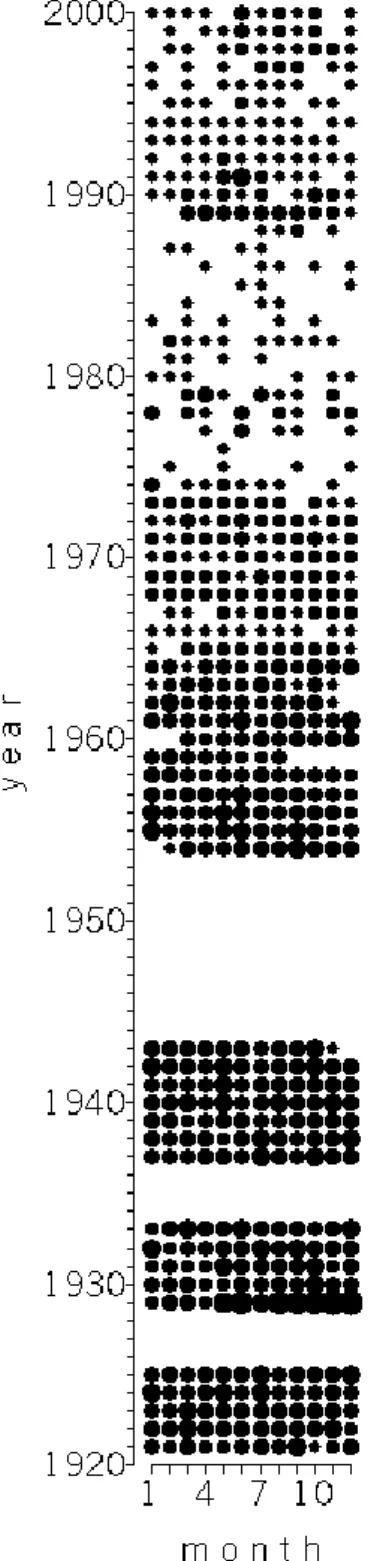
The analysis is based on a long time series of sea tempera-ture and salinity data collected monthly to seasonally in the 1921–2000 interval (Fig. 2) at station RV001 (45◦04.8’ N and 13◦36.6’ E; this value is subject to small variations within the long interval of measurements). Note that within the pe-riod of measurements three data gaps occur: between 1926 and 1928, between 1934 and 1936, and between 1944 and 1953. The data are stored in the oceanographic data bank of the Center for Marine Research and are available upon request. The sampling was performed at about 0 m (at the surface) and at 28–32 m depth (at the bottom). For the entire
1921–2000 interval the temperature was measured by pro-tected reversing thermometers (Richter and Wiese, Berlin, precision ±0.01◦C). Salinity was determined to at least
±0.05 by using Mohr and Knudsen’s method (1921–1977) or high precision laboratory salinometers (±0.01; after 1977). The sigma-t values have been computed from temperature and salinity by using standard international formulae (UN-ESCO, 1981).
Seasonal cycles of sea temperature, salinity and density at RV001 are described on the basis of monthly means com-puted from all the data collected in the 1921–2000 inter-val. Yearly means of sea temperature, salinity or density at RV001 were computed using monthly averages within a cer-tain year, but only for years when sampling was performed during at least 10 separate months. (This is a reason why there are so many gaps in the time series of bottom tempera-ture, salinity and density.)
Total heat flux from the atmosphere to the sea (Q) is the difference in the fluxes gained by insolation (Qs) and lost by longwave radiation (Ql), latent (Qe) and sensible heat fluxes (Qc). Total air-sea water flux (W) is the difference between precipitation (P) and evaporation (E). Computation of sur-face flux components is based on standard meteorological parameters (air temperature, scalar wind speed, cloud cover, specific humidity, precipitation, air pressure at the sea level) and sea surface temperature data (e.g. Gill, 1982). Due to a lack of meteorological data in the vicinity of station RV001 (e.g. in Rovinj), we were not able to compute a long se-ries of Q and W values which we could relate to long-term changes in the hydrographic parameters. However, we had at our disposal a long time series of data collected in Tri-este (Fig. 1). To determine whether the TriTri-este fluxes are a good approximation of the Rovinj fluxes, we analyzed 1966– 1992 surface flux data (from Supi´c and Orli´c, 1999). It was found that long-term changes in Q and W at Trieste differed significantly from long-term changes in the same parame-ters at Rovinj. The correlation coefficients between 27 an-nual means of Q/W at Rovinj and Trieste were close to 0. (Long-term variability of annual means of Q and W in the 1966–1992 interval was mainly dependant on the variabil-ity in Qe and E. Interannual changes of the two components were closely related to changes in wind speed, and long-term changes in wind speed at Rovinj and Trieste were not re-lated.) Therefore, we related long-term changes in the annual means of hydrographic parameters at RV001 to changes in the annual means of Qs and P computed on the basis of Tri-este data. Correlation coefficients between 27 annual means of Qs and P at stations Trieste and Rovinj in the 1966–1992 interval, amounting to 0.52 and 0.51, were significant at the 99.5% and 99.3% levels, respectively. Qs was computed for the 1925–1927, 1929–1930 and 1941–1992 intervals on the basis of monthly values of cloud cover in Trieste following the method described in Supi´c and Orli´c (1999). The cloud cover data used were provided by Univesit´a di Trieste.
Values for the NAO index were taken from http://www. cgd.ucar.edu/∼jhurrell, while Po River discharge data were obtained from Assessorato Programazione, Piafinicazione e
Fig. 2. Sampling strategy at RV001 in the 1921–2000 interval.
Cir-cle diameter is proportional to the number of casts (with measure-ments of both temperature and salinity) per month (0-8).
Ambinete of Emilia Romagna region (Italy). For the purpose of our investigation the definition of the MO index follows the simplified procedure found in Grbec et al. (2003) and is given in the Appendix.
The statistical significance of all the correlation coeffi-cients presented here was computed by means of a two-sided t-test (e.g. Storch and Zwiers, 1999).
736 N. Supi´c et al.: Long-term changes in hydrographic conditions in northern Adriatic
(a)
(b)
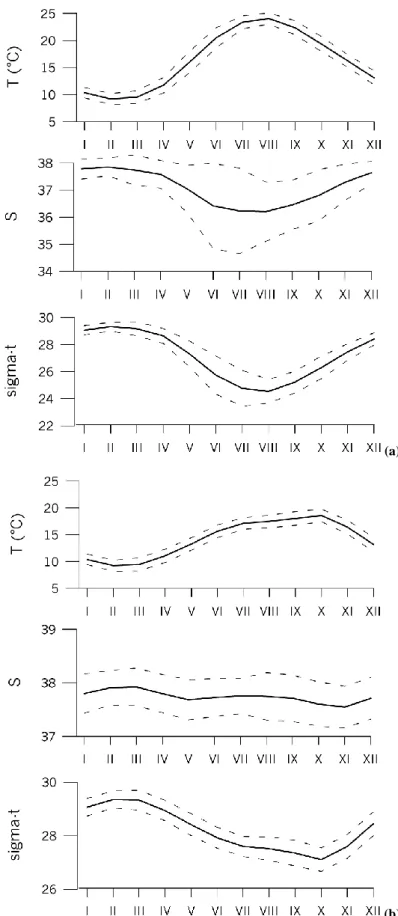
Fig. 3. Average values (solid line) and standard deviations (dashed lines) of temperature, salinity and density (sigma-t) for the 1921–2000 in (a) surface and (b) bottom layer at station RV001.
3 Results
3.1 Seasonal cycle
In the 1921–2000 interval the temperature at RV001 ranged between 9.2◦C (February) and 24.1◦C (August) at the sur-face, and between 9.2◦C (February) and 18.6◦C (October) at the bottom (Fig. 3). The corresponding changes in salinity were between 36.2 (August) and 37.9 (February) at the sur-face, and between 37.5 (November) and 37.9 (March) at the bottom (Fig. 3). sigma-t values ranged between 24.5 (Au-gust) and 29.3 (February) at the surface, and between 27.1 (October) and 29.3 (March) at the bottom (Fig. 3).
Seasonal cycles of temperature, salinity and density at RV001 in the coastal zone are very similar to those observed at SJ107 (Fig. 1; Supi´c and Ivanˇci´c, 2002) in the open north-eastern Adriatic. Small differences in the seasonal cycles be-tween the two locations are presumably due to differences in coastal and open sea dynamics. Lower values of winter temperatures at RV001 with respect to SJ107 are presumably caused by more intense cooling in the coastal zone. Higher temperatures and lower salinity in the surface layer at SJ107 with respect to RV001 in summer could be explained by the presence of a warm, low salinity water pool in the open northeastern Adriatic around SJ107 in that season (Supi´c et al., 2003). In autumn the bottom waters are generally warmer and less salty at RV001 than at SJ107, presumably due to more intense vertical mixing in the coastal zone during the period when the pycnocline decays.
Seasonal changes in the hydrographic conditions at RV001 are, therefore, typical for the northern Adriatic region, there-fore, being dependant on the combined effects of air-sea sur-face fluxes and Po River discharge rates. The changes in the temperature could be easily related to seasonal changes in the surface heat flux in the region (Supi´c and Orli´c, 1999). The region gains heat in the period from March/April to August. The heat is accumulating in the surface layer (0–10 m depth) which gradually becomes warmer than deeper parts of the water column, with maximal temperatures occurring in Au-gust. By the end of summer (September), when the sea at the air-sea interface starts to lose heat, the vertical stratification is eroded by strong vertical mixing. Due to convective pro-cesses, the bottom layer is heated and by the end of the sum-mer the bottom temperature is at its maximum. During au-tumn and winter, the water column of the northern Adriatic is well mixed. The cooling process continues until March, with the temperature of the water column being minimal by the end of winter. Seasonal changes in salinity and density are very similar and more influenced by the Po River discharge than by air-sea water or buoyancy fluxes. Air-sea water flux is generally positive throughout the year (sea gains water) and more intense from February to June than in the second part of the year (Supi´c and Orli´c, 1999). Seasonal changes in air-sea buoyancy flux are ruled by changes in air-sea heat flux, with buoyancy loss in the period from March to August (Supi´c and Orli´c, 1999). The seasonal cycle of the Po River discharge has two maxima, during spring (May) and autumn
period (November; Supi´c and Orli´c, 1999). During winter the water column is well mixed and values of salinity and density both in the surface and bottom layer are the same. In that period of the year the Po River influence is confined to the western coast. The values of salinity and density depend primarily on the air-sea exchanges and are, therefore, high. In spring and summer Po waters spread over the surface layer of the northern Adriatic, and surface salinity and density be-come lower. As the water column is well stratified during the warm period of the year, salinity and density of the bottom layer remain high. By the end of the summer the low saline Po waters are drawn from the region, and surface salinity and density significantly increase. By convective processes in-duced by cooling the salinity and density of the bottom layer are affected, reaching its minimum in autumn.
3.2 Long-term variability
In the 1921–1994 interval yearly means of temperature at RV001 (Fig. 4) ranged between 15.6◦C (in 1941) and 17.1◦C (in 1961) at the surface, and between 13.0◦C (in 1938) and 15.1◦C (in 1921) at the bottom. Yearly means of salinity were, for the same interval (Fig. 4), between 35.0 (in 1941) and 37.9 (in 1929) at surface, and between 37.1 (in 1937) and 38.0 (in 1954) at bottom. Yearly averages of sigma-t values (Fig. 4) ranged between 25.8 (in 1941) and 27.8 (in 1929) at the surface, and between 27.7 (in 1937) and 28.7 (in 1929) at the bottom. Average values of the three parameters observed were 16.3◦C, 37.1 and 27.2 at the surface and 14.2◦C, 37.8 and 28.2 at the bottom.
The changes in the hydrographic characteristics in the bot-tom and surface layers were generally related (correlation coefficients between 40 yearly means of surface and bot-tom temperature, salinity and sigma-t values amounted to 0.67, 0.70 and 0.52, respectively, and were significant at the 99.99% level). Density changes in the surface layer were predominantly ruled by salinity changes, while the ones in the bottom layer were dependant on both temperature and salinity variations (correlation coefficients between 40 yearly means of temperature and sigma-t-values amounted to 0.01 at the surface and to 0.55 at the bottom, while the ones between 40 yearly means of salinity and sigma-t values were 0.96 in the surface and 0.86 in the bottom layer). The changes in the temperature were found to be independent of changes in salinity (correlation coefficients between 40 yearly means of temperature and salinity for both surface and bottom layers were about zero).
Perhaps the most interesting result of this long-term anal-ysis is the fact that over the period analyzed there is no trend in changes in the yearly means of temperature, salinity and density in both the surface and bottom layers. This result is somewhat unexpected. While analysing long-term changes in the annual means of surface temperature measured daily in Trieste in the 1946–1999 interval, Stravisi (2000) observed a positive linear trend. A positive linear trend was also found in the 1970–2000 interval in monthly to seasonally gathered surface temperature data at the Po delta-Rovinj transect in
738 N. Supi´c et al.: Long-term changes in hydrographic conditions in northern Adriatic
Fig. 4. Yearly means of temperature, salinity and density (sigma-t) for the 1921–2000 interval for the surface (heavy solid line) and the
bottom (solid line) layer at station RV001.
Fig. 5. Yearly means Qs, P, R, the MO and NAO indexes for the 1921–2000 interval.
the northern Adriatic in the spring and summer period (but not in the autumn and winter period; Degobbis et al., 2000; CIM, unpublished data). Although the data series analyzed here includes several data gaps (for example, there is a data gap in the 1995–2000 interval when a positive trend in the
spring surface temperature in the northern Adriatic is very pronounced; CIM, unpublished data), it refers to a time inter-val longer than the data series discussed previously. There-fore, our results indicate that on longer time scales there are no trends in sea temperature – and also including salinity
and density – in the northern Adriatic. However, this find-ing should be reexaminated in future, by usfind-ing a more com-plete and longer time series than the one discussed here. A constant salinity increase in the coastal and open waters of middle Adriatic was observed in the 1951–1976 interval by Zore-Armanda et al. (1991). At RV001, over a similar time period of 1954–1973, there was no linear trend in the bottom salinity, while the surface salinity was found to even decrease a little (Fig. 4). These differences point out that long-term salinity vatiations in the middle and northern Adriatic differ significantly. In addition, analysis of long-term salinity vari-ations at the Po delta-Rovinj transect in the 1970–2000 inter-val (the salinity data were taken monthly to seasonaly) shows no pronounced trend (Degobbis et al., 2000; CIM, unpub-lished data). Variability of yearly means of surface flux due to insolation (Qs), precipitation (P), Po River discharge rates (R), and MO and NAO indexes in the 1921–1994 interval is shown in Fig. 5. Qs varied between 131 W m−2(in 1960) and
162 m2(in 1983), P between 1.7 mm d−1(in 1938 and 1942) and 3.7 mm d−1(in 1960 and 1965), R between 902 m3s−1 (in 1945) and 2617 m3s−1(in 1960), MO index between 4.0 (in 1924) mbar and 4.7 mbar (in 1973) and NAO index be-tween 1.1 mbar (in 1996) and 1.1 mbar (in 1961 and 1990). The long-term averages of Qs, P, R and MO and NAO in-dexes amounted to 143.7 W m2, 2.7 mm d−1, 1508 mm d−1, 0.3 mbar and 0.1 mbar, respectively.
Changes in Qs were closely related to changes in P (cor-relation coefficient between 56 values of Qs and P in the 1925–1991 interval amounted to 0.37, suggesting that this was significant at the 99.5% level) and were generally not related to changes in R, MO or NAO indexes (correlation co-efficient between 57 values of Qs and R, MO index and NAO index gave values of 0.2, 0.17 and 0.14 and were significant at 86.4%, 79.4% and 70.1% levels, respectively). Changes in P were highly related to changes in R (correlation coefficient between 75 values of P and R index in the 1873–1991 inter-val was 0.27 and was significant at the 99.9% level). Changes in P were weakly related to changes in MO and NAO indexes (correlation coefficients between 119 values of P and MO index and NAO index in the 1873–1991 interval were 0.19 and 0.20 and were significant at the 96.2% and 97.1% lev-els, respectively). Changes in R were generally not related to changes in MO or NAO index (the correlation coefficients between 80 values of R and the MO/NAO index in the 1917– 1995 interval amounted to 0.17/0.10 and were significant at the 87.9% and 62.2% levels). Changes in the MO index were not related to changes in the NAO index (correlation coeffi-cient between 123 values of MO and NAO indexes in the 1873–1995 interval was 0.1 and was significant at the 76.9% level).
There is no linear trend in the P, R and NAO changes, while Qs and MO index data show a slight increase within the period of observation.
3.3 Correlation analyses
Twenty annual means of surface and bottom temperature, salinity and density at RV001 between 1921 and 2000 were compared to the annual means of Qs for various time lags between 0 and −4 years (Fig. 6). The same comparison was done between thirty-seven annual means of the hydrographic parameters in the 1921–2000 interval and P, R, and the NAO index and the MO index (Fig. 7).
Correlation between sea surface temperature and Qs was positive and significant (at the 97.8% level) at 0 years time lag. Changes in Qs were reflected in the sea bottom tem-perature at 0 years time lag but with a statistical significance below 95% (at the 94.8% level). The finding implies that in-terannual changes in sea temperature in the region are for the most part driven by changes in incoming insolation. Changes in surface salinity, and surface and bottom density were not found to be related to Qs. It is interesting to note that there exists a higher positive correlation between bottom salinity at a −1 year time lag and Qs. In conditions of reinforced heat gain, heat content of the surface layer may be increased, resulting in a higher stratification degree of a water column. Reduction of vertical mixing under those conditions may per-haps induce higher bottom salinity values for the next year.
Changes in hydrographic conditions at RV001 were not found to be related to changes in P, except at −3 years time lag, for surface and bottom salinity, and surface density. We are at present unable to explain this correlation.
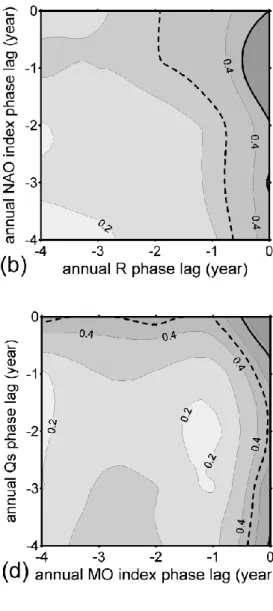
Temperatures in both surface and bottom layers were not related to R at any phase lag. Surface salinity and density were significantly correlated to this parameter at zero phase lag (at 98.4% and at 99.3% levels). In the bottom layer a sig-nificant correlation is achieved at the −1 year time lag, both for salinity (at 99.4% level) and density (at 96.5% level). The correlations are negative (higher Po River discharge rates, lower salinity and density). The obtained results indicate that interannual variations in salinity and density are for the most part driven by variations in Po River discharge rates, both in the surface and bottom layer. It is interesting to note that there is a one year lagged response time between changes in R and changes in salinity and density of the bottom layer. This corresponds to the previous result obtained by Vilibi´c and Supi´c (personal communication), who found that values of bottom salinity recorded in February in the 1966–1992 in-terval at SJ107 are highly negatively correlated to Po River discharge rate recorded with a −10 months phase lag (i.e. to the Po discharge rate recorded in April of the previous year). They suggested that a significant amount of fresh water of Po origin (Po waters are confined to the western coast during winter, spreading over the surface layer of the northern Adri-atic during spring and summer) enters the bottom layers of the northern Adriatic in early spring, during a period of ver-tical instability, thereby preconditioning in this way winter conditions of the next year.
With the exception of surface temperature, which was significantly (at the 98.6% level) positively related to the NAO index at zero time lag, the hydrographic parameters
740 N. Supi´c et al.: Long-term changes in hydrographic conditions in northern Adriatic
Fig. 6. Absolute values of correlation coefficients between 20 yearly means of temperature, salinity and density in the surface (a) and the
bottom (b) layer at station RV001 and yearly means of Qs in the 1917–2000 interval for phase lags of 0, −1, −2, −3 and −4 years.
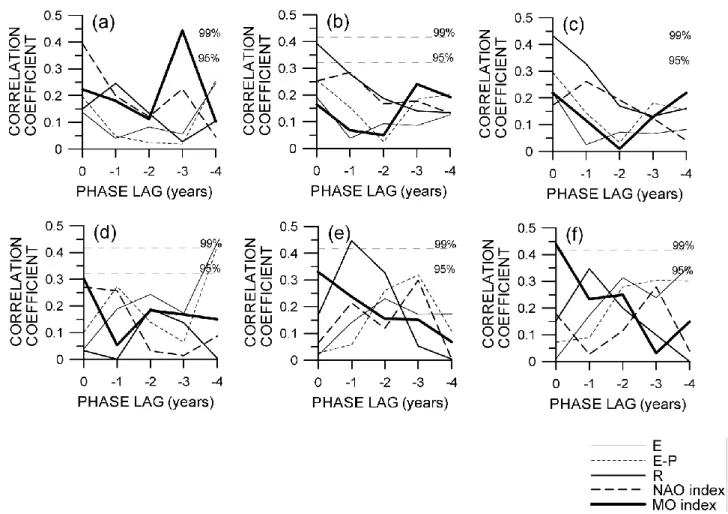
Fig. 7. Absolute values of correlation coefficients between 37 yearly means of hydrographic parameters – (a) surface temperature, (b) surface
salinity, (c) surface density, (d) bottom temperature, (e) bottom salinity and (f) bottom density – at station RV001 and yearly means of P, R, the NAO and MO indexes in the 1917–2000 interval for phase lags of 0, −1, −2, −3 and −4 years.
Fig. 8. Double correlation coefficients for the cases when maximum correlation appeared for annual surface (a) temperature, (b) salinity and (c) density, and annual bottom (d) temperature, (e) salinity and (f) density measured at RV001 station. Input parameters are varied between
Qs, P, R, the MO and NAO indexes (dashed and thick line stands for 95% and 99% significance level, respectively) for phase lags from 0 to −4 years.
742 N. Supi´c et al.: Long-term changes in hydrographic conditions in northern Adriatic investigated were not related to this parameter. The single
correlation obtained compares well with the finding that sea surface temperatures in the Mediterranean region are signif-icantly related to the NAO index (Hurrel, 1995). A nega-tive NAO index describes the conditions favourable for cy-clonic activity over the Adriatic and Western Mediterranean (and vice versa) clearly reflecting air-sea heat exchanges and, therefore, sea temperature changes.
Long-term changes in the hydrographic parameters in the surface layer were not related to the MO index, except for the temperature which was negatively related to the same at the −3 years time lag (at 99.5% level). We are also unable to explain this correlation. However, all three hydrographic pa-rameters for the bottom layer were related to the MOI index at 0 years time lag. The correlation for density and salinity were positive and high (at 99.5% and at 95.3% level), while the one for temperature was negative and less than the 95% level (at 92.9% level). Therefore, our results indicate that a high and positive MOI favours the appearance of less warm and more saline (and, therefore, more dense) water in the bottom layer of the northern Adriatic at zero phase lag.
It was determined that the MO index is related to condi-tions that induce saline LIW inflow into the Adriatic at zero phase lag (Grbec, 1997; Appendix). This transport occurs in the intermediate layers at 30–150 m depth (Grbec et al., 1998; 2002). The exact mechanism of the MO influence on salinity changes in intermediate layers of the middle Adriatic has not yet been explained. However, it is supposed that un-der conditions of high and positive MO alongshore motions in layers of 30–100 m depth are favoured. Therefore, un-der these conditions a significant amount of LIW enters the Adriatic. By analogy we can suppose that under conditions of high and positive MO index advection of intermediate wa-ters from the central to northern Adriatic is favoured. In-termediate central Adriatic waters are generally warmer and more saline than northern Adriatic waters at the correspond-ing depth. Average yearly values of hydrographic parame-ters at 30 m are 15.2◦C and 38.2 at the Split-Gargano tran-sect in the central Adriatic (Zore-Armanda et al., 1991), and 12.8◦C and 38.0 at the delta Po-Rovinj transect in the north-ern Adriatic (Supi´c, 1993). The advection of central Adriatic waters gives rise to salinity values at RV001 that are charac-terised by a high, positive correlation between bottom salin-ity and the MO index. However, under conditions of high and positive MO index yearly averaged bottom temperatures at RV001 are generally low. This is an important point to dis-cuss. We suppose that inflow of large quantities of warmer water into the bottom layer could influence the stability of the water column of the northern Adriatic, inducing more intense vertical mixing. That process may – on an average scale – lead to a bottom temperature decrease and, therefore, be responsible for the negative correlation between the bot-tom temperature and the MO index.
It is interesting to note that the statistical significance of the correlation coefficient between long-term changes in the annual values of the MO index and salinity in the intermedi-ate layer of the middle Adriatic (see Appendix) is the same as
the one obtained here for the correlation coefficient between the MO index and the salinity in the bottom layer (95%). However, there is no significant correlation between long-term changes in the annual values of the MO index and the temperature in the middle Adriatic (Grbec, personal comuni-cation).
We were unable to explain the high correlations between the hydrographic conditions at RV001 and the atmospheric parameters (MO index and precipitation) at the −3 years time lag. These correlations have perhaps no physical mean-ing. However, it is possible that they may reflect some im-portant climate characteristics of the Mediteranean region which are beyond our present knowledge. For example, Lev-antine Intermediate Water (LIW), which is produced by the enhanced buoyancy losses over the Levantine Basin, requires a couple of years to reach the Adriatic area (Malanotte-Rizoli et al., 1997). It is possible that this water, reaching the north-ern Adriatic three years after being formed, significantly in-fluences the hydrographic conditions of the region. The high correlation obtained at the −3 years time lag may then reveal a connection between LIW generation and the atmospheric parameters involved.
We have additionally performed multiregression analysis with two inputs and one output. The best correlation fields for annual surface and bottom temperature, salinity and den-sity are given in Fig. 8. The fields follow the distributions achieved by single correlation analysis. The highest correla-tion seems to appear at the 0 years time lag for the temper-ature fields with the Qs and MO index as inputs both at the surface and bottom, and at −3 years with MO index. The salinity field is mostly driven by the river runoff, at the zero phase lag of the surface and −1 year time lag at the bot-tom. Annual surface density values are primarily the result of salinity fluctuations and, therefore, the correlations are simi-lar to those achieved for the salinity in the surface layer, but in the bottom layer they are primarily driven by the MO index and then by the river runoff.
4 Summary
The paper gives seasonal and interannual variability of hy-drographic conditions at a station in a coastal zone of the northeastern Adriatic, using a long data series starting in 1921. The series is among the longest in the Adriatic, hav-ing a very high samplhav-ing resolution, and considered enough to perform very precise analyses on both seasonal and inter-annual scales. Seasonal changes in the temperature, salinity and density were found to be typical for the region, depen-dant on air-sea fluxes (air-sea heat flux, air-sea water flux and air-sea buoyancy flux) and Po River discharge rate. Analysis of annual means indicated that there were no trends in tem-perature, salinity and density changes in the region. Interan-nual density changes were ruled by salinity changes in the surface layer and by both temperature and salinity changes in the bottom layer. The interannual changes of temperature and salinity were not related.
In order to explain the long-term changes in hydrographic conditions we analysed a series of yearly means of several different hydrologic and meteorological parameters: surface heat flux gained by insolation Qs computed for Trieste, pre-cipitation P in Trieste, Po River discharge rate R and pres-sure gradients MO index and NAO index. The comparison of the long-term means revealed that interannual changes in Qs and P were highly related, as well as the changes in P and R. While changes in Qs and R were generally not related to changes in the NAO and MO indexes, changes in P were weakly related to changes in the two indexes. Changes in the MO index were generally not related to changes in the NAO index.
The long-term series of the yearly means of hydrographic parameters were then compared to changes in the yearly means of Qs, P, R, the MO index and the NAO index, using different time lags between 0 and −4 years. At 0 time lag the interannual changes at the surface were found to be signifi-cantly related to changes in Qs and NAO (temperature) and R (salinity and density). At the same time lag the changes in the bottom layer were found to be related to the MO in-dex (temperature, salinity and density). Additionally, bottom salinity and density were significantly related to R at the −1 year time lag.
The results obtained confirm the previous findings – based on much shorter time series – that long-term changes in the temperature in the northern Adriatic depend mainly on sur-face heat flux, while changes in salinity and density are pri-marily driven by the influence of the Po. Additionally, our results show that interannual variations of hydrographic con-ditions in the northern Adriatic could, in addition to varia-tions in surface fluxes and in Po River discharge rates, be re-lated to variations in pressure gradients due to NAO and MO. By showing that changes in the NAO index are important for thermal changes at the surface, and changes in the MO index are important for salinity and density changes at the bottom, the obtained result supports the earlier stated hypothesis that in the Adriatic region the NAO index is responsible for air-sea exchange processes and the MO index is responsible for the horizontal advection of water in deeper layers.
Appendix A Mediterranean oscillation (MO) index
The possible existence of a Mediterranean Oscillation at the 500 hPa level, as a consequence of dipole behaviour of the atmosphere in the area between the western and east-ern Mediterranean, was proposed by Conte et al. (1989). This dipole behaviour seems to play a dominant role in cli-mate variability over the Mediterranean basin. It was docu-mented by comparing temperature, precipitation, circulation and other parameters between the western and the eastern Mediterranean. The differences observed were attributed to a Mediterranean Oscillation, which is defined as a pressure gradient between the two regions (Kutiel et al., 1996; Ma-heras et al., 1999). An index that measures the intensity of the dipole-like behavior was defined in a way similar to
the North Atlantic Oscillation (NAO) index (Kutiel and Be-naroch, 2002).
Previous analyses indicated that pressure differences be-tween the mid North Atlantic and the southeast Mediter-ranean reinforce the inflow of saltier Levantine Intermediate Water (LIW) into the Adriatic (Zore-Armanda, 1969; 1972; Grbec et al., 1998; Grbec et al., 2002).
To establish the connection between pressure distribution and LIW inflow two data sets were used: 1) mean annual (1920–1995) sea level pressure data for 64 grid points on a 10◦ longitude by 5◦ latitude grid, in the area delimited by the 30 W–40 E meridians, and 30 N–65 N parallels (ob-tained from the web site http://www.cru.uea.ac.uk and ad-justed to the mean sea level; detailed description of the data can be found in, for example, Williams and Vanloon, 1976; Trenberth and Paolino, 1980; Jones, 1987), and 2) mean an-nual (1947–1995) salinity values in the intermediate 50–70 m layer which are not influenced by seasonal changes in the middle Adriatic Sea (MEDAS - Marine Environmental Data Bank of the Adriatic Sea data bank; Dadic, 1995). Sim-ple linear correlation coefficients were calculated between pressure at each of the 64 grid-point data and salinity data (e.g. between annual values of the parameters in the 1947– 1995 interval). Among all the correlation coefficients at the 95% significance level, two well-defined groups appeared: one with positive and one with negative correlations between salinity and sea level pressure (SLP) data (Fig. A1). Since the main objective of our work was to determine the stress in the atmosphere, which causes more or less LIW inflow into the Adriatic, only those SLP data that showed significant cor-relation (at the 95% level) with salinity were used in further analysis.
In analogy to the indices in the atmosphere, like NAO, and the already established MO (Mediterranean Oscillation) for the 500 mb geopotential level between the western and east-ern Mediterranean sides (Conte et al., 1989), we have defined the Mediterranean Oscillation index (MOI) as:
MOI = SP L+−SP L−
where SP L+ is the mean sea level pressure for the grid-points showing a positive significant correlation with salin-ity (in the mid North Atlantic), whereas SP L− is the mean sea level pressure for the gridpoints showing negative signif-icant correlation with salinity (in southeast Mediterranean). The area in the mid North Atlantic is regulated by perma-nent pressure centers, the Azores high and the Island low, while the area in the southeast Mediterranean is under the in-fluence of the permanent southeast Mediterranean low. Sig-nificant correlation between MOI and salinity in the middle Adriatic of 0.52 (p<0.05) was obtained (Fig. A2). Very high salinity values in some years (up to 38.8) are a prescribed inflow of very saline Levantine Intermediate Waters (LIW). (In the Levantine basin where the LIW is formed it is de-fined as warm and high salinity water with a temperature be-tween 15◦and 16◦C and a salinity between 39.0 and 39.2; Malanotte-Rizzoli et al., 1997. In the southern Adriatic LIW
744 N. Supi´c et al.: Long-term changes in hydrographic conditions in northern Adriatic
Fig. A1. Spatial distribution of correlation coefficients between SLP data for each grid point and salinity in the intermediary layer of the
middle Adriatic. Correlation coefficients significant at the p<0.05 level are marked in bold. Sign + and - correspond to positive and negative correlation with salinity.
Fig. A2. Yearly means of salinity (thick solid line) in the intermediate layer of the middle Adriatic in relation to the MO index (solid line) in
the 1945–1995 interval.
is traced as water having a temperature of 14◦C and salinity of 38.75 (Vilibi´c and Orli´c, 2001). High salinity in the region during conditions of large and positive pressure differences between the mid North Atlantic and southeast Mediterranean (and vice versa) indicate that the MO index controls LIW in-flow into the Adriatic.
When downscaling to the monthly values, the correlation between MO index and salinity in the middle Adriatic seems to be strong for some months (for example, the correlation between average February values of the two parameters in
the 1947–1995 interval amounted to 0.62; p<0.001). Nev-ertheless, the winter MO index (average for interval from December to March) in the same interval was correlated to a mean winter salinity with a value of r=0.34 (p<0.05), and is less significant than on the annual scale. Thus, we be-lieve that LIW inflow is a process that is mainly influenced by the atmospheric variations on time scales greater than months/season and, therefore, the definition of the MO in-dex is based on the annual air pressure differences.
Acknowledgements. The data used in this work were provided by Hydrometeorological Institute of the Republic of Croatia (Zagreb), by Istituto Sperimentale Talassografico “Francesco Vercelli” (Tri-este) and by the Center for Marine Research of Ruder Bokovic Insti-tute (Rovinj). The financial support of the Ministry of Science and Technology of the Republic of Croatia is acknowledged (projects 0098111, 0098121 and 000101105). The authors are thankful to Dr Daniel Lyons for proof reading the manuscript.
Topical Editor N. Pinardi thanks two referees for their help in evaluating this paper.
References
Conte, M., Giuffrida, A., and Tedesco, S.: The Mediterranean Os-cillation, impact on precipitation and hydrology in Italy, Con-ference on Climate, Water, Pub. of the Academy of Finland, Helsinki, 121–137, 1989.
Dadic, V.: MEDAS, Mediterranean environmental database of the Adriatic Sea, Proceedings, Elmar 38th international symposium electronics in marine, 24.06.–26.06.1996, 65–60, 1995. Degobbis, D., Precali, R., Ivanˇci´c, I., Smodlaka, N., Fuks, D., and
Kveder, S.: Long-term changes in the northern Adriatic ecosys-tem related to anthropogenic eutrophication, Int. J. Environ. Pol-lut., 13, 495–533, 2000.
Dulˇci´c, J., Grbec, B., Lipej L., Beg-Paklar, G., Supi´c, N., and Smirˇci´c, T.: The effect of the hemispheric climatic oscillations on the Adriatic ichthyofauna, Fresen. Environ. Bull., in press, 2004.
Franco, P. and Michelato, A.: Northern Adriatic Sea: Oceanogra-phy of the basin proper and of the western coastal zone, Sci. Total Environ., Suppl., 35–62, 1992.
Gill, A. E.: Atmosphere-ocean dynamics, Academic Press, Or-lando, 1982.
Grbec, B.: Influence of climatic changes on oceanographic proper-ties of the Adriatic Sea, Acta Adriat., 38, 3–29, 1997.
Grbec, B., Morovi´c, M., and Zore-Armanda, M.: Some new ob-servations on the long-term salinity changes in the Adriatic Sea, Acta Adriat., 39, 3–12, 1998.
Grbec, B., Dulˇci´c, J., and Morovi´c, M.: Long-term changes in land-ings of small pelagic fish in the eastern Adriatic – possible influ-ence of climate oscillations over the northern hemisphere, Clim. Res., 20, 241–252, 2002.
Grbec, B., Morovi´c, M., and Zore-Armanda, M.: Mediterranean Oscillation and its relationship with salinity fluctuation in the Adriatic Sea, Acta Adriat., 44, 61–76, 2003.
Hurrell, J. W.: Decadal trends in the North Atlantic Oscillation in-dex and relationship to regional temperature and precipitation, Science, 269, 676–679, 1995.
Hurrell, J. W. and Vanloon, H.: Decadal variations in climate asso-ciated with the North Atlantic Oscillation, Climatic Change, 36, 301–326, 1997.
Jones, P. D.: The early twentieth century arctic high - fact or fic-tion?, Clim. Dynam., 1, 63–75, 1987.
Kutiel, H., Maheras, P., and Guika, S.: Circulation indices over the Mediterranean and Europe and their relationship with rainfall conditions across the Mediterranean, Theor. Appl. Climatol., 54, 125–138, 1996.
Kutiel, H. and Benaroch, Y.: North sea-caspian pattern (NCP) an upper level atmospheric teleconnection affecting the eastern mediterranean: Identification and definition, Theor. Appl. Cli-matol., 71, 17–28, 2002.
Maheras, P., Xoplaki, E., and Kutiel, H.: Wet and dry monthly anomalies across the Mediterranean basin and their relationship with circulation, 1860–1990, Theor. Appl. Climatol., 64, 189– 199, 1999.
Malanotte-Rizzoli, P., Manca, B. B., D’Alcala, M. R., Theocharis, A., Bergamasco, A., Bregant, D., Budillon, G., Civitarese, G., Georgopoulos, D., Michelato, A., Sansone, E., Scarazzato, P., and Souvermezoglou, E.: A synthesis of the ionian sea hydrog-raphy, circulation and water mass pathways during POEM-Phase I, Prog. Oceanogr., 39, 153–204, 1997.
Orli´c, M., Gaˇci´c, M., and La Violette, P. E.: The currents and circu-lation of the Adriatic Sea, Oceanol. Acta, 15, 109–124, 1992. Storch, H. and Zwiers, F. W.: Statistical analysis in climate
re-search, Cambridge University Press, 1999.
Stravisi, F.: Sea temperature in Trieste (1946–1999), HYDRORES, Pesca maricultura ambiente, Annuario 2000 (in Italian), 7–16, 2000.
Supi´c, N.: Surface fluxes and hydrographic characteristics of the northern Adriatic, M Sc Thesis (in Croatian), 1993.
Supi´c, N. and Orli´c, M.: Seasonal and interannual variability of the northern Adriatic surface fluxes, J. Mar. Syst., 20, 205–229, 1999.
Supi´c, N., Orli´c, M. and Degobbis, D.: Small-scale spatial variabil-ity of surface heat flux over the northern Adriatic, Period. Biol., 99, 169–179, 1997.
Supi´c, N. and Ivanˇci´c, I.: Hydrographic conditions in the northern Adriatic in relation to surface fluxes and Po river discharge rates (1966–1992), Period. Biol., 104, 203–209, 2002.
Supi´c, N., Orli´c, M., and Degobbis, D.: Istrian Coastal Countercur-rent in the year 1997, Nuovo Cimento, 26, 117–131, 2003. Trenberth, K. E. and Paolino Jr., D. A.: The northern hemisphere
sea-level pressure data set: Trends, errors and discontinuities, Mon. Wea. Rev., 108, 855–872, 1980.
UNESCO, tenth report of the joint panel on oceanographic tables and standards, UNESCO technical papers in marine science, number 36, UNESCO, Paris, 1981.
Vilibi´c, I. and Orli´c, M.: Least-squares tracer analysis of water masses in the south Adriatic (1967–1990), Deep-Sea Res. I, 48, 2297–2330, 2001.
Williams, J. and Vanloon, H.: An examination of the northern hemi-sphere sea- level pressure data set, Mon. Wea. Rev., 104, 1354– 1361, 1976.
Zore-Armanda, M.: Water exchange between the Adriatic and the eastern Mediterranean, Deep-Sea Res., 16, 171–178, 1969. Zore-Armanda, M.: Response of the Mediterranean to the
oceano-graphic /meteorological conditions of the northern Atlantic., Rapp. Comm. int. Mer Mdit. 21, 203–205, 1972.
Zore-Armanda, M., Bone, M., Dadi´c, V., Morovi´c, M., Ratkovi´c, D., Stojanovski, L., and Vukadin, I.: Hydrographic properties of the Adriatic Sea in the period from 1971 through 1983, Acta Adriat., 32, 5–540, 1991.