HAL Id: hal-01701424
https://hal.archives-ouvertes.fr/hal-01701424
Submitted on 20 Apr 2018
HAL is a multi-disciplinary open access
archive for the deposit and dissemination of
sci-entific research documents, whether they are
pub-lished or not. The documents may come from
teaching and research institutions in France or
abroad, or from public or private research centers.
L’archive ouverte pluridisciplinaire HAL, est
destinée au dépôt et à la diffusion de documents
scientifiques de niveau recherche, publiés ou non,
émanant des établissements d’enseignement et de
recherche français ou étrangers, des laboratoires
publics ou privés.
axons
Archan Ganguly, Yong Tang, Lina Wang, Kelsey Ladt, Jonathan Loi,
Bénédicte Dargent, Christophe Leterrier, Subhojit Roy
To cite this version:
Archan Ganguly, Yong Tang, Lina Wang, Kelsey Ladt, Jonathan Loi, et al.. A dynamic
formin-dependent deep F-actin network in axons. Journal of Cell Biology, Rockefeller University Press, 2015,
210 (3), pp.401 - 417. �10.1083/jcb.201506110�. �hal-01701424�
JCB:
Article
T
H
E J
O
U
R
N
A
L O
F C
E
L
L B
IO
L
O
G
Y
The Rockefeller University Press $30.00
Introduction
Actin is a key conserved cytoskeletal component in eukaryotic
cells. In axons, actin is enriched at growth cones where it is
involved in navigation, signaling, and stabilization upon target
innervation (Dent et al., 2011; Gomez and Letourneau, 2014).
Although the biology of actin at this locale has been intensely
investigated, even basic details of actin structure and function
along axon shafts are unclear. Early ultrastructural studies in
squid axons found abundant actin filaments, not only in the
sub-axolemmal region (Hirokawa, 1982; Schnapp and Reese, 1982)
but also deep within the axon shaft (Fath and Lasek, 1988;
Bearer and Reese, 1999). However, most aspects of axonal actin
have remained obscure for decades, perhaps as a result of
tech-nical issues related to imaging and preservation of these delicate
cytoarchitectural elements. Recently, super-resolution imaging
using stochastic optical reconstruction microscopy (STORM)
revealed periodic scaffolds of actin circumferentially wrapping
underneath the axolemma in a “ladderlike, quasi-1D lattice”
pattern—termed “actin rings” (Xu et al., 2013). The actin rings
described by STORM are highly stable and likely play
import-ant scaffolding roles (Xu et al., 2013; Zhong et al., 2014);
how-ever, the microanatomy, dynamics, and putative physiological
roles of deep axonal actin remain a mystery to this day.
In most cells, dynamic pools of deep cytoplasmic actin are
involved in maintaining intracellular form and function
(Mich-elot and Drubin, 2011). Indeed, a few studies hint that axons
have dynamic actin pools as well. An early FRAP study with
fluorescent-tagged actin saw recovery of the bleached zone in
axons within minutes, suggesting a dynamic network (Okabe
and Hirokawa, 1990). Other experiments have noted
correla-tions of intermittent axonal actin dynamics with morphological
fluctuations. Microscopic actin accumulations in distal axons
coincided with filopodial extensions in developing neurons—
called “actin patches” (Loudon et al., 2006), and curious
ac-tin-rich growth cone–like structures move very infrequently
along axons (
∼1–2 every hour)—best described in young
cul-tured neurons—called “actin waves” (Ruthel and Banker, 1998;
Flynn et al., 2009). Pulse–chase radiolabeling studies have
shown that perikaryally synthesized actin is conveyed by slow
axonal transport, also implying dynamism (Black and Lasek,
1979; Willard et al., 1979; Galbraith and Gallant, 2000). Actin
is also highly enriched at presynapses, where it plays important
structural and functional roles (Cingolani and Goda, 2008).
Though these studies suggest that axonal actin can be
dynamic, it is unclear whether the intermittent and infrequent
actin behaviors reported so far represent the steady-state
situ-Although actin at neuronal growth cones is well-studied, much less is known about actin organization and dynamics
along axon shafts and presynaptic boutons. Using probes that selectively label filamentous-actin (F-actin), we found
focal “actin hotspots” along axons—spaced ∼3–4 µm apart—where actin undergoes continuous assembly/disassembly.
These foci are a nidus for vigorous actin polymerization, generating long filaments spurting bidirectionally along
ax-ons—a phenomenon we call “actin trails.” Super-resolution microscopy reveals intra-axonal deep actin filaments in
addition to the subplasmalemmal “actin rings” described recently. F-actin hotspots colocalize with stationary axonal
endosomes, and blocking vesicle transport diminishes the actin trails, suggesting mechanistic links between vesicles and
F-actin kinetics. Actin trails are formin—but not Arp2/3—dependent and help enrich actin at presynaptic boutons.
Fi-nally, formin inhibition dramatically disrupts synaptic recycling. Collectively, available data suggest a two-tier F-actin
organization in axons, with stable “actin rings” providing mechanical support to the plasma membrane and dynamic
"actin trails" generating a flexible cytoskeletal network with putative physiological roles.
A dynamic formin-dependent deep F-actin network
in axons
Archan Ganguly,
1Yong Tang,
1Lina Wang,
1Kelsey Ladt,
1,2Jonathan Loi,
1Bénédicte Dargent,
3Christophe Leterrier,
3and Subhojit Roy
1,21Department of Pathology and 2Department of Neurosciences, University of California, San Diego, La Jolla, CA 92093
3Aix Marseille Université, Centre National de la Recherche Scientifique, Centre de Recherche en Neurobiologie et Neurophysiologie de Marseille (CRN2M) UMR7286,
13344 Marseille, France
© 2015 Ganguly et al. This article is distributed under the terms of an Attribution– Noncommercial–Share Alike–No Mirror Sites license for the first six months after the pub-lication date (see http://www.rupress.org/terms). After six months it is available under a Creative Commons License (Attribution–Noncommercial–Share Alike 3.0 Unported license, as described at http://creativecommons.org/licenses/by-nc-sa/3.0/).
Correspondence to Subhojit Roy: [email protected]
Abbreviations used in this paper: BFA, Brefeldin-A; CH, calponin homology; DIV, day in vitro; NPYss, Neuropeptide-Y signal sequence; ROI, region of inter-est; STORM, stochastic optical reconstruction microscopy; Utr, utrophin.
on July 27, 2015
jcb.rupress.org
Downloaded from
Published July 27, 2015
http://jcb-dataviewer.rupress.org/jcb/browse/11152
This article has original data in the JCB Data Viewer
on July 27, 2015
jcb.rupress.org
Downloaded from
Published July 27, 2015on July 27, 2015
jcb.rupress.org
Downloaded from
Published July 27, 2015on July 27, 2015
jcb.rupress.org
Downloaded from
Published July 27, 2015on July 27, 2015
jcb.rupress.org
Downloaded from
Published July 27, 2015on July 27, 2015
jcb.rupress.org
Downloaded from
Published July 27, 2015on July 27, 2015
jcb.rupress.org
Downloaded from
Published July 27, 2015on July 27, 2015
jcb.rupress.org
Downloaded from
Published July 27, 2015on July 27, 2015
jcb.rupress.org
Downloaded from
Published July 27, 2015on July 27, 2015
jcb.rupress.org
Downloaded from
Published July 27, 2015on July 27, 2015
jcb.rupress.org
Downloaded from
Published July 27, 2015ation in more mature axons. Moreover, the perceived anatomy
of putative flexible actin networks is inconsistent with the
sta-ble actin rings described by STORM. Finally, deep actin pools
play numerous physiological roles in a variety of cell types,
but physiological consequences of axonal deep actin pools—if
any—are unclear. Here, we use F-actin–selective probes to
vi-sualize axonal actin, using a multifaceted approach: low-light
live imaging combined with quantitative biology tools and 3D
STORM. Our experiments reveal a dynamic, previously
un-characterized population of deep axonal actin filaments distinct
from subplasmalemmal actin rings.
Results
“Actin trails”—an unrecognized dynamic pool of deep axonal actin
Historically, a challenge in the actin field has been the imaging
bulk cytoplasmic F-actin (Field and Lénárt, 2011). Although the
classic approach of labeling monomeric actin with GFP/RFP
has been fruitful in thin, spread-out growth cones, they are
un-satisfactory for visualizing actin within axonal shafts as
back-ground fluorescence from free monomers typically overwhelms
the signal. To selectively label F-actin, we used two established
probes—EGFP tagged to the calponin homology (CH) domain of
actin-binding protein utrophin (Utr), GFP:Utr-CH (Burkel et al.,
2007), and LifeAct (Riedl et al., 2008). Data from both probes
were comparable (see later), but the signal/noise ratio was much
better with GFP:Utr-CH, probably because LifeAct also binds
actin monomers (with an even higher affinity than filaments;
Riedl et al., 2008). Our basic approach was to transfect cultured
hippocampal neurons at 7–9 d in vitro (DIV; obtained from
post-natal pups) with GFP:Utr-CH and image actin dynamics in axons
(also cotransfected with soluble mRFP to visualize morphology).
Protocols were optimized to minimize expression and maximize
sensitivity of detection (Fig. S1; Materials and methods; and
accompanying methods paper, Ladt et al., 2015). For these
ex-periments, we focused on primary axons (not branches) with
minimal anatomical variations that were away from cell bodies
(35–150 µm away from soma, mean = 95 µm) and distal en
pas-sant boutons, as in our other studies (Scott et al., 2011; Tang et
al., 2012; Fig. 1 A, see RFP image of selected axon at bottom).
Surprisingly, we saw rapid, bidirectional fluorescent
plumes representing dynamic actin polymers in axons (actin
trails) as shown in the still frames from an exemplary time
lapse (Fig. 1 A, tips of trails marked with arrowheads; also see
Video 1). A kymograph representing these dynamics is shown
in Fig. 1 B (corresponding events in still frames and kymograph
are labeled by similar arrowheads in Fig. 1, A and B). Note that
actin trail kinetics appear as “fluorescent plumes” in the
kymo-graphs (Fig. 1 C, zoomed crops; and additional examples in
Fig. S2 A). Other F-actin behaviors can be seen in these
kymo-graphs. Note “hotspots” of F-actin, regularly interspersed along
the axon (Fig. 1 D, interrupted vertical lines in our kymographs,
marked by arrowheads), indicating microscopic zones where
actin is continuously polymerizing and depolymerizing (note
that depolymerization would cause a loss of GFP:Utr-CH signal
as the molecules diffuse away; Burkel et al., 2007). Upon closer
examination, many of the actin trails appeared to emanate from
(and occasionally collapse into) the F-actin hotspots (Fig. 1 D,
asterisks mark the location of the hotspots on kymographs, and
numbered arrows point to some examples of actin trails).
Quantitative data from these experiments are shown in
Fig. 2. F-actin hotspots were distributed at 3.6 ± 1.8–µm
inter-vals along axons (see Materials and methods for details) and
lasted for an mean of
∼30 s (Fig. 2 A). Note that the frequencies
of actin trails (Fig. 2 B) are orders of magnitude greater than the
“actin waves” previously described in younger neurons (Flynn
et al., 2009). Moreover, actin trails are not accompanied by
axo-nal morphological fluctuations (as determined by simultaneous
imaging of GFP:Utr-CH and soluble mRFP; see additional data
linked to this article on the JCB DataViewer), and unlike actin
waves, are independent of microtubules (see next section). Thus,
the actin trails are clearly distinct from the intermittent actin
dy-namics described in previous studies (Ruthel and Banker, 1998;
Loudon et al., 2006). The polymers comprising the actin trails
extended for tens of micrometers (Fig. 2 C), and their rate of
extension was striking, with a mean of
∼1 µm/s and a maximum
rate of over 2 µm/s. Many actin trails qualitatively appeared to
arise from the hotspots. As both of these events could be readily
visualized in kymographs (examples in Fig. 1, E and F), we
quantified the relationship of actin trails with hotspots. Indeed
as shown in Fig. 2 E,
∼80% of the actin trails emerged from
hotspots, whereas
∼60% collapsed into them. Actin trails were
also seen with LifeAct (Fig. S2, B and C).
Recently, super-resolution microscopy in cultured
hip-pocampal axons using labeled phalloidin highlighted striking
circumferential rings wrapping underneath the axonal
plas-malemma (Xu et al., 2013; Lukinavi
čius et al., 2014; D’Este
et al., 2015). The long dynamic axonal filaments seen in our
imaging experiments don’t seem compatible with actin rings,
so we performed 3D STORM of neurons labeled with
phalloi-din, focusing on axon segments similar to the ones we used for
live imaging. Representative images from these experiments are
shown in Fig. 3. Axon shafts emerging from the soma (Fig. 3,
A–C) as well as thinner, more distal axons (Fig. 3, D–F)
ex-hibited circumferential actin rings with a periodic spacing of
192 ± 6 nm, as previously described (Xu et al., 2013; D’Este et
al., 2015). However, in addition to these periodic rings, axons
also containedactin filaments that were longitudinally oriented
along the axon shaft (Fig. 3, B, C, E, and F). XZ cross
sec-tions showed these filaments were unequivocally located deep
inside the axoplasm, distinct from the subplasmalemmal actin
rings (Fig. 3, B
′–C′ and E′).
Local actin polymerization in axons—a putative vesicle–actin network
Next, we asked whether the axonal F-actin dynamics were
de-pendent on actin turnover. For these experiments, we treated
axons with low levels of actin-modulating drugs, examining
F-actin dynamics in the same axon before/after pharmacologic
treatment. GFP:Utr-CH–transfected neurons were treated with
nanomolar doses of latrunculin—a drug that sequesters actin
monomers—or jasplakinolide, a drug that promotes actin
po-lymerization by enhancing the rate of filament nucleation (Bubb
et al., 1994; Morton et al., 2000). As shown in Fig. 4 A,
latrun-culin treatment caused a gradual attenuation in the
polymeriza-tion rate of actin trails (note changing slopes in kymographs
over time, indicating attenuated assembly), which was
revers-ible upon drug washout (Fig. S2 D, axons corresponding to the
kymographs). The slowing of actin polymerization most likely
reflects diminished availability of monomers to the growing
polymer, following monomer sequestration by latrunculin. On
the other hand, jasplakinolide treatment led to an inhibition of
on July 27, 2015
jcb.rupress.org
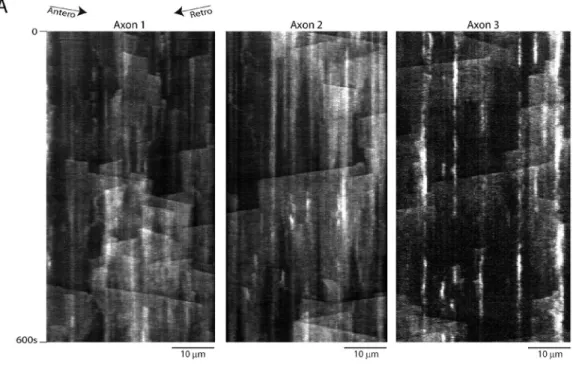
Figure 1. F-actin dynamics in axons. Neurons were transfected with GFP:Utr-CH to label F-actin (and soluble mRFP to visualize morphology), and F-actin dynamics in axons were imaged as described in methods. (A) Selected frames from a representative video showing anterograde (left) and retrograde (right) dynamics of actin polymers (dynamic tips marked by single/double arrowheads). Image far below shows soluble mRFP in the same axon. Elapsed time in seconds on left/right (see Video 1). (B and C) Kymograph of the video in A with first frame on top shown in B. Boxed ROIs are zoomed in C. Note unusual F-actin dynamics including diagonal, vectorial plumes of fluorescence (actin trails) and hotspots (vertical interrupted lines). Yellow and red arrowheads represent the same dynamic structures in A and B. Elapsed time is given in seconds on the left. (D) Cropped kymographs from other videos show focal F-actin hotspots (some marked by asterisks). Instances of actin trails emerging from—and collapsing into—hotspots can also be seen. Note trails marked by arrows 1, 2, 6, and 7 are emerging from hotspots. Antero, anterograde; Retro, retrograde.
on July 27, 2015
jcb.rupress.org
Downloaded from
actin trails, along with stationary F-actin accumulations along
former hotspots (Fig. 4 B), probably as a result of
hyperstabi-lization of dynamic actin. Another actin disrupting agent
cyto-chalasin-D also attenuated the actin trails (all data quantified in
Fig. 4, D–G). Collectively, these data suggest that actin trails
are generated by local polymerization at axonal hotspots.
Microtubules are the basis of almost all motility in axons,
and an early ultrastructural study noted a physical
approxima-tion of microtubules and actin filaments within the axon shaft
(Bearer and Reese, 1999). However, our experiments indicate
that actin trails are largely independent of microtubules. First,
treatment of axons with the microtubule-depolymerizing agent
nocodazole—under conditions that block vesicle transport—
had minimal effects on actin trails (Fig. 4, C–F; and Fig. S3 A).
Even treatment with vincristine—a drug that fragments
micro-tubule polymers, leading to tubulin paracrystals—had no effects
on actin trails (Fig. S3 B). These data indicate that
microtu-bules are not required for initiating or sustaining the actin trails.
Moreover, actin trails do not seem to assist conventional vesicle
transport in any way, as treatment with jasplakinolide—a drug
that almost completely blocks the actin trails (Fig. 4 B)—did
not impede vesicle transport (Fig. S3 C). Also note that
incuba-tion with DMSO (used as controls in some experiments) had no
effects on axonal F-actin dynamics (Fig. S3 D).
The actin hotspots appear critical for initiating the axonal
F-actin network, but how is this local assembly regulated?
Re-cent studies in mouse oocytes described a deep F-actin network
where actin filaments nucleate and polymerize on the surface
of scattered endosomes (Pfender et al., 2011; Schuh, 2011).
The periodic spacing of axonal F-actin hotspots (
∼3–4 µm)
is also reminiscent of stationary endosomal vesicles in axons
(Fig. S4 A; Prekeris et al., 1999). Thus, we reasoned that the
Figure 2. Quantitative analyses of F-actin hotspots and trails. (A) Mean lifetime of F-actin hotspots was 80.40 ± 3.95 s (n = 575 events from 28 axons). (B) Mean number of F-actin trails (every 10 min of imaging) was 20.35 ± 1.98 for anterograde events and 14.92 ± 1.35 for retrograde events (992 events from 28 axons). (C) Mean total lengths of F-actin polymers were 8.85 ± 0.18 µm (n = 573 events) and 8.87 ± 0.22 µm (n = 419 events) for anterograde and retrograde trails, respectively. (D) Mean elongation rates of F-actin trails were 0.99 ± 0.01 µm/s in both directions. (E) On average, 80.59 ± 2.23% F-actin trails emerged from hotspots (n = 36 axons). (F) On average, 63.00 ± 2.80% F-actin trails collapsed into hotspots (n = 36 axons). Arrowheads and asterisks in E and F represent initiation/termination of actin trails and position of hotspots, respectively. All values represent means ± SEM. Antero, anterograde; Retro, retrograde.
on July 27, 2015
jcb.rupress.org
F-actin hotspots in our experiments may also be initiated by
actin monomers nucleating on stationary axonal endosomes. To
test this idea, we labeled F-actin (using GFP:Utr-CH) and
endo-somes in neurons and imaged axons by dual-color live imaging.
As shown in Fig. 5 (A and B), F-actin hotspots were often
colo-calized with (or adjacent to) stationary endosomes, with several
actin trails initiating precisely from locales where endosomes
were situated (Fig. 5 A
′ shows an example). Next, we designed
quantitative algorithms in MATLAB to determine the overlap
between F-actin hotspots and stationary endosomes (see
Mate-rials and methods for details). Data from these analyses suggest
that many F-actin hotspots colocalize with stationary axonal
endosomes (Fig. 5 C, left). There is some innate variability in
the frequencies of F-actin trails from axon to axon (Fig. 2 B;
also seen with other cargoes, see Tang et al., 2013). We found
that frequency of F-actin trails correlated with the number of
stationary axonal endosomes (Fig. 5 C, right), further
suggest-ing links between endosomes and actin dynamics. If actin trails
were indeed dependent on vesicles, conditions attenuating
ax-onal vesicles would also be expected to diminish actin trails.
Figure 3. 3D STORM imaging of actin reveals intra-axonal actin bundles. (A and A′) Widefield image of a hippocampal neuron labeled with phalloidin (F-actin) and Neurofascin-186 (NF-186; to label the axon initiation segment [AIS], brackets). Proximal axon marked with arrowheads. (A′) 3D-STORM image of the actin labeling corresponding to the boxed area in A. Color codes for Z depth from −300 nm (blue) to 300 nm (red). Note Y-shaped proximal axon, as well as distal axons from other neurons. (B and C) Zoomed XY projections (300–600 nm thick) of the boxed regions (B and C) in image A′. Note that several longitudinal actin filaments can be seen within the axon shaft (arrowheads), in addition to periodic actin rings (comb). (B′ and C′) XZ slices (800 nm thick) from axons shown in B and C (area within brackets) highlighting intra-axonal actin filaments (arrowheads, dashed ellipse localizes the axon boundary). (D) 3D STORM image of distal axons with a dendritic shaft on right. Color codes for Z depth from −300 nm (blue) to 300 nm (red). (E and E′) XY/XZ projections (300–400 nm thick) of the boxed regions E in image D. Note longitudinal actin filaments inside the distal axon (arrowheads), together with the periodic actin rings (comb). (F and F′) Same imaging parameters and scales as previous, showing an axon segment with actin rings. Bars: (A) 20 µm; (A′ and D) 5 µm; (B, C, and E–F′) 2 µm; (B′ and C′) 500 nm.
on July 27, 2015
jcb.rupress.org
Downloaded from
To test this, we incubated neurons with Brefeldin-A (BFA), a
drug that blocks endoplasmic reticulum to Golgi transport and
attenuates vesicle transport in axons (Fig. S4, B and C; Jareb
and Banker, 1997; Tang et al., 2013). Indeed both frequency and
dynamics of actin trails were dramatically attenuated upon BFA
treatment and reappeared upon drug washout (Fig. 5, D and E).
Some stationary accumulations of F-actin were still visible after
BFA treatment—though the durations of these hotspots were
much prolonged—and might be a result of incomplete vesicle
depletion by BFA treatment.
The extremely rapid rate of actin polymerization in our
system (
∼1 µm/s; Fig. 2 C) is striking, resembling rates
previ-ously observed for formin-mediated actin elongation in vitro
(Vidali et al., 2009) and in cells (Higashida et al., 2004). Formins
are a group of highly conserved proteins that bind to the barbed
(growing) ends of actin filaments, promoting rapid nucleation
Figure 4. Axonal F-actin dynamics are dependent on actin turnover. (A and B) Kymographs from an axon transfected with GFP:Utr-CH (to label F-actin) and imaged before/after treatment with 100 nM latrunculin or 100 nM jasplakinolide. (A) Note gradual change in the slopes of the F-actin trails over 15 min of incubation, indicating attenuated polymerization. Drug washout (W/O) restores F-actin dynamics (right). (B) Treatment with jasplakinolide for 10 min essentially eliminates the on/off kinetics, leading to stationary F-actin accumulations along axons. (C) Kymographs of F-actin dynamics before and after treatment with 10 µg/ml nocodazole (NOC; note minimal change; Fig. S3 A). (D–G) Quantification of all F-actin dynamics after pharmacological treatments. Note that in general, actin-modulating drugs (latrunculin [LAT], cytochalasin-D, and jasplakinolide [JASP]) attenuate actin dynamics, whereas the microtubule-disrupting agent nocodazole has no effect. Also note increase in hotspot duration upon cytochalasin-D treatment is likely caused by the actin-capping effect of this agent (Cooper, 1987). Increase in hotspot duration upon jasplakinolide treatment may reflect hyperstabilization of F-actin dy-namics. All experiments were performed before and after treating the same axon with the stated drug. For latrunculin treatment, n = 8 axons; cytochalasin-D treatment, n = 8 axons; jasplakinolide treatment, n = 6 axons; and nocodazole treatment, n = 8 axons were imaged. At least three independent repeats were performed for each condition. All values represent means ± SEM; (***, P < 0.001; **, P < 0.01, paired t test). For detailed statistics, see Table S1. Arrows between images represent passage of time in before/after experiments.
on July 27, 2015
jcb.rupress.org
and elongation (Chesarone et al., 2010). To determine whether
formins were involved in generating axonal F-actin dynamics,
we incubated neurons with the selective small-molecule formin
inhibitor SMIFH2 (Rizvi et al., 2009) and examined F-actin
dy-namics in axons. Indeed, SMIFH2 attenuated the actin trails,
whereas an inhibitor of another major actin nucleator Arp2/3
Figure 5. Correlation of axonal F-actin dynamics and stationary endosomes. (A) Kymographs from neurons transfected with GFP:Utr-CH (to label F-actin) and pHRodo (a pH-sensitive endosomal marker that largely labeled stationary endosomes in axons, see Materials and methods), simultaneously visualized by live imaging. Note colocalization of F-actin hotspots (green) with pHrodo (red, overlay on right). A′ shows a zoomed ROI from overlay highlighting two actin trails originating precisely from where two stationary endosomes are situated (marked by asterisks). (B) Kymographs from neurons transfected with GFP:Utr-CH (to label F-actin) and Rab5:mCherry (to label early endosomes). Note colocalization of F-actin hotspots with early endosomes. (C, left) Quantification of colocalization data. The mean frequency of F-actin hotspots that overlapped with stationary endosomes labeled with pHRodo, Rab5-mRFP, and Lamp1-mCherry was 46.81 ± 2.76% (n = 13 axons), 29.04 ± 3.75% (n = 10 axons), and 9.58 ± 3.61% (n = 6 axons), respectively. (right) F-actin dynamics also correlated with number of pHRodo-positive endosomes in axons (n = 16 axons). (D and E) Neurons weretransfected with GFP:Utr-CH (to label F-actin) and treated with Brefeldin-A (BFA) to deplete vesicles in axons (Fig. S4 B). Kymographs show that F-actin dynamics in axons were greatly attenuated upon BFA treatment and restored upon washout of the drug; quantified in E. All values represent means ± SEM. ***, P < 0.001, one way analysis of variance followed by Dunnett’s post hoc test. For detailed statistics, see Table S1.
on July 27, 2015
jcb.rupress.org
Downloaded from
(CK666; Nolen et al., 2009) had no effect (Fig. 6, A and B).
These data (quantified in Fig. 6, C–F) indicate that the
elon-gation of actin trails is formin dependent. As formins are
in-volved in both nucleation and elongation of actin (Chesarone
et al., 2010), one might expect that SMIFH2 treatment would
also inhibit the appearance of hotspots. Interestingly, however,
not only were the hotspots present after SMIFH2 treatment, but
in fact, there was an increase in their duration (Fig. 6 F). These
data suggest that the nucleation of F-actin at the hotspots
(pre-sumably on endosomes) is not formin dependent, and the slight
increase in hotspot duration upon SMIFH2 treatment might be
a compensatory consequence of decreased actin trails
emanat-ing from the hotspots. Finally, SMIFH2 treatment had minimal
effects on vesicle transport, as determined by live imaging of
synaptophysin:mRFP, a marker for motile synaptic vesicles, or
Neuropeptide-Y signal sequence (NPYss):mCherry, a marker
for Golgi-derived vesicles (El Meskini et al., 2005; Kaech et
al., 2012). These data strongly argue against nonspecific
pertur-bation of axonal transport by SMIFH2 (Fig. S5, A and B). For
detailed statistics, see Tables S1 and S2.
Presynaptic F-actin enrichment is formin dependent
Next, we looked at F-actin at presynaptic specializations along
axons. Actin is highly enriched at presynapses, and several
studies have reported that actin filaments are circumferentially
organized as a cage-like structure surrounding the synaptic
ves-icle cluster (Landis et al., 1988; Hirokawa et al., 1989; Gotow et
al., 1991; Saheki and De Camilli, 2012). These conclusions—
based on imaging fixed boutons with phalloidin or examination
of total actin pools tagged with GFP—have shaped a
prevail-ing view that actin plays a scaffoldprevail-ing role at this locale
(Bern-stein et al., 1998; Morales et al., 2000; Sankaranarayanan et al.,
2003). However, studies also suggest that actin has other roles
at synapses, including sequestration of synaptic vesicles and
fa-cilitation of endocytosis (Cingolani and Goda, 2008; Chia et
al., 2013; Christensen et al., 2013). To visualize organization of
F-actin at live boutons, we transfected 9–12 DIV neurons with
GFP:Utr-CH and synaptophysin:mRFP (to label F-actin and the
synaptic vesicle cluster, respectively); located distal en passant
boutons along the primary axon by synaptophysin:mRFP
mor-phology (Fig. 7; Wang et al., 2014) and performed dual-color
live imaging. As expected, steady-state F-actin accumulation at
boutons was significantly greater than axons (mean diameters
for GFP:Utr-CH–labeled puncta at boutons/axons were 18.5
± 2.8/4.1 ± 0.2 µm, respectively; sampling of
∼20–50
Utr-CH:GFP puncta for each; P < 0.0001).
Interestingly, though the overall distribution of F-actin
was somewhat circumferential around the synaptic vesicles,
the localization was highly dynamic, with microscopic synaptic
patches of Utr-CH:GFP spontaneously appearing and
disap-pearing over time (Fig. 7 A and Video 2). Also, actin trails were
invariably seen in axon segments flanking boutons, and these
trails often seemed to terminate at boutons, suggesting
F-ac-tin delivery, though the high levels of F-acF-ac-tin at boutons and
overlapping tracks of actin trails at these locales made definitive
conclusions difficult (Fig. 7 B, example kymograph). To
evalu-ate actin delivery into boutons in a more systematic way, we
de-signed a FRAP assay in which we photobleached GFP:Utr-CH
in a single bouton within a string of en passant boutons and
analyzed fluorescence recovery over time (see Materials and
methods; Scott and Roy, 2012). Fluorescence recovery at
bou-tons occurred within minutes, suggesting rapid delivery of
F-ac-tin into these specializations (Fig. 7 C, left, though we cannot
exclude diffusion/local assembly of unbound GFP:Utr-CH in
these experiments). If the GFP:Utr-CH recovery was mediated
by formin-dependent actin trails as predicted by our model, one
would expect that inhibition of formins would also attenuate
actin delivery into boutons. Indeed fluorescence recovery was
attenuated in neurons treated with the formin inhibitor SMIFH2
(Fig. 7 C, right; quantified in Fig. 7 D). Moreover, SMIFH2
also attenuated steady-state Utr-CH:GFP levels in the synaptic
patches (Fig. 7, E and F). In aggregate, these data argue that
the formin-dependent actin dynamics in axons helps
presyn-aptic enrichment of F-actin.
Formin inhibition disrupts synaptic vesicle recycling
Collectively, the aforementioned experiments suggest that
axons have an intricate, dynamic formin-dependent deep
F-ac-tin network that help enrich F-acF-ac-tin at boutons. Enrichment of
actin at synapses has been generally implicated in regulation of
synaptic physiology (Cingolani and Goda, 2008; Waites et al.,
2011) and more specifically in the myosin-dependent
traffick-ing of synaptic vesicles to the plasma membrane (Ryan, 1999)
and/or endocytosis (Shupliakov et al., 2002). Accordingly, we
asked whether inhibition of formins—and consequent
atten-uation of synaptic F-actin levels—would influence synaptic
vesicle recycling. Toward this we directly visualized synaptic
recycling using the pH-sensitive probe vGlut-pHluorin, asking
whether the formin-inhibitor SMIFH2 had any effect on the
exo/endocytic kinetics (Fig. 8 A, schematic). The principle of
the vGlut-pHluorin assay is that pH changes during
activity-in-duced recycling of synaptic vesicles result in fluorescence
fluc-tuations that can be readily quantified and provide a readout of
synaptic vesicle exo/endocytosis (Voglmaier et al., 2006;
Ba-laji and Ryan, 2007; Wang et al., 2014). Representative images
from one such experiment is shown in Fig. 8 B and quantitative
data in Fig. 8 (C and D). Note that treatment with SMIFH2
re-sulted in a dramatic attenuation of the exo/endocytic cycle, but
the Arp2/3 inhibitor CK-666 had essentially no effects.
Discussion
A dynamic F-actin network—a new model for axonal actin
Our experiments reveal a two-tier organization of axonal
F-ac-tin—with stable subplasmalemmal rings (originally described
by Xu et al., 2013) that mechanically support the plasma
mem-brane and dynamic intra-axonal filaments that helps enrich actin
at synapses, sustaining physiology. Collectively, our data
sug-gest a scenario in which actin monomers nucleate at discrete
hotspots along axons, on the surface of stationary endosomes.
Some of these hotspots lead to sustained formin-dependent
actin assembly and elongation, resulting in dynamic deep actin
polymers that can reach remarkable lengths of 30 µm or more
(actin trails; Fig. 9 A). Over time, the polymer disassembles or
occasionally shrinks. Though individual filaments are dynamic,
we posit that at steady state, they generate a robust cytoskeletal
network that that allows spatiotemporal control of actin levels
throughout these long processes (Fig. 9 B).
In principle, the vesicle–actin network we postulate would
allow rapid availability of actin to virtually any location within
on July 27, 2015
jcb.rupress.org
the axon, provided vesicles assisting actin nucleation events are
present. Also, though dynamic, the axonal actin filaments are
still likely able to support putative short-range myosin-driven
axonal transport (Bridgman, 2009). Because these
physiolog-ical events necessarily rely on dynamic actin pools and/or
in-tra-axonal polymers oriented along the long axis, involvement
of rigid, circumferential cytoskeletal structures such as the
subplasmalemmal actin rings seem unlikely. The vesicle–actin
network that we describe may even be a common evolutionary
strategy that equilibrates actin within large cells or elongated
processes. Using GFP:Utr-CH in mouse oocytes, Pfender et al.
(2011) and Schuh (2011) recently described a vesicle–actin
net-Figure 6. Axonal F-actin dynamics are Formin dependent. (A) Kymographs from an axon transfected with GFP:Utr-CH (to label F-actin) and imaged before (left) and after (right) treatment with the formin-inhibitor SMIFH2. Note dramatic attenuation of the F-actin trails with little effect on F-actin hotspots, suggesting that the nucleation of F-actin at hotspots is spontaneous, and not formin dependent. (B) Similar experiments as in A, except that neurons were treated with the Arp2/3 inhibitor CK-666. Note that addition of CK-666 essentially has no effects on axonal F-actin dynamics. (C–F) Quantification of F-actin dynamics from all experiments. Note that treatment with SMIFH2 attenuates various kinetic behaviors of the F-actin trails, whereas CK-666 has no effects. Also note that SMIFH2 treatment leads to an increase in the hotspot duration, perhaps a compensatory response to attenuated actin trails (also see Results). For SMIFH2 treatment, n = 9 axons and for CK-666 treatment, n = 6 axons were imaged. At least three independent repeats were performed for each condition. All values represent means ± SEM. *, P < 0.05; **, P < 0.01; ***, P < 0.001; paired t test. For detailed statistics, see Table S1. Arrows between images represent passage of time in before/after experiments.
on July 27, 2015
jcb.rupress.org
Downloaded from
Figure 7. Presynaptic F-actin dynamics are Formin dependent. (A) Images (left) and kymographs (right) of boutons from neurons transfected with GFP:Utr-CH (to label F-actin) and synaptophysin:mRFP (SyPhy:mRFP to label synaptic vesicle clusters). Note that F-actin appears as dynamic patches, circumferentially organized around the synaptic vesicle cluster. (B) Same experiment as above, except GFP:Utr-CH kymographs are scaled to reveal actin trails terminating into boutons (small arrowheads). (C and D) Representative images from a FRAP assay to detect F-actin entry into boutons, quantified in D. Neurons were transfected with GFP:Utr-CH and F-actin–enriched boutons were identified; a single bouton (dashed circles) within a string of synapses was photobleached, and recovery of fluorescence was visualized over time (see Materials and methods for details). Note rapid recovery of F-actin that is attenuated upon formin inhibition by SMIFH2, indicating diminished entry of F-actin into boutons after formin inhibition. (E and F) Maximum intensity pro-jection images from a representative synaptic bouton demonstrate reduction in total F-actin fluorescence upon SMIFH2. Graph in F shows that fluorescence intensities decrease from 1,859 ± 351.7 to 999.1 ± 146.7 arbitrary fluorescence units (n = 9 boutons paired) upon SMIFH2 treatment for 30 min. All values represent means ± SEM. Paired t test **, P < 0.01.
on July 27, 2015
jcb.rupress.org
Figure 8. The Formin inhibitor SMIFH2 suppresses synaptic recycling. (A) Schematic of vGlut1-pHluorin experiments. SV refers to synaptic vesicle. (B) Representative panels show the fluorescence intensity change of vGlut1-pHluorin upon 600 action potential (AP) stimulation and NH4Cl perfusion. Note
that NH4Cl alkalinizes all vesicles, revealing the total (recycling + resting) pool in these neurons. (C) Ensemble mean of vGlut1-pHluorin traces from control,
50 µM CK-666, or 30 µM SMIFH2-treated neurons (n = number of boutons). Note that although SMIFH2 attenuates neurotransmitter release and decreases synaptic vesicle endocytosis compared with control, CK-666 has no effect, quantified in C (all data normalized to total pools). (D, left) Recycling: Total pool ratio for control = 49.55 ± 3.81%; CK-666 = 45.65 ± 3.72%; and SMIFH2 = 23.84 ± 2.82%. (middle) Exocytosis rate for control = 0.017 ± 0.002; CK-666 = 0.014 ± 0.002; and SMIFH2 = 0.007 ± 0.001. (right) Endocytosis rate for control = 0.007 ± 0.002; CK-666 = 0.007 ± 0.002; and SMIFH2 = 0.001 ± 0.001. All values represent means ± SEM. (∼100–200 boutons on 7–11 coverslips were analyzed for each group from three separate batches of cultures; ***, P < 0.001; **, P < 0.01 compared with control by one-way analysis of variance followed by Dunnett’s post hoc test.)
Figure 9. Model of axonal F-actin. (A) Interpretative illustration derived from data. Actin monomers nucleate and polymerize at discrete microscopic zones in axons (light gray vertical bar). The hotspots are likely sites where actin nucleates on stationary endosomes. (B) Working model showing both subplasmalemmal actin rings and intra-axonal actin filaments. Note that actin monomers nucleate and extend polymers along the long axis of the axon, generating a steady-state scenario where actin is equilibrated along the axon, allowing spatiotemporal control throughout the long processes, and facili-tating delivery into presynaptic boutons.
on July 27, 2015
jcb.rupress.org
Downloaded from
work where F-actin polymerizes on the surface of endosomes
dispersed throughout the oocyte cytoplasm. Interestingly, this
polymerization is also formin dependent (Schuh, 2011).
Cy-toplasmic F-actin density in these oocytes vary with the stage
of maturation, and the F-actin network density also correlated
with endosomal abundance—suggesting that the vesicles were
regulating the oocyte actin network (Pfender et al., 2011).
These findings are strikingly reminiscent of our own data, in
which endosomal abundance in axons correlates with F-actin
dynamics (Fig. 5 C, right).
Another possibility is that the actin trails might be
in-volved in assisting vesicle transport, analogous to “actin
com-ets” in Listeria monocytogenes that are capable of transporting
vesicles (Tilney and Portnoy, 1989). Though intriguing, this
does not appear to be the case in axons. First, it is clear that
axonal endosomal vesicles remain largely stationary, whereas
actin trails elongate (Fig. 5, A and B), indicating that the actin
trails have little effect on the motility of these organelles.
Sec-ond, inhibition of the actin trails—either by jasplakinolide or
the formin-inhibitor SMIFH2—does not have much effect on
the axonal transport of Golgi-derived vesicles (Fig. S3 C and
Fig. S5, A–C). Moreover disruption of microtubules—and
mi-crotubule-based transport—has no effect on axonal F-actin
dy-namics (Fig. 4, C–G; and Fig. S3 B).
The microanatomy of axonal F-actin
Precise knowledge of the organization, polarity, and dynamics
of actin along axon shafts has been fuzzy for decades.
Previ-ous studies using extruded squid axons showed an extensive
network of intra-axonal actin filaments (Fath and Lasek, 1988;
Bearer and Reese, 1999). However, procedures used in these
studies invariably disrupted the cytoskeletal organization,
pre-cluding definitive conclusions. For instance, myosin-S1
la-beling—used to determine actin polarity—could only label
a subset of filaments; nevertheless, Bearer and Reese (1999)
noted “actin filaments with both polarities” along axons. In our
experiments, actin filaments elongate both anterogradely and
retrogradely along axons, and this would expectedly appear as
bipolar filaments in fixed axons. However, our live observations
also reveal that the organization is far more sophisticated than
a simple stacking of bipolar actin filaments along axons as
pre-viously imagined, even though the exact polarity orientation of
the elongating monomers remains unknown.
Though earlier EM experiments also showed a close
ap-position of microtubules and F-actin, disruption—and even
fragmentation—of axonal microtubules had no effect on
F-ac-tin dynamics, suggesF-ac-ting that the F-acF-ac-tin axonal dynamics in
our axons are largely independent of microtubules (Fig. 4, C–F;
and Fig. S3, A and B). One possibility is that despite anatomical
apposition, molecular mechanisms regulating F-actin
dynam-ics are largely independent of microtubules. It is also possible
that the relationship between microtubules and actin filaments
is more intimate in the much thicker squid axons. Also, the
lengths of axonal F-actin estimated by EM were small (
∼0.5–1
µm on average; Bearer and Reese, 1999), leading to the view
that actin filaments in axons are short (Letourneau, 2009).
How-ever, only a subset of filaments could be confidently evaluated
in these EM experiments because of technical limitations, and
postfixation preservation of the dynamic filaments (that are seen
in our live imaging experiments) might also be an issue. In view
of our live F-actin imaging and STORM data (using optimal
fix-ation protocols for F-actin, see Materials and methods), it now
seems likely that intra-axonal actin filaments can grow on to
much longer lengths than previously believed.
Our experiments suggest that the elongating actin
poly-mers are dependent on formins, and not Arp2/3 (Fig. 6).
Formins mediate elongation of long, unbranched actin
fila-ments, whereas Arp2/3 extends branched F-actin polymers on
the side of preexisting actin filaments (Goode et al., 2001), thus
it seems logical that formins would mediate the long, rapidly
elongating polymers seen in our experiments. Interestingly,
the F-actin hotspots are not disrupted by formin inhibition
(Fig. 6, A and F), suggesting that actin assembly on the
sur-face of endosomes is not formin dependent. The colocalization
of F-actin hotspots and endosomes in axons is often quite
pre-cise (Fig. 5, A and B); however, our data cannot exclude the
possibility that both F-actin and endosomes bind to a common,
yet unknown, structure/organelle in axons. Intriguingly,
elon-gating actin trails often seem to “deposit” F-actin along axons
during periods of elongation, perhaps by local
depolymeriza-tion (Fig. 1 C, top kymograph and other figures)—though
un-derlying mechanisms are unclear. Perhaps such local regulation
reflects cell-biological strategies by which F-actin localizes and
enriches along axons and synapses.
Organization and function of F-actin at presynaptic specializations
Our experiments also offer some insights into the organization
and function of actin at presynapses. Previous studies
examin-ing steady-state F-actin at synapses have noted a cage-like
dis-tribution surrounding the synaptic vesicle cluster. Based largely
on staining of fixed cells, this view has been held for some time,
advocating a model in which F-actin acts as a scaffold at
syn-apses (Wang et al., 1996; Bernstein et al., 1998; Morales et al.,
2000; Sankaranarayanan et al., 2003). This actin scaffold has
also been has been proposed to act as a “barrier” that restricts
the trafficking of synaptic vesicles to the plasma membrane,
suppressing vesicle recycling and exocytosis (Morales et al.,
2000). However, other experiments suggest that actin–myosin
networks are involved in transporting synaptic vesicles from the
reserve pool to their fusion sites at the plasma membrane (Ryan,
1999) and/or play a role in endocytic trafficking of recycling
synaptic vesicles (Shupliakov et al., 2002). Our live-imaging
experiments of boutons along primary axons suggest dynamic
F-actin patches around the synaptic vesicle cluster (Fig. 7 A and
Video 2). Furthermore, our data suggest that F-actin synaptic
patches are sustained by the actin trails. Specifically,
attenu-ation of the actin trails by the formin-inhibitor SMIFH2: (a)
decreased overall F-actin delivery to boutons as measured by
FRAP (Fig. 7 D) and (b) decreased the intensity of the F-actin
synaptic patches (Fig. 7 E).
The synaptic F-actin patches resemble transient F-actin
localization along endocytic zones in the plasma membranes
of other cell types (Michelot and Drubin, 2011). Along these
lines, it is interesting to speculate that these “synaptic patches”
might represent spontaneous endocytic events in resting
neu-rons (Melom et al., 2013). Indeed, other studies have implicated
actin in synaptic vesicle endocytosis. Detailed ultrastructural
studies in the large lamprey reticulospinal synapse revealed
long actin filaments connecting endocytic zones at the plasma
membrane to single synaptic vesicles and vesicle clusters upon
stimulation (Shupliakov et al., 2002). Recent studies also
sup-port a role for actin in rapid, nonclathrin-mediated “ultrafast”
endocytosis (Watanabe et al., 2014). However, available data
on July 27, 2015
jcb.rupress.org
dicate that actin likely has multiple roles at boutons, especially
in assembling and organizing presynaptic components (Waites
et al., 2011; Chia et al., 2013, 2014; Nelson et al., 2013), and
it is also possible that these patches dynamically assist in such
organization. Our pHluorin experiments indicate that inhibition
of formins has a dramatic effect on synaptic recycling (Fig. 8).
Given that SMIFH2 diminishes F-actin enrichment at boutons
(Fig. 7, E and F), we hypothesize that the effects on recycling
are a result of synaptic F-actin attenuation. However, a caveat
in these experiments is that we cannot exclude a local effect of
SMIFH2 at the synapse, or putative effects of this drug on the
postsynapse, and more detailed studies are needed to clarify the
functional roles of actin and formin at these locales.
In summary, our experiments reveal molecular details
of a previously unappreciated dynamic pool of deep actin
fil-aments in axons and offer new insights into the emerging
pic-ture of axonal actin. Collectively, the available data advocate a
model in which stable subplasmalemmal actin rings
mechan-ically support the axonal plasma membrane, and dynamic
in-tra-axonal filaments support physiological processes critical for
maintaining axonal and synaptic plasticity. Interestingly, this
two-tier organization seems to result in a paradoxical
cytoskel-etal network that not only tolerates the incredible mechanical
strains that long axons must endure but also allows the
flexi-bility needed in a structure that is continuously shaped by
in-trinsic and exin-trinsic factors.
Materials and methods
DNA constructs, cell cultures, and transfections
GFP:Utr-CH was a gift from W. Bement (University of Wisconsin, Madison, WI). NPYss:mCherry, Synaptophysin-dsRed, and pHluo-rin constructs were gifts from G. Banker (Oregon Health & Science University, Portland, OR), L. Lagnado (University of Sussex, Sussex, England, UK), and T. Ryan (Weill Cornell, New York, NY), respec-tively. DsRed-Mitochondria construct was obtained from Takara Bio Inc. Rab5:mRFP, Lamp1:mCherry, LifeAct:mTurquoise-2, and Life-Act:GFP were obtained from Addgene (from the laboratories of A. He-lenius [ETH Zurich, Zurich, Switzerland], A. Palmer [University of Colorado, Boulder, CO], D. Gadella [Swammerdam Institute for Life Sciences, Amsterdam, Netherlands], and M. Davidson [Florida State University, Tallahassee, FL], respectively). The rabbit anti– βIII-Tubu-lin antibody was a gift from P. Bass (Drexel University, Philadelphia, PA). Hippocampal cultures were obtained from brains of postnatal (P0– P1) CD-1 mice and plated on MatTek glass-bottom dishes as described previously in detailed published protocols (Roy et al., 2012; Ganguly and Roy, 2014), in accordance with University of California guidelines. In brief, MatTek dishes were coated with 100 µl of 1 mg/ml poly-d-ly-sine for 2 h at RT, washed thrice with ddH2O, and air dried before
plat-ing. Hippocampi from P0–P1pups were dissected in ice-cold dissection buffer (HBSS, 4.44 mM d-glucose, and 6.98 mM Hepes) and incu-bated in 0.25% Trypsin–EDTA at 37°C for 15 min. After this, neurons were dissociated in plating media (10% FBS and 90% Neurobasal/B27; Life Technologies) by trituration. Neurons were plated at a density of 50,000 cells/100 µl (only for en passant bouton imaging) and at 25,000 cells/100 µl (for all other experiments) of plating media. Neurons were maintained in Neurobasal/B27 media (supplemented with 2% B27 and 1% GlutaMAX) in an incubator at 37°C and 5% CO2 for 7–9 d before
transfection. Neurons were transfected with the indicated fluorescent constructs 7–9 DIV with Lipofectamine 2000 (Life Technologies), and all live imaging was performed ∼16–20 h after transfection.
Trans-fection parameters were strictly optimized for GFP:Utr-CH to avoid actin bundling (Fig. S1). Specifically, two criteria were followed. (1) Neurons were transfected with one third the amount of DNA routinely used in our laboratory (0.3 µg vs. 1.2 µg DNA in 5 ml Neurobasal/op-ti-MEM mixture used with Lipofectamine transfections; Ganguly and Roy, 2014), and (2) only neurons showing a fine speckled, discontin-uous pattern of GFP:Utr-CH distribution in dendrites were chosen for imaging (see examples in Fig. S1). Using these criteria (low expres-sion; imaging with high-sensitivity electron-multiplying charge-cou-pled device cameras), only about a third of transfected axons in a coverslip were suitable for imaging. Axonal F-actin dynamics were not seen in high overexpressers, and we found that it was critical to follow the aforementioned guidelines.
Single- and dual-color live imaging of axons and synapses
Live-imaging experiments with GFP:Utr-CH and LifeAct:mTur-quoise-2/GFP were performed using an inverted epifluorescence mi-croscope (Eclipse Ti-E; Nikon) equipped with CFI S Fluor VC 40× oil (NA 1.30; Nikon) and CFI Plan Apochromat VC 100× oil (NA 1.40; Nikon) objectives. An electron-multiplying charge-coupled device cam-era (QuantEM:512SC; Photometrics) and LED illuminator (SPECTRA X; Lumencor) were used for all image acquisition. The system was controlled by Elements software (NIS Elements AR 4.13.00 64 bit; Nikon). Immediately before live imaging, neurons were transferred to a Hibernate-E-Low Fluorescence media (Brainbits, LLC), supplemented with 2% B27, 2 mM GlutaMAX, 0.4% d-glucose, and 37.5 mM NaCl (live imaging media) and maintained between 35.5–37°C (on a heated stage chamber, model STEV; World Precision Instrument, Inc.) for the duration of the experiment. Transfected axons were identified based on morphology using soluble mRFP (which was cotransfected with GFP:Utr-CH), and only neurons with unambiguous morphology, where axons could be confidently identified, were selected for imaging (Roy et al., 2012; Ganguly and Roy, 2014). Utr-CH and LifeAct were typically imaged at 1 frame/s (400-ms exposure, 20% LED power) for 10 min. For dual-color imaging, exciting red/green LED lights were rapidly switched (within microseconds) using the SPECTRA X LED illuminator, achiev-ing near-simultaneous two-color imagachiev-ing. A multi–band-pass filter (Chroma Technology Corp.) was inserted into the emission light path, and GFP/RFP images were obtained with precise subpixel registration. Exposures for both the green and red channels were set at 400 ms (20% LED power). For imaging en passant boutons, 9–12 DIV neurons were cotransfected with synaptophysin:dsRed and GFP:Utr-CH, and boutons were identified based on size of the synaptic vesicle cluster and mor-phology (Wang et al., 2014). Boutons along the primary axon, >150 µm from the soma were selected for imaging. Additionally, axons selected for imaging had at least two or more en passant boutons in proximity. Mi-tochondrial dynamics along the axons was imaged at 3-s intervals (500-ms exposure) for a duration of 5 min as described earlier (Tang et al., 2012, 2013). Synaptophysin and NPYss vesicle dynamics along axons were imaged at 5 frames/s for 1 min. All video files were converted to 16 bit TIFF files in NIS Elements software. Kymographs of these 16 bit TIFF files were generated using the Kymograph function in MetaMorph Image Analysis software (Version 7.7, Molecular Devices, LLC). The brightness/contrast of kymographs was adjusted in MetaMorph (Molec-ular Devices). No other adjustments were made to any images unless otherwise mentioned. EGFP, mCherry, mRFP, dsRed, and mTurquoise fluorochromes were used for all live-imaging experiments.
Pharmacologic experiments, pHRodo use, phalloidin staining, and immunohistochemistry
All chemicals were purchased from Sigma-Aldrich unless noted other-wise. Effects of all pharmacologic experiments (latrunculin,
on July 27, 2015
jcb.rupress.org
Downloaded from
olide, cytochalasin-D, nocodazole, vincristine, SMIFH2, CK666, and BFA) were evaluated before/after drug addition, in a paired manner. Latrunculin A (Life Technologies) was stored as a 5-mM stock solution in DMSO and diluted to a final concentration of 100 nM in live imag-ing media. For washout experiments, culture dishes were rinsed (3×) with fresh live imaging media before imaging. Jasplakinolide (Life Technologies) was stored as a 1-mM stock in DMSO and diluted to a final concentration of 100 nM in live imaging media. To measure the distance between F-actin hotspots, neurons were transfected with GF-P:Utr-CH and treated with 100 nM jasplakinolide for 15 min, leading to conversion of dynamic F-actin hotspots to static vertical lines in kymo-graphs (Fig. 4 B), allowing easy quantification. Cytochalasin-D (1 mM stock) was diluted to a final concentration of 100 nM in live imaging media. The formin inhibitor SMIFH2 (Tocris Bioscience) was stored at 30 mM in DMSO and diluted to a final concentration of 30 µM in imaging media. Arp2/3 inhibitor CK-666 (EMD Millipore) was stored at 100 mM in DMSO, diluted to a final concentration of 50 µM. Noco-dazole was stored as a 5-mg/ml stock solution in DMSO and diluted to a final concentration of 10 µg/ml. Vincristine sulfate was stored as a 5-mM stock in DMSO and diluted to 5 µM in imaging media. BFA was stored as a 5-mg/ml stock solution in ethanol at −20°C and diluted in imaging media to a final concentration of 1 µg/ml. Neurons were incubated for 12–16 h with BFA before imaging, and ethanol was used as controls in all BFA experiments.
Transferrin receptor–conjugated pHRodo (a pH-sensitive marker that is weakly fluorescent at neutral pH but increases fluorescence upon a drop in pH; P35376; Life Technologies) was used at a working con-centration of 25 µg/ml in imaging media. Neurons were incubated with pHRodo for ≥30 min before imaging. Strikingly, pHRodo largely la-beled the stationary endosomes in axons—with scant labeling of the motile population—and this feature was useful in our experiments. For phalloidin staining, neurons were fixed for 10 min with 4% paraformal-dehyde in cytoskeleton buffer (10 mM MES, pH 7.4, 150 mM NaCl, 5 mM EGTA, 5 mM glucose, and 5 mM MgCl2) at RT. Extraction was
performed in PBS containing 0.2% Triton X-100 for 10 min at RT. After this, neurons were blocked in 1% bovine serum albumin and 5% FBS for 2 h at RT. Subsequently, neurons were incubated with 0.5 µm rhodamine-phalloidin (R415; Life Technologies) in PBS for 1 h at RT, rinsed 2–3 times in PBS, and imaged. For immunostaining with βIII-Tubulin, neurons were fixed in 4% paraformaldehyde/sucrose solu-tion in PBS for 10 min at RT, extracted in PBS containing 0.2% Triton X-100 for 10 min (at RT), blocked for 2 h at RT in 1% bovine serum albumin and 5% FBS, and incubated with 1:500 anti–βIII-Tubulin an-tibody (rabbit polyclonal) diluted in PBS for 2 h at RT. After removal of primary antibody, neurons were blocked for 30 min at RT, incubated with goat anti–rabbit secondary antibody (A-11037; Alexa Fluor 594) at 1:1,500 dilution for 1 h at RT and then mounted for imaging. 3D STORM imaging
Rat hippocampal neurons (14–16 DIV, from embryonic day 18 pups) were cultured on 18-mm coverslips at a density of 6,000/cm2,
fol-lowing guidelines established by the European Animal Care and Use Committee (86/609/CEE) and approval of the local ethics committee (agreement D13-055-8). To identify axon initial segments, neurons were labeled live with an antibody against an extracellular epitope of neurofascin-186 (monoclonal mouse anti-NF186 clone A12/18; Neu-roMAB; Schafer et al., 2009). The antibody was added to the culture medium and incubated at 37°C and 5% CO2 for 7 min and rinsed twice
with Neurobasal at RT. Neurons were then fixed with 0.3% glutaral-dehyde and 0.25% Triton X-100 in cytoskeleton buffer, as described previously (Xu et al., 2013). After rinses in 0.1 M phosphate buffer, neurons were blocked for 30 min at RT in immunocytochemistry
buf-fer (0.22% gelatin and 0.1% Triton X-100 in phosphate bufbuf-fer). After this, neurons were incubated with phalloidin–Alexa Fluor 647 (0.5 µM; Life Technologies) and Alexa Fluor 488 donkey anti–mouse second-ary antibody overnight at 4°C. After two quick rinses in immunocyto-chemistry buffer, neurons mounted in a live-cell imaging chamber and subjected to STORM to imaging.
Coverslips were placed in STORM buffer (50 mM Tris, pH 8, 10 mM NaCl, 10% glucose, 100 mM mercaptoethylamine, 3.5 U/ml pyranose oxidase, 40 µg/ml catalase, and 2 mM cyclooctatriene) and imaged on a microscope (N-STORM; Nikon) equipped with a camera (Ixon DU-897; Andor Technology). For some experiments, 0.25 µM phalloidin was added in the STORM medium to mitigate progressive unbinding from actin filaments during imaging. After locating a suitable neuron using low-intensity illumination, epifluorescence images were acquired in both the green and far-red channels, following the axon up to ∼120 µm from the cell body. For single-color imaging, the sample was continuously illuminated at 647 nm (full power) and a series of 60,000–100,000 images (256 × 256 pixels, 15-ms exposure time) were acquired with an astigmatic lens into the optical path to determine the Z position of fluorophores (Huang et al., 2008). The N-STORM software was used for the localization of single fluorophore activations. After fil-tering localizations with more than 900 photons, the list of localizations was exported as a text file. Image reconstructions were performed using the ThunderSTORM ImageJ plugin (National Institutes of Health; Ovesný et al., 2014) in Fiji software (Schindelin et al., 2012). Cus-tom scripts and macros were used to translate localization files from N-STORM to ThunderSTORM formats, as well as automate images reconstruction for whole images, detailed zooms and XZ transverse projections. Measurement of the spacing periodicity was performed by fitting multiple 1-µm axon stretches (n = 111) with a sinusoid, its period corresponding to an individual spacing measurement. The distribution of all spacing values were in turn fitted with a Gaussian curve, and the mean and standard deviation of this Gaussian fit are reported as the spacing measurement in the text.
Image analysis and colocalization algorithms
To analyze GFP:Utr-CH kinetics, lines were drawn using the Meta-Morph Image Analysis Software on the kymograph starting from the origin of appearance of the polymer (actin trail) and ending where the polymer stops elongating. Hotspots were identified by intensity peaks in kymographs from maximum-projection images. To quantify the overlap of F-actin hotspots with stationary endosomes, corresponding kymographs from each axon (GFP:Utr-CH or pHRodo/Rab5/Lamp1) were generated. Vertical lines were drawn manually in MetaMorph onto corresponding kymograph pairs to designate F-actin hotspots (GFP:Utr-CH kymograph) and stationary endosomes (pHRodo/Rab5/ Lamp1 kymograph). Each stationary event had an x value and a range of y values corresponding to the spatial location and the duration of the events, respectively. The x and y values were used as inputs for a cus-tom MATLAB script, written to determine the percentage of overlap between F-actin hotspots and stationary endosomes. Each event in the control (GFP:Utr-CH kymograph) was compared with all events in the condition (pHRodo/Rab5/Lamp1 kymograph) by a double pass overlap test. The y values were first tested and only those events with 50% or more overlap between the control and condition groups were consid-ered for the x overlap analysis. During the x overlap test, x values from the condition which fell within x ± 4 µm of the control were counted as positive. Only events which passed both these criteria were considered as positive. Percentage of overlap was generated using the number of events that overlapped between the control and condition kymographs, over the total number of events in the control kymograph. Because each event in the control was compared with every event in the condition,


![Figure 3. 3D STORM imaging of actin reveals intra-axonal actin bundles. (A and A′) Widefield image of a hippocampal neuron labeled with phalloidin (F-actin) and Neurofascin-186 (NF-186; to label the axon initiation segment [AIS], brackets)](https://thumb-eu.123doks.com/thumbv2/123doknet/14629857.547966/6.918.108.795.87.769/figure-imaging-widefield-hippocampal-phalloidin-neurofascin-initiation-brackets.webp)