HAL Id: hal-00317100
https://hal.archives-ouvertes.fr/hal-00317100
Submitted on 1 Jan 2002
HAL is a multi-disciplinary open access
archive for the deposit and dissemination of
sci-entific research documents, whether they are
pub-lished or not. The documents may come from
teaching and research institutions in France or
abroad, or from public or private research centers.
L’archive ouverte pluridisciplinaire HAL, est
destinée au dépôt et à la diffusion de documents
scientifiques de niveau recherche, publiés ou non,
émanant des établissements d’enseignement et de
recherche français ou étrangers, des laboratoires
publics ou privés.
parallel electric field
B. Hultqvist
To cite this version:
B. Hultqvist. Downward ion acceleration at auroral latitudes: cause of parallel electric field. Annales
Geophysicae, European Geosciences Union, 2002, 20 (8), pp.1117-1136. �hal-00317100�
Swedish Institute of Space Physics Kiruna, Sweden
Received: 11 September 2002 – Revised: 23 January 2002 – Accepted: 21 February 2002
Abstract. Observations with the Freja satellite at about 1700 km altitude of downward accelerated ions in the keV and sub-keV energy range are described and analysed. The observations show the following: (1) Processes involving ve-locity dispersion are not important; (2) Ion pitch-angle dis-tributions are mostly somewhat field aligned but not far from isotropic, so the ions are effectively spread in pitch-angle; (3) As all ion species, H+, O+, and He+, are found to be accelerated to the same energy, the only possible known ac-celeration mechanism is a potential difference along the mag-netic field lines; (4) No significant Birkeland current features are associated with the ion precipitation; (5) Precipitation of energetic electrons from the plasma sheet is always present when the downward accelerated ions are observed; (6) Ion precipitation is generally not seen in regions with primary auroral Birkeland currents associated with electron inverted-V distributions; (7) Precipitated ions are mostly observed at low and medium disturbance levels, but they are also found in strongly disturbed conditions; (8) Downward accelerated ions occur fairly frequently at auroral latitudes near Freja apogee altitudes and are seen at all local times. The present investigation is limited to the nightside.
The above observational results are found to be consis-tent with the physical mechanism for producing a downward-pointing parallel electric field proposed by Hultqvist (1971). That mechanism is basically one of an ambipolar potential difference set up by the energetic electrons from the plasma sheet.
Key words. Magnetospheric physics (electric fields; ener-getic particles, precipitating; magnetosphere – ionosphere in-teractions)
1 Introduction
The disagreement between Sidney Chapman and Hannes Alfv´en in the 1940s and 50s about the existence of
paral-Correspondence to: B. Hultqvist (hultqv@irf.se)
lel electric fields on auroral latitude magnetic field lines was resolved in the 70 s by observations of direct consequences of upward pointing electric fields in space. Parallel electric fields were shown to exist and to be interpretable in terms of the scarcity of current carriers in a limited part of the auroral electric circuit. Current continuation requires that the scarce charges in that region move faster and, therefore, a fraction of the electromotive force of the circuit is transferred to that part of the circuit, and the magnetospheric electrons at medium altitudes are accelerated downward in a potential difference. Chapman’s and his co-workers’ argument, that the high con-ductivity of electrons along the magnetic field lines should eliminate any potential difference along the field lines even for quite low electron densities above the ionosphere, proved not to be applicable in the primary auroral current circuit.
The so-called return current circuit, where the parallel cur-rents (Birkeland curcur-rents) are directed downward, is located next to the primary current circuit. The return current is car-ried mainly by upward moving electrons from the ionosphere and not even Alfv´en foresaw any current continuation prob-lems there, as the ionosphere is a strong source of easily moving electrons. Only very low parallel electric fields, if any, would be required to close the return current above the ionosphere.
When the first satellite of ESRO (the European Space Research Organization), ESRO 1, launched in 1968 into a polar orbit with 1550 km apogee, showed downward ac-celerated ions with keV energies, as reported by Hultqvist et al. (1971), the result was quite unexpected. Hultqvist (1971) suggested that it might be due to temperature and pressure differences between the magnetospheric and iono-spheric plasmas. ESRO 1 provided only very limited data and new relevant data from the altitude region observed by ESRO 1 became available when Freja, with an apogee of 1754 km, started to deliver data in 1992. Dynamics Explorer 2, however, had an orbit reaching 900 km and Winningham et al. (1984) reported observations with a mass resolving in-strument of field-aligned precipitating ions, mainly O+, in the keV and sub-keV energy range, which they interpreted in
Fig. 1. Example of a Color Summary Plot (CSP) for a high-latitude pass of Freja. The satellite orbit is indicated in the circular coordinate
system at the lower right (magnetic local time, MLT, and corrected geomagnetic latitude, CGLAT). The two uppermost frames show the logarithm of the count rate, color-coded as a function of time and the logarithm of the energy of O+and H+ions measured by means of the TICS spectrometer. Frames 3 and 5 may contain some auxiliary data (not used in this investigation) and frames 4 and 6 show electron data from the MATE and TESP instruments, total particle flux in the energy range from a fraction of a keV to about 100 keV in the case of MATE and the count rate, color-coded, of the electrons as a function of time and energy from TESP. UT, MLT, CGLAT, LONG (geographic) and altitude, H, are listed at the bottom. A description of the various recorded count rates and what they represent can be found in the text. The data of particular interest in the present investigation are the relatively intense ion count rates seen in a short period of half a minute at about 08:21 UT.
Fig. 2. A CSP of the higher time resolution type, covering 2 min of time. It shows the period of orbit 3172 in Fig. 1 when precipitating ions
were recorded. This higher time resolution CSP differs from the low time resolution kind shown in Fig. 1 only in that frames 3 and 5 contain pitch-angle data instead of auxiliary information.
ence should be eliminated by the high conductivity of the ionospheric electrons along the field lines thus has been proven not to hold even in the return current regions. Temerin and Carlson (1998) have argued that under certain circum-stances, there may also be a scarcity of current carriers in the return current circuit.
The Swedish-German satellite Freja was equipped with mass-resolving ion spectrometers for the energy range from a few eV to 4.5 keV, covering all directions in half a spin pe-riod (3s), as well as a set of complementary fields and parti-cles instruments (see Lundin et al., 1994). First observations of precipitated ions measured by Freja have been presented by Eliasson et al. (1994a), Norberg et al. (1994), and Eliasson (1996), but most of the studies of the Freja ion data hitherto have dealt with the transverse ion energization at Freja alti-tudes (see e.g. Andr´e et al., 1998).
The electric field experiment on Freja has demonstrated the existence of significant downward-directed parallel elec-tric fields (Marklund et al., 1994, 1997), the existence of which was suggested already on the basis of the ESRO-1 ob-servations by Hultqvist (1971) and later from other satellite observations by Gorney et al. (1985) and others. The FAST satellite, with its apogee slightly above 4000 km and with very high time-resolution instruments, has, as mentioned, shown narrow beams of upward-moving keV electrons and it has facilitated conclusions about microprocesses involved in the production of the potential differences along the mag-netic field lines below 4000 km and in the scattering of the ions in pitch-angle (see e.g. Carlson et al., 1998). While FAST has measured in the whole altitude range of interest here, Freja has provided data only from below or within the region with a downward-pointing parallel electric field.
Downward accelerated ions in the keV and sub-keV en-ergy range are found at all local times. In order to avoid any special cusp effects, the present investigation has been lim-ited to the nightside part of the auroral zone.
2 Observations
The reader is referred to Space Science Reviews, Vol. 70, 1994 for details about the Freja mission and all experiments onboard. The ion spectrometer (TICS) that has delivered the data, which is the basis of the present investigation, is
de-b)
c)
d)
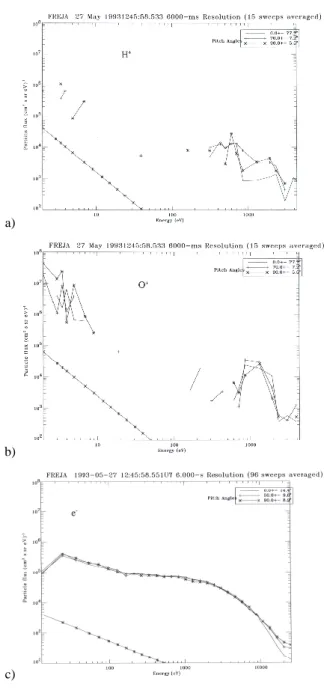
Fig. 3. Energy spectra of H+(a) and (b) and O+(c) ions and of
the precipitating energetic electrons occurring simultaneously (d) in orbit 3172. For H+ions both the count rate and particle flux are shown as a function of energy, as the count rate gives information about the statistical uncertainty of the data points. The straight line shows the 1-count-per-sample-period level.
a) b)
Fig. 4. Pitch-angle distributions of H+(a) and O+ions (b) with an energy of 430 eV observed at the same time in orbit 3172 as the energy spectra in Fig. 3 were measured. As can be seen, the count rates at low pitch-angles are an order of magnitude higher than around 90◦.
Fig. 5. The eastward, Be, and northward, Bn, components of the geomagnetic field observed on board Freja in orbit 3172. The precipitating
ions were measured after 08:21 UT.
scribed by Eliasson et al. (1994b). It had an energy range from below 1 eV to 4.5 keV, an energy resolution of about 10%, and a mass range from 1 to 40 amu/q. An energy sweep with 32 energy steps was normally made in 400 ms. There were 30 angular sectors and all directions were cov-ered in half a spin period (3s), and the normal data rate was 20 kbit/s. All Freja observations of ions and electrons were summarized in the format of “Color Summary Plots” (CSP). Those plots were produced for all satellite orbits from the recordings of 2 out of the 30 angular sectors of the ion spec-trometers and from data taken by the two electron spectrom-eters. The CSPs have two different time scales, one for a whole high-latitude pass (25–30 min), as recorded by one of the two receiving stations, Esrange in Sweden and Prince Al-bert in Canada, and another with a higher time resolution, covering two minutes of measurements.
The observations are presented in a number of subsec-tions. In Sect. 2.1, energy spectra, pitch-angle distributions and temporal relations of different ion species are illustrated. In Sect. 2.2, the temporal/spatial relations of ion and elec-tron precipitation are illustrated and discussed. Section 2.3 shows examples of variations in ion energy with latitude and Sects. 2.4 and 2.5 present examples of the dependence of ion precipitation on energy spectrum and flux of
precipitat-ing electrons. Relations of ion precipitation to ion conics are shown in Sect. 2.6 and the dependence of ion precipitation on magnetospheric disturbance level is illustrated in Sect. 2.7. Finally, some conclusions from the data presented earlier are collected in the final Sect. 2.8.
2.1 Examples illustrating energy spectra, pitch-angle distri-butions, and temporal relations of different ion species Figure 1 shows an example of CSP covering a whole pas-sage within the reach of Prince Albert, which will first be de-scribed in some detail. The pass reaches from equatorward of the radiation belt in the early evening to the low-latitude edge of the radiation belt in the early morning. The orbit is indicated in the circular coordinate system at the lower right (magnetic local time, MLT, and corrected geomagnetic lat-itude, CGLAT). The two uppermost frames show the count rates of O+and H+ ions in logarithmic color-coded scales, as recorded by the TICS ion spectrometer. The He data are contaminated by some cross-talk from the other ion channels and are not included in the figures. The O+channel also con-tains N+ions, if there are any. The narrow frames 3 and 5 may contain special information, which will not be referred to in this study. Frame 4 gives the electron flux integrated
Fig. 6. A full-pass CSP for orbit 3082, covering MLT from midnight to 07:00 and CGLAT 67–42◦. In the ion precipitation region there are mostly higher peak count rates of O+ions than of H+.
Fig. 7. A 2-min CSP for orbit 3082 showing generally more narrow energy spectra for O+ions than for H+.
over all energies (from a fraction of a keV to 100 keV), as recorded by the MATE instrument, and frame 6 presents in color-coded form the measurements (count rates) of the elec-tron spectrometer TESP. At the bottom universal time (UT), magnetic local time (MLT), corrected geomagnetic latitude (CGLAT), geographic longitude (LONG), and altitude (H) are shown.
The energetic particles in the radiation belts produce high count rates in both TICS and MATE so the interesting part of the record in Fig. 1, and similarly in other Freja passes shown, is from a couple of minutes after the passage of the
radiation belt in a northward direction to a couple of minutes before entering the radiation belt in a southward direction. In Fig. 1, Freja entered the auroral zone at about 08:05 UT and passed into the polar cap at 08:09 UT. It reentered the auroral zone about 08:18 UT and left it again at 08:23 UT. In the auroral regions, a flux of precipitating electrons from the plasma sheet with energies reaching the upper limit of the TESP spectrometer can be seen. Superimposed on this are more intense temporary electron fluxes in the keV and sub-keV energy range. Over the polar cap there is a low flux of electrons with energies below a few hundred eV (polar rain).
a)
b)
c)
Fig. 8. Detailed energy spectra measured in orbit 3082 of
precipi-tated H+ions (a) and O+ions (b) and of the precipitated electrons
(c). Straight lines show 1-count level.
The count rates of the ion species in the uppermost frames at energies less than 10 eV are due to the speed of the satel-lite through the cold plasma (ram effect). In the uppermost part of the energy-range of TICS, a weak flux of ions, pri-marily H+, can be seen within the auroral region, coinciding closely in location with the electrons. These count rates are due to the precipitation of plasma sheet ions, found to occur together with electron precipitation already in the ESRO 1 data (see e.g. Hultqvist, 1979). Most of the plasma sheet ions have energies above the upper energy limit of the Freja instrument, but ions from the plasma sheet, visible as a weak background flux at high energies, appears in most of the ion
energy spectrograms. Over the polar cap the noise level of the TICS instrument is illustrated (above 10 eV).
The part of Fig. 1 of particular interest for the present in-vestigation is that between 08:21 and 08:22 UT, where the figure shows relatively intense fluxes of ions of all three species with energies between 100 and 1000 eV. Those data are shown in higher time resolution in Fig. 2, which is an example of two-minute CSPs. In addition to the higher time resolution, the two-minute CSPs differ from the full passage CSPs in that frames 3 and 5 contain pitch-angle information instead of auxiliary information. Already from the summary plot in Fig. 2, it is obvious that the different ion species have similar energies and, in this case, also similar fluxes. It is also obvious from Fig. 2 that the ion species occur simultaneously and that, thus, no velocity dispersion is involved.
That the energy spectra of the H+and O+ions are quite
similar is shown in a more quantitative way in Fig. 3. In Fig. 3a, the H+count rate, as a function of energy, is shown
in order to also illustrate the statistical uncertainty of the data. The count rates of the ions in the energy range 100–1000 eV are one to two orders of magnitude above the one-count-per-sample level shown by the straight line. The statistical un-certainty is thus 30–10%. The count rates below 10 eV are due to the ram effect, as mentioned before. The ram effect is in this case higher for O+than for H+. This is the most common situation and is due to the composition of the cold plasma along the satellite orbit.
Figures 3b and c show the energy spectra of the H+ and O+ion fluxes, respectively. The lowest pitch-angle window in the figures is quite wide because there were few counts at low pitch-angles and the counts are integrated in pitch-angle until a minimum number of counts has been obtained. Both spectra cover the broad range of about 100 to 1000 eV. Above 1 keV, the ion fluxes are two orders of magnitude less and below 70 eV there are no counts at all until the ram-effect counts are seen from about 10 eV downward. That the ion energy spectrum does not reach zero (or very low) energy is a general characteristic of the acceleration process.
Figure 2 and all similar figures in this report clearly in-dicate that no ions are moving upward along the field lines and that the pitch-angle distribution has its maximum in the downward direction. Examples of pitch-angle distributions are shown in Figs. 4a and b. Field-aligned anisotropies of the type ESRO 1 observed in the sixties (Hultqvist et al., 1971) are thus not difficult to find in the Freja data. It is obvious that the ions are accelerated downward along the field lines. Sam-pled over longer periods of time, such as a full spin period of 6 s, the anisotropy of the pitch-angle distribution over the downward half-sphere generally decreases, but the peak is still found mostly at fairly low pitch-angles. The wide range of energies in the spectra, as well as the wide distributions in pitch-angle thus indicate that scattering processes strongly affect the precipitating ions.
The electron energy spectrum observed simultaneously with the ion spectra in Figs. 3a–c is shown in Fig. 3d. Whereas the ion spectra are limited to the range 0.1–1 keV, the electron spectra cover the range 10 eV to more than
Fig. 9. An example in orbit 3093 of quite narrow energy spectra for the heavier ions and very low fluxes of H+ ions spread over a wide energy range.
Fig. 10. A measured detailed energy distribution of the count rate
for O+ ions obtained in the period represented in Fig. 9. The straight line is the 1-count level.
20 keV. The practically identical spectra for pitch-angles 0◦, 50◦, and 90◦demonstrate that the precipitated electrons are isotropic over the downward hemisphere, all in good agree-ment with what is known of electrons from the central plasma sheet. The total precipitated electron flux, integrated over en-ergy and pitch-angle, amounts to about 3×10⁸(cm2s)−1and the precipitated energy flux to 10 × 108keV (cm2s)−1. For
the H+ions the corresponding values are 0.8 × 10⁸(cm2s)−1
and 0.4 × 10⁸keV (cm2s)−1.
The ion precipitation is generally located in the return cur-rent region and is not associated with any strong Birkeland current features, as demonstrated by the magnetic field mea-surements on Freja shown in Fig. 5. The ion precipitation is found between 08:21 and 08:22 but the strong currents occur before that time interval in Fig. 5 together with intensified electron fluxes.
Whereas the downward accelerated ions in Figs. 1 and 2
were found in some 30 s of the satellite pass, such ions were observed during at least 5 min in the pass shown in Figs. 6 and 7. There are even passes where downward accelerated ions in the keV and sub-keV energy range were observed during most of the pass through the auroral regions, as will be shown later. In contrast to the first example discussed, Fig. 7 demonstrates that the energy spectra of the different ion species may be quite different and may vary strongly along the satellite orbit. Most of the time, the oxygen ion spectrum indicated in Fig. 7 is narrower than in Fig. 2, but the hydrogen ion spectrum is wider. This is illustrated in a more quantitative way in Fig. 8, where Fig. 8a shows that the H+ spectrum covers the energy range from a few hundred eV to more than 2 keV, and Fig. 8b shows that the O+ spec-trum is limited to the range 600 eV to 2 keV and much more peaked than the H+ spectrum. Whereas the upper energy
limits in Figs. 8a and b are similar (possibly somewhat higher for H+), the H+ ions appear to have been more affected by stronger “scattering effects” resulting in reduced energy, than the O+ions have been. In Fig. 8c, the electron energy spec-trum observed at the same time is shown. The flux at higher energies is higher than in Fig. 3d, but otherwise the shape is quite similar.
A third example of a pass with precipitated ions is shown in Fig. 9. It is different from the previous two in that the flux of the heavy ions is much larger than that of H+. The energy spectrum of the O+ions is even narrower than in the previous case, as demonstrated in Fig. 10.
2.2 Temporal/spatial relations between ion precipitation and electron precipitation
Figures 1 and 6 represent two cases with very large differ-ences in the temporal/spatial extension of the keV ion pre-cipitation. Figure 11 shows an example where downward accelerated ions are found practically along the whole part of the passage through the auroral oval where electron
pre-Fig. 11. A full-pass CSP showing the
occurrence of precipitated ions in the keV energy range in most of the pas-sage through the auroral regions.
Fig. 12. A full-pass CSP illustrating
that when the precipitated electrons dis-appear (03:31–03:34:30 UT) the precip-itated ions also disappear.
cipitation occurs. The gaps in the ion precipitation coincide with decreases in electron precipitation flux. Figure 12 is another example where regions with downward accelerated ions and electron precipitation coincide very closely. In this case, there is a distinct gap in the precipitation of electrons around midnight (MLT), with very sharp boundaries and in that gap, no ions are observed. Here the satellite most prob-ably entered the polar cap. The boundaries of the gap in ion precipitation coincide closely with those for the electrons.
These two examples, as in all the previous ones, demon-strate that downward accelerated ions in the keV and sub-keV energy range occur where electrons from the plasma sheet are precipitated into the atmosphere. Checks of several hundred cases of ion precipitation have not shown a single case where downward ion acceleration has occurred without the presence of electron precipitation.
2.3 Variation of ion energy with latitude
Any systematic variation of the energy spectrum of the down-ward accelerated ions with latitude may give information about the acceleration process (see e.g. Winningham et al., 1984). Even though Freja’s orbits are mostly fairly tangential to the auroral oval, the latitudinal variations are frequently large enough for studies of the dependence of particle energy on latitude. An investigation of some 50 cases has, however, shown no systematic latitude dependence. Almost no signif-icant energy variation with latitude is observed. Figure 13 shows a case where the energy of the precipitated ions de-creases with increasing CGLAT without any major changes in the electron spectrum. The peak energy decreases from 4 keV to a few hundred eV over a latitude range of half a de-gree. Figure 14, on the other hand, shows a case where the peak energy of the precipitated ions increases with increas-ing latitude, from approximately 300 eV to about 1.5 keV
Fig. 13. A full pass CSP showing
pre-cipitated ions with decreasing energy from 01:03:30 UT to 01:05:30 UT.
Fig. 14. A 2-min CSP showing
increas-ing energy of precipitatincreas-ing ions in the period 11:59:20–12:00:00 UT.
over the latitude range 62.8◦ to 64.5◦. Cases can also be
found where the ion peak energy both decreases and in-creases within periods of less than a minute with the lati-tude varying only little. In summary, no systematic variation in the precipitated ion energy with latitude has been found in these Freja data. Figure 14 shows certain changes in the flux and energy spectrum of the precipitated electrons simul-taneously with the variations in the ions. We shall see in the next subsection that variations in the electrons are more likely than latitude changes to be associated with the varia-tions in ions.
2.4 Relations of variations in the ion energy spectrum to variations in the electron spectrum
At the low-latitude edge of the region with precipitating plasma sheet particles, downward accelerated ions within a limited energy range of tens of eV are sometimes seen.
Within a fraction of a latitude degree from the edge, the ions achieve more normal energies of the order of several hun-dreds of eV up into the keV range. An example is shown in Fig. 15. Around 00:28:10 UT, all ion species have ener-gies below 100 eV, reaching down to 10 eV. Figure 16a con-tains the H+ ion spectrum at 00:28:07 UT with high fluxes between 10 and 700 eV. Figure 16b illustrates the energy spectrum of the precipitating electrons recorded at the same time. Both the electron flux and the upper energy limit are quite low compared with the situation found 35 s earlier (see Figs. 17a and b) when the precipitated H+ions were in the energy range 200 eV–2 keV and the electrons had much higher fluxes and reached 10 keV in energy. (The integration in pitch-angle was done over all directions this time.)
But the energy spectrum of the plasma sheet electrons does not always soften at the low-latitude edge of the precipitation region; sometimes it hardens instead. Figure 18 illustrates such a case. At 03:41 UT, the upper energy limit of
precip-Fig. 15. A 2-min CSP showing
precipi-tating ions with strongly decreasing en-ergy (00:27:30–00:28:12 UT).
a)
b)
Fig. 16. Measured energy spectra of H+ions (a) and energetic elec-trons (b) when the ion energy was very low as shown in Fig. 15. The straight lines show the 1-count levels.
itated electrons shown in the figure starts to increase from about half a keV and reaches some 5 keV one minute later. In fact, the electron spectrum reached 5 keV at 03:41 UT, as shown by Fig. 19b and 10 keV at 03:42 UT (Fig. 20b). In the
a)
b)
Fig. 17. Measured energy spectra of H+ions (a) and electrons (b) before the ion energy started to decrease in Fig. 15.
same period, the H+ions increased strongly in energy, as il-lustrated by Figs. 19a and 20a. At 03:42:25 UT the energy spectrum surpassed the upper energy limit of the ion spec-trometer (4.5 keV). (Results are given in counts in order to illustrate the level of statistical uncertainty.)
Fig. 18. Full-pass CSP showing in-creasing H+ energy starting at about 03:41 UT. In the same period the en-ergies of the precipitating electrons in-crease strongly.
a)
b)
Fig. 19. Measured energy spectrum of H+ions (count rate) (a) and energetic electrons (differential particle flux) (b) before the energy started to increase in Fig. 18. Straight lines show 1-count levels.
This example, like the previous one, thus demonstrates that the energy of the downward accelerated ions fre-quently increases with increasing energy in the precipitated plasma-sheet electrons; but this is not always the case. In
a)
b)
Fig. 20. Measured energy spectra of H+ions (count rate) (a) and energetic electrons (differential particle flux) (b) when the ion ener-gies reached the upper energy limit of the spectrometer in Fig. 18. Straight lines show 1-count levels.
Fig. 21, a sudden energy increase in the electron spectrum at 21:05:35 UT is associated with a strong energy decrease in the ion spectrum. The lower energy limit of the ions decreased from about one keV at 21:05:30 to 50 eV at
Fig. 21. A 2-min CSP showing a strong
increase in electron energy at about 21:05:35 UT which is accompanied by a decrease in the energy of precipitated H+ions and an increase in the ion flux.
a)
b)
Fig. 22. Measured energy spectra of H+ions (a) and electrons (b) before the increase in electron energy in Fig. 21. Straight lines show 1-count levels.
21:05:40 UT, according to Fig. 21. Figures 22 and 23 show the measured energy distributions of ions and electrons be-fore (at 21:05:19 UT) and in the middle of the spectral-change period (21:05:37 UT), respectively. The hard ions in Fig. 22a occur together with electrons reaching about 5 keV
a)
b)
Fig. 23. Measured energy spectra of H+ions (a) and electrons (b) near the time of peaking electron energies in Fig. 21. Straight lines show 1-count levels.
(Fig. 22b), whereas the soft ions in Fig. 23a are associated with electrons reaching several tens of keV in energy.
That the energy spectrum of the electrons alone does not control the energy of the precipitated ions is also illus-trated by Fig. 24. In Fig. 24a, accelerated ions are clearly
b)
Fig. 24. Precipitating ions occur (almost only) in a period when the electron energy spectrum is like an un-accelerated typical plasma sheet
spectrum in (a). In (b) the only major gap in the H+ion precipitation coincides with a period with such a plasma-sheet electron spectrum.
visible almost only in the period between 10:11:30 UT and 10:12:30 UT, when the electron spectrum consists typ-ically of undisturbed, fairly hard plasma-sheet electrons. In Fig. 24b, on the other hand, a period with the same kind of electron spectrum (11:05–11:06 UT) coincides with the most prominent gap in ion precipitation during the whole pass.
A matter of particular interest fitting under the title of this subsection is the relationship between ion precipitation and the special form of electron energy spectra called inverted V. It will be dealt with in a separate subsection.
2.5 Relations between downward accelerated ions and in-verted Vs
As has been demonstrated above, energetic electrons pre-cipitating from the plasma sheet is a necessary requirement for the occurrence of ions accelerated downward with en-ergies in the keV and sub-keV range. On the other hand, the occurrence of downward accelerated energetic electrons with peaked spectra of the so-called inverted-V kind, asso-ciated with discrete auroras, almost eliminates ion precipi-tation completely, or at least it reduces the ion fluxes quite considerably. Examples with inverted-V electrons are shown
a)
b)
Fig. 25. Illustrations of relationships of ion precipitation to intense precipitation of electrons with energy spectra of inverted-V type. In (a)
is shown an intense inverted-V event with no coinciding precipitating ions but with strong ion precipitation next to it. In (b) weak fluxes of precipitating H+ions are observed during the whole period with inverted Vs and the ion energy is higher in the inverted Vs than outside.
in Figs. 25a and b.
The large extension of the inverted-V structure along the satellite orbit, especially in Figs. 25a, is due to the low angle between the auroral form and the orbit. In Fig. 25a, the re-gion with inverted-V electrons showing up as spectra with the count rate peaking near maximum energy (02:10:42– 02:11:15 UT) is associated with a gap in the ion flux. In Fig. 25b, there are relatively strong fluxes of downward ac-celerated ions both before and after the period with inverted-V precipitation (23:28:17–23:29:05 UT), but there are also lower ion fluxes, with higher energies than outside, through
the entire inverted-V region. It is not easy to find events with ion precipitation clearly detectable within inverted-V regions. The most common situation is that no significant ion fluxes can be observed in such regions, as has been noted earlier by Eliasson et al. (1994a).
2.6 Relationships between downward accelerated ions and ion conics
In none of the many examples of ion precipitation shown hitherto has strong perpendicular acceleration of ions
pro-b)
Fig. 26. Examples of relations of precipitated ions to ion conics. In (a) ions are precipitated next to conics but not in them. In (b) ion
precipitation occurs both before the conics and together with the conics. The precipitated ion fluxes are lower in the conics region and their energy spectra appear to be wider there.
ducing ion conics been evident. Figure 26 illustrates some common relationships between the occurrence of downward accelerated ions and ion conics as observed by Freja.
In many situations with strong conics at altitudes in the region close to the Freja apogee (1770 km), no precipitating ions are present at all. In Fig. 26a, a narrow region in the midnight sector contains precipitated ions in the low-latitude part and conics in the high-latitude part. In the example from the dawn sector illustrated in Fig. 26b, there are precipitating ions poleward of a region with intense conics and the precip-itated ions are also present in the region with conics but the
flux is reduced and the H+energy spectrum is broader there
than outside. No narrow ion spectra, such as those shown in Figs. 7 and 9, have been observed in some ten events with conics analyzed.
In conclusion, all sorts of relationships with conics are found, from total absence of precipitated ions to the occur-rence of precipitated ions, almost as if there were no conics. Reduction of flux and broadening of energy spectrum of the precipitating ions seem, however, to be common characteris-tics of regions with conics observed by Freja.
a)
b)
c)
Fig. 27. Numbers of ion precipitation events as functions of various
indices of magnetospheric disturbance level (a) as a function of Kp;
(a) as a function of Dst; (b) as a function of AL.
2.7 Relationships of ion precipitation to the magneto-spheric disturbance level
As can be seen in many of the examples shown above, down-ward accelerated ions in the keV and sub-keV energy range are frequently observed when the precipitating electrons have typical plasma-sheet spectra and show no signs of accel-eration. The inverted-V type of electron spectrum, typical of disturbed magnetospheric conditions with discrete auro-ral forms, has even been found to be strongly anti-correlated
a)
b)
c)
Fig. 28. Distributions of index values over the same index value
ranges as in Fig. 27. The index values analysed are those for the months of May and September 1993, which were the first and the last months, respectively, of the period in which the ion precipita-tion events in Fig. 27 occurred. (a) Distribuprecipita-tion of Kpvalue; (b)
Distribution of Dst values; (a) Disribution of AL values.
with the occurrence of ion precipitation. Therefore, these observations give us a reason to expect that ion precipitation occurs mainly at low magnetospheric disturbance levels.
An investigation of 61 ion precipitation events, selected unsystematically in the data base only on the basis that they were easily detectable in the color summary plots, gave the distributions with Kp, Dst , and AL shown in Fig. 27. Three
tion than AL. Neither the AL nor the Dst diagram indi-cates an important substorm dependence. On the other hand, downward accelerated ions are also found at fairly high dis-turbance levels.
From the diagrams in Fig. 27 we can only conclude that there is no strong correlation between disturbance level and ion acceleration. In order to be able to judge if the downward ion acceleration depends on the disturbance level without be-ing strongly correlated, we need to know how the occurrence frequency of various index values varies with the values. If there is no dependence at all of the occurrence probability of downward accelerated ions on the disturbance level, then the distributions of the ion occurrence rates and of the index values would be the same.
The number of cases with a given index value was found in the index tables for May and September of 1993 (which were the first and last months, respectively, of the period in which practically all of the 61 events with ion precipitation analysed in Fig. 27 occurred) is shown in the diagrams of Figs. 28a–c. A comparison of the corresponding diagrams shows that the distributions of the occurrence of accelerated ions are at somewhat higher index values than the distribu-tions of the index values, except at the highest values. Thus, the occurrence frequency of ion acceleration increases some-what with increasing disturbance level in the main parts of the distributions.
2.8 Summary of observational results
Here the observational results reported above, which are of particular interest for the interpretation of the observations discussed in Sect. 3, will be briefly summarized.
– All observed ion species are accelerated downward roughly to the same energy (when several ion species are precipitated).
– Accelerated H+ ions occur most frequently, but some-times the O+count rate is higher than the H+one. Oc-casionally, O+ions but no H+ions are found.
– The ion pitch-angle distributions peak mostly in the downward direction of the field lines but are still not far from isotropic over the downward hemisphere.
– The region along a satellite pass through the auro-ral zone showing downward accelerated ions may vary from zero length to a large fraction of the pass.
– No systematic variation of the precipitated ion energy with latitude has been found.
– The energy of the precipitated ions sometimes co-varies with the electron energy, but there are also cases with contra-variation.
– Downward accelerated ions are generally not found when the precipitated electrons show energy spectra of the inverted-V type. Occasionally, low ion fluxes (with higher energies than outside) are present within the in-verted V.
– Downward accelerated ions may or may not be present in regions where ion conics are observed by Freja. The ion flux tends to be lower in the conics region than out-side, and the ion energy spectrum is generally strongly affected by scattering (wider) there.
– The regions with ion precipitation are generally found in the return current region and are not associated with any strong Birkeland current features in the magnetic field records taken by Freja.
– Occurrence of downward accelerated ions in the keV and sub-keV energy range is not strongly correlated with the magnetospheric disturbance level.
In the remainder of this report the interpretation of these observational results will be discussed.
3 Discussion
3.1 Acceleration mechanisms
A potential drop along the magnetic field lines seems to be the only possible known cause of accelerating all (singly charged) ion species to the same energies, as shown to be the case in Figs. 2 and 3, as well as in all other relevant ex-amples presented above. The very narrow energy spectra sometimes observed, especially for O+ ions (e.g. Fig. 10),
also support such an acceleration mechanism, as do the field-aligned pitch-angle distributions (Fig. 4).
On the other hand, the downward accelerated ions are cer-tainly not beam-shaped, which could well be expected if there were no scattering at altitudes near the Freja apogeum (1750 km) for acceleration regions at a few thousand kilome-ters altitude indicated by FAST data (see e.g. Carlson et al., 1998). The pitch-angle distributions are frequently close to isotropic and the energy spectra are often quite wide, gener-ally wider for H+ than for O+ ions (see Fig. 7), with both
circumstances indicating that scattering processes play im-portant roles besides the potential drop along the magnetic field lines. That different ion species have about the same up-per energy limit eliminates the possibility that the observed energy spread is due to energetic ions with wide energy spec-tra entering the potential region and being further accelerated there.
The observation that the downward accelerated ions often show a lower flux and a wider energy spectrum within re-gions with ion conics than outside (see Fig. 26b) suggests that waves accelerating the ions in the perpendicular direction are important contributors to the scattering of pitch-angle and ergy. Observations demonstrate that the widening of the en-ergy spectrum practically only leads to lower energies. Simi-lar widening of ion energy spectra has also been recorded by the Swedish micro-satellite Munin. Ergun et al. (1998) have discussed the effects on ions of micro processes observed by FAST around 4000 km altitude in regions with upward-moving electron beams and have concluded that ions undergo substantial perpendicular heating and give parallel momen-tum to electrons, which seems to be consistent with the re-sults discussed above.
The observed fact that the energy spectrum of the accel-erated ions is limited both upward and downward in en-ergy shows that the accelerated ions are of ionospheric origin (cold) and that practically all cold ions to be accelerated en-ter the acceleration region from the top, with entrance from the side along the whole height range of the parallel elec-tric field being insignificant. The scattering processes, which strongly modify the effects of the parallel electric field, may be located both within and below the region with the poten-tial difference, all the way down to the satellite.
The composition of the precipitating ions depends on the cold ion composition in the source region near the top of the potential distribution. The observed variations of the compo-sition are consistent with other observations of ion composi-tion above the so-called crossover level from O+dominance
below to H+ dominance above. How many O+ ions there are above this level depends on the speed with which the O+ ions move through it (Moore, 1980). That speed is corre-lated with the magnetospheric disturbance level and as the altitude of the crossover level varies in somewhat unknown ways, the variations in ion composition recorded by Freja are not inconsistent with existing knowledge. For more informa-tion about the ion composiinforma-tion above the ionosphere see, for example, Chapter 2 in Hultqvist et al. (1999).
3.2 Dependence of ion acceleration on electron precipita-tion
As has been demonstrated above, downward accelerated ions in the keV and sub-keV energy range are observed only in the presence of precipitated electrons, mostly coming from the plasma sheet without acceleration on the way before they interact with the ionosphere. Both the total particle flux and the total energy flux of the precipitated electrons are gener-ally considerably higher than those of the precipitated ions at altitudes near the Freja apogee. Strong variations in the energy of the precipitated ions are frequently associated with considerable variations in the energy of the precipitated elec-trons, most commonly in the same direction for ions and electrons (see Figs. 15–20), but sometimes in opposite direc-tions (Figs. 21–23).
The co-variation of ion and electron energies may indicate that higher energy electrons are associated with a higher po-tential difference along the magnetic field lines. One way of understanding the contra-variation on such a basis is to as-sume that the large energy increase of the electrons occurs together with a transfer of the potential drop downward in altitude, so that only a fraction of it is above the satellite.
The observation of satellite passes without any observ-able downward accelerated ions at all and of other passes where such ions are found along practically the whole pas-sage through the auroral regions, and all alternatives in be-tween, certainly demonstrates that it is not the occurrence of electron precipitation alone that controls the occurrence of ion precipitation. This is also shown by the examples in Figs. 24a and b. The fact that there are generally no, or only very little, downward accelerated ions found in regions of in-tense precipitation of auroral electrons with energy spectra of the inverted-V type (see Figs. 25a and b), further emphasizes that the relationships between ion and electron precipitation are complex.
3.3 Relations of ion precipitation to Birkeland currents As illustrated in Fig. 5, the regions with downward accel-erated ions are generally found in the return current region and are not associated with any major Birkeland current fea-tures. Furthermore, such ions are most commonly observed when the magnetospheric disturbance level is fairly low (see Fig. 27). However, as mentioned earlier, there is some depen-dence on the disturbance level, which is shown by the differ-ences between the corresponding distributions in Figs. 27 and 28. It may be noted that the Dst and AL distributions have longer tails towards higher index values than the ion acceler-ation events. This is in agreement with the earlier observa-tion that there is no strong correlaobserva-tion between disturbance level and occurrence rate of downward accelerated ions, in-dicating rather a low or even negative correlation when the disturbance level is high. The number of acceleration events is, however, too small for firm conclusions to be drawn.
Clearly, the regions with ion precipitation are not part of the primary auroral current circuit, where the inverted-V
3.4 Cause of the potential drop accelerating ions downward As mentioned earlier, Temerin and Carlson (1998) have pro-posed that the accelerating potential difference is caused by the scarcity of current carriers for meeting the current con-tinuity requirement when the current intensity is sufficiently high. If that were the dominating cause of field-aligned ac-celeration, one would expect a positive relationship between ion precipitation and current intensity. But ion precipitation occurs mainly at low and medium disturbance levels when the current intensities are not high, which thus does not sup-port the assumption of the scarcity of current carriers as the cause of acceleration. This does not mean that current con-tinuity requirements may not be important in some circum-stances, as discussed by Temerin and Carlson.
The mechanism proposed by Hultqvist (1971) appears to be consistent with the observations. The basic accelerator in that model is a (quasi) stationary, ambipolar electric field caused by the large difference in speeds of energetic elec-trons and ions in the plasma sheet. The field is of a similar nature as the ambipolar field on top of the ionosphere, which helps produce the polar wind outflow of ionospheric ions. But in the present case, the particles have much higher en-ergies and potential differences in the kV and sub-kV range are produced.
When the temperature distribution along the magnetic field lines is suitable or the ionospheric cold plasma den-sity is low enough (see below), in this process the precipi-tating energetic electrons constitute an upward current in the altitude range of interest until an ambipolar potential differ-ence, large enough to eliminate the upward current, has de-veloped. The region with the ambipolar parallel electric field may then support a (weak) downward current within the re-gion, which is compensated by the continuing precipitation of energetic electrons from the plasma sheet. If, for some reason, such as increased ionospheric density in the region, the downward current increases temporarily, then the poten-tial difference is decreased or eliminated, and a downward electric field develops again only if the inflow of electrons from the plasma sheet again dominates over the outflow of cold electrons. Thermal diffusion, which is included in the Hultqvist (1971) model, may or may not play an important role in producing the potential difference.
side of the loss cone, to mirror at lower altitudes, where the ionospheric electron density is higher, and upward moving cold electrons may eliminate the parallel electric field (see below). This explains why ion precipitation is not seen in electron inverted-V events.
When a parallel electric field has been set up as a result of the large speed difference of electrons and ions from the plasma sheet, so that the current due to the speed difference is eliminated, the downward potential difference can be tained by integration through the transition region. One ob-tains the potential difference expressed in terms of the distri-butions with altitude of plasma temperature, T , and electron density, ne, (see Eq. (4) of Hultqvist, 1971).
Assuming a transition region between the magnetospheric and the ionospheric plasma with an exponential variation of
ne and with model profiles for T of three different kinds,
Hultqvist (1971) showed that the ratio n1/n2of the electron densities on the ionospheric (n1, T1) and magnetospheric (n2, T2) sides of the transition region that eliminates the potential difference can vary very much depending on the plasma temperature variation profile through the transition region. For typical plasma temperatures of 107K on the mag-netospheric side and 103K on the ionospheric side, he found that, for a sinusoidal temperature transition, the electron den-sity has only to be a factor of 15 larger on the ionospheric side to eliminate the potential difference. For an exponential temperature variation, on the other hand, n1/n2has to have a
very high value of 6.2 × 10⁶for the potential difference to be zero. For other distributions n1/n2values, making the poten-tial difference zero, in between the mentioned ones may be found. Lower n1/n2values than those will result in a poten-tial difference accelerating ions downward according to the model.
Therefore, we thus see that the potential difference even with simple models is found to depend strongly on the dis-tributions with altitude of plasma temperature and electron density. Although those distributions along the field lines are unknown in all cases of ion precipitation observed hitherto, the strong T and ne dependence of the potential difference
according to the model is generally consistent with the ob-served, presently unpredictable variations in occurrence of downward accelerated ions.
The Freja observations reported above appear to be in gen-eral agreement with FAST results from around 4000 km
al-titude published by Carlson and other members of the FAST science team. Narrow upward electron beams with keV en-ergies above the potential drop, for instance, are an obvious consequence of the potential difference, as already concluded by Hultqvist (1971). However, the observations of very high fluxes of simultaneous up-going and down-going field-aligned electrons with very broad energy spectra at 4000 km altitude, reported by Carlson et al. (1998), seem not to be consistent with the simple model discussed here. It is likely that the very intense events of upward electron beams close to inverted-V events, discussed mainly by Carlson and col-leagues, have a different cause than the ion precipitation dealt with in this report. On the whole, quantitative comparisons of data from above and below the acceleration region remain to be carried out. Unfortunately, no simultaneous measure-ments above and below exist or are likely to become available in the foreseeable future.
Acknowledgements. The Freja project has been supported by the
Swedish National Space Board and the German Ministry for Re-search and Technology and has been managed and operated by the Swedish Space Corporation under contract with the Swedish Na-tional Space Board. The magnetic field data has been provided by the magnetic field team of Freja, led by L. J. Zanetti at APL, Lau-rel, and the TESP data by M. H. Boehm and co-workers at MPE, Garching, which is gratefully acknowledged. This study has been possible thanks to the successful efforts of the Freja hardware and software teams in Kiruna. I also thank Laila Andersson for the use of her software.
Topical Editor G. Chanteur thanks J. Winningham and P. Jan-hunen for their help in evaluating this paper.
References
Andr´e, M., Norqvist, P., Andersson, L., Eliasson, L., Eriksson, A. I., Blomberg, L., Erlandsson, R.E., Waldemark, J.: Ion energization mechanisms at 1700 km in the auroral region, J. Geophys. Res., 103, 4199, 1998.
Carlson, C. W., McFadden, J. P., Ergun, R. E., Temerin, M., Peria, W., Mozer, F. S., Klumpar, D. M., Shelley, E. G., Peterson, W. K., Moebius, E., Elphic, R., Strangeway, R., Cattell, C., and Pfaff, R.: FAST observations in the down-ward auroral current region: Energetic upgoing electron beams, parallel potential drops and ion heating, Geophys. Res. Lett., 25, 2017, 1998.
Eliasson, L., Andr´e, M., Eriksson, A., Norqvist, P., Norberg, O., Lundin, R., Holback, B., Koskinen, H., Borg, H., and Boehm, M.: Freja observations of heating and precipitation of positive
ions, Geophys. Res. Lett., 21, 1911, 1994a.
Eliasson, L., Norberg, O., Lundin, R., Lundin, K., Olsen, S., Borg, H., Andr´e, M., Koskinen, H., Riihel¨a, P., Boehm, M., and Whalen, B.: The Freja hot plasma experiment - Instrument and first results, Space Sci. Rev., 70, 563, 1994b.
Eliasson, L.: Highlights of the Freja mission, Adv. Space Res., 18, 8, 85–94, 1996.
Ergun , R. E., Carlson, C. W., McFadden, J. P., Mozer, F. S., Muschietti, L., and Roth, I.: Debey-scale plasma structures as-sociated with magnetic field-aligned electric fields, Phys. Rev. Lett., 81, 826, 1998.
Gorney, D., Chiu, Y. T., and Croley, Jr., D. R.: Trapping of ion conics by downward parallel electric fields, J. Geophys. Res., 90, 4205, 1985.
Hultqvist, B.: On the production of a magnetic-field-aligned electric field by the interaction between the hot magnetospheric plasma and the cold ionosphere, Planet. Space Sci., 19, 749, 1971. Hultqvist, B., Borg, H., Riedler, W., and Christophersen, P.:
Ob-servations of magnetic-field-aligned anisotropy for 1 and 6 keV positive ions in the upper ionosphere, Planet. Space Sci., 19, 279, 1971.
Hultqvist, B.: The hot ion component of the magnetospheric plasma and some relations to the electron component - Observations and physical implications, Space Sci. Rev., 23, 581, 1979.
Hultqvist, B., Oieroset, M., Paschmann, G., and Treumann, R.: (Eds) Magnetospheric Plasma Sources and Losses, Volume 6 of Space Science Series of ISSI, Kluwer Academic Publishers, Dor-drecht, also Space Science Rev., 88, 1999.
Lundin, R., Haerendel, G., and Grahn, S.: The Freja project, Geo-phys. Res. Lett., 21, 1823, 1994.
Marklund, G. T.: Viking investigations of auroral electrodynamical parameters, J. Geophys. Res., 98, 1691, 1993.
Marklund, G., Blomberg, L., F¨althammar, C.-G., and Lindqvist, P. A.: On intense diverging electric fields associated with black au-rora, Geophys. Res. Lett., 21, 1859, 1994.
Marklund, G. T., Karlson, T., and Clemmons, J.: On low-altitude particle acceleration and intense electric fields and their relation-ship to black aurora, J. Geophys. Res., 102, 17 509, 1997. Moore, T. E.: Modulation of terrestrial ion escape flux composition,
J. Geophys. Res., 85, 2011, 1980.
Norberg, O., Yamauchi, M., Eliasson, L., and Lundin, R.: Freja observations of multiple injection events in the cusp, Geophys. Res. Lett., 21, 1919, 1994.
Temerin, M. and Carlson, C. W.: Current-voltage relationship in the downward auroral current region, Geophys. Res. Lett., 25, 2365, 1998.
Winningham, J. D., Burch, J. L., and Frahm, R. A.: Bands of ions and angular V’s: A conjugate manifestation of ionospheric ion acceleration, J. Geophys. Res., 89, 1749, 1984.