HAL Id: hal-02944380
https://hal.inrae.fr/hal-02944380
Submitted on 27 Nov 2020HAL is a multi-disciplinary open access archive for the deposit and dissemination of sci-entific research documents, whether they are pub-lished or not. The documents may come from teaching and research institutions in France or abroad, or from public or private research centers.
L’archive ouverte pluridisciplinaire HAL, est destinée au dépôt et à la diffusion de documents scientifiques de niveau recherche, publiés ou non, émanant des établissements d’enseignement et de recherche français ou étrangers, des laboratoires publics ou privés.
Distributed under a Creative Commons Attribution - NonCommercial - NoDerivatives| 4.0 International License
Non thermal plasma in liquid media: Effect on inulin
depolymerization and functionalization
Raluca Nastase, Elodie Fourre, Mathieu Fanuel, Xavier Falourd, Isabelle
Capron
To cite this version:
Raluca Nastase, Elodie Fourre, Mathieu Fanuel, Xavier Falourd, Isabelle Capron. Non thermal plasma in liquid media: Effect on inulin depolymerization and functionalization. Carbohydrate Polymers, Elsevier, 2020, 231, pp.115704. �10.1016/j.carbpol.2019.115704�. �hal-02944380�
Non thermal plasma in liquid media: effect on inulin depolymerization and
1
functionalization
2
Raluca Nastase1,2, Elodie Fourré1, Mathieu Fanuel2, Xavier Falourd2, Isabelle Capron2 3
1
Research unit on catalysis and unconventional media, IC2MP, Poitiers, France
4
2
UR1268 Research unit Biopolymers, interactions and assemblies (BIA), INRA, Nantes, France
5
Corresponding author: [email protected]
6
Keywords 7
Gas-liquid plasma reactor; non thermal plasma; inulin; depolymerization; infrared 8
spectroscopy; ssNMR spectroscopy 9
Highlights 10
A novel double dielectric barrier discharge plasma reactor with a liquid interface has 11
been designed 12
It is possible to totally convert inulin into 100 % fructose and glucose 13
No degradation products are generated 14
Combined analytical results evidenced the acidic attack of the glycosidic bond leading 15
to depolymerization 16
Abstract 17
We report the complete conversion of inulin in gas/liquid media by a dielectric barrier discharge 18
plasma at atmospheric pressure. Depending on the plasma treatment time (from 1 to 30 min) 19
and the chemical nature of the gases (air, oxygen, nitrogen), it was possible to depolymerize 20
inulin into fructo-oligosaccharides with a degree of polymerization inferior to 5 or to achieve a 21
total conversion of inulin into its two monomeric constituents, fructose and glucose in 20 min, 22
without any degradation products. Combined results from liquid chromatography (HPLC), 23
solid state Nuclear Magnetic Resonance (ssNMR) and mass spectroscopy revealed that the 24
breakage of the 1-4-bridged oxygen occurs by an acidic attack, following the oxidation of the 25
polymer. Infrared spectroscopy revealed the oxidation and breakage of the polymer and also 26
adsorption of nitrate species. 27
Introduction 28
Since the industrial revolution, chemistry has developed processes, catalysts and technologies 29
for the conversion of fossil carbon, aiming to create complex and diverse molecules. However, 30
increasing environmental awareness is prompting scientists and manufacturers to develop 31
strategies for environmental sustainability by using processes and materials with low cost, low 32
energy consumption and low toxicity. For several years now, a new approach has been focusing 33
on the use of new raw material from the biomass or waste (Ong et al., 2019; Sheldon, 2018). 34
This change of strategy was revolutionary in the world of chemistry and it has dramatically 35
changed the way a process is designed (Jérôme, Chatel & De Oliveira Vigier, 2016; Farmer & 36
Mascal, 2015; Sylla-Iyarreta Veitía & Ferroud, 2015; Horváth & Anastas, 2007; Baig & Varma, 37
2012; Benoit et al., 2012). For this reason, the use of advanced technologies, such as non-38
thermal plasma, ultrasounds or ball-milling have been extensively investigated (Farmer & 39
Mascal, 2015). Current and future society needs scientists and manufacturers to focus on new 40
strategies and develop low cost processes for sustainable materials, easy to produce and widely 41
available (Jérôme, 2016) 42
The recent extensive use of non-thermal plasma is the result of a range of reaction parameters 43
that cannot be accessible otherwise, or to a lesser extent. No other media can provide gas 44
temperatures or energy densities as high as those of plasmas; no other media can excite atomic 45
and molecular species to radiate as efficiently; no other media can be arranged to provide 46
comparable transient and non-equilibrium conditions (National Research Council, 1991). This 47
technology is safe, versatile, easy to carry out and allows the generation of highly reactive 48
chemical species with low energy consumption, low toxicity and the possibility of continuous 49
processing (Kan, Lam, Chan, & Ng, 2014). 50
The development of atmospheric pressure plasma technologies has dramatically increased in 51
recent years due to their potential impact in a very wide range of applications that include 52
surface treatments (cleaning, etching), surface activation, surface coating (air plasma spray, 53
plasma enhanced chemical vapor deposition) (Tendero, Tixier, Tristant, Desmaison & 54
Leprince, 2006), but also food (decontamination, toxin degradation, packaging), medicine 55
(sterilization, wound healing, skin treatments) and water (pesticide and dyes degradation, 56
decontamination) (Pankaj & Keener, 2017). The technological progress has encouraged the 57
interest and advancement in the understanding of plasmas. The possibility of performing 58
reactions at atmospheric pressure is becoming increasingly attractive and the fundamental and 59
essential role of technological plasmas is set to expand significantly in the coming years 60
0(Mariotti, Patel, Švrček & Maguire, 2012). 61
In this context, production of fructose from fructans such as inulin using plasma, is an 62
alternative to the current approaches, such as acid or enzymatic hydrolysis (Raccuia et al., 63
2016). Inulin is constituted of fructose units connected by β (1-2) linkages with a glucose at its 64
extremity linked in α (1-2) form. In the inulin chain, the fructose is blocked in the furanose form 65
and glucose is in glucopyranose form. Inulin, its derivatives and its two constitutive monomers 66
have received considerable interest as food ingredients (Blecker, Fougnies, Van Herck, 67
Chevalier & Paquot, 2002). Inulin has also been chemically modified in several ways (neutral, 68
anionic, and cationic modification as well as cross-linking and slow release applications) to 69
obtain highly biodegradable compounds at the industrial scale (Stevens, Meriggi & Booten, 70
2001). 71
The effect of non-thermal atmospheric plasma on inulin was already investigated on solid 72
material in gas phase but the reaction mechanism was not completely elucidated [Nastase, 73
Tatibouët & Fourré, 2018; Benoit & al., 2012). The authors reported the depolymerization of 74
inulin with a yield of 16 wt % of fructose (other products being fructo-oligosaccharides (FOS) 75
with a degree of polymerization (DP) lower than 6) via the surrounding water initially contained 76
in polysaccharides that promotes the cleavage of the glycosidic bonds (Benoit &al.). In a recent 77
study (Nastase, Tatibouët & Fourré, 2018), it was suggested that reactive oxidizing species 78
generated by oxygen (ROS) and nitrogen (RNS) played a key role in the depolymerization 79
process, via OH radicals or nitric acid attack. 80
Nowadays, within the field of plasma science and technology, the attention is increasing over 81
the plasma-liquid interactions, and particularly on the physical and chemical mechanisms 82
leading to complex reaction at the plasma-liquid interface (Bruggeman et al, 2016). It is well 83
admitted in the literature that discharges generated at the gas-liquid interface provide gaseous 84
reactive species that can dissolve in the liquid media, inducing the formation of species 85
presenting high reactivity, such as H2O2, NO2- /NO3-, OH•, HOO•/ O2•- to name a few. The
86
fundamental properties of liquid-phase plasma (like generation, state or reactive species) have 87
not been fully described, but the presence of liquid in the system leads to higher reaction rate 88
since the molecular density in the liquid phase is much higher than in the gas phase (Takai, 89
2008). However, plasmas in liquids are more difficult to control and stabilize: the liquid is often 90
an electrode, therefore evaporation and chemical modification occurs, which adds significant 91
complexity compared to the gas phase plasmas (Bruggeman & Leys, 2009). 92
In this respect, a reactor with a double dielectric (DD) barrier, combining a liquid and gas phase 93
DD-LG plasma has been developed. The configuration of the reactor used along this study 94
allows the initiation of various types of reactions: plasma active species formed in the gas and 95
at the gas-liquid interface are further transferred into the liquid giving rise to more chemical 96
reactions. The novelty of this configuration resides in the isolation of the liquid phase between 97
the 2 electrodes, which can avoid problems like electrode evaporation (when using liquid 98
electrode) or contamination from the metal electrode in contact with the liquid. This plasma 99
configuration has been used to follow depolymerization of inulin into FOS, fructose and glucose 100
investigated in controlled conditions in power, time, chemical nature of the gas phase and 101 sample concentration. 102
1. Experimental
103 1.1. Materials 104 105Throughout this study, commercial inulin (from chicory, Sigma Aldrich) was used as a 106
substrate. Inulin was solubilized in ultra-pure water under stirring at room temperature, to 107
obtain a concentration of 8 g.L-1 without further treatment. 108
109
1.2.Gas-liquid plasma device 110
111
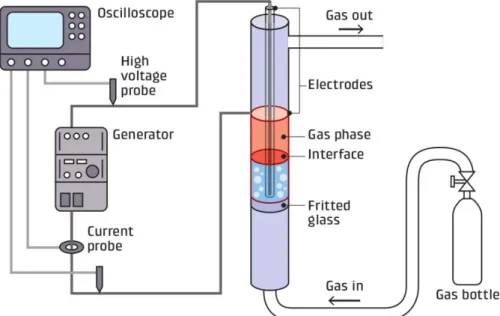
Plasma treatment was carried out in a dielectric barrier discharge reactor consisting in a double 112
wall glass cylinder separated in two parts by a fritted glass (figure 1). This reactor can be 113
classified as multiphase discharge (Bruggeman et al., 2016) except that both electrodes are 114
isolated from the liquid phase by two glass walls. The first electrode (inox tube) stands in the 115
center of the cylinder and was protected from the liquid by a first dielectric wall. The second 116
electrode (copper adhesive tape, from Advance tape) was wrapped around the second dielectric 117
wall, on the outside wall of the cylinder. The gap between both dielectrics was 3 mm. A high 118
voltage supply (A2E Technologies Enertronic), was connected to the electrodes and providing 119
bipolar voltage pulses, allows the variation of the voltage from 0 to 40 kV. The gas (flow of 30 120
mL.min-1)was introduced in the reactor from the bottom entry and was flown through a fritted
121
glass which not only created bubbles, but also prevented the liquid from draining. The volume 122
of the solution to be treated was set at 5 mL, allowing the generation of plasma in the gas phase, 123
right above the surface of the liquid and, in a lesser extent, in the gas bubbles through the liquid. 124
The solution was injected in the system kept at atmospheric pressure, room temperature and 125
with the gas flow set at 30 mL min-1. In order to determine the optimal parameters for inulin
126
conversion, the electrical parameters (voltage, 16-21 kV) and the treatment time (1-40 min) 127
were modified. The discharge was generated under nitrogen, oxygen, helium and air 128
atmosphere 129
130
Figure 1: Drawing of the experimental setup 131
132
1.3.Characterization 133
Hydrogen peroxide content
134 135
Hydrogen peroxide produced during the plasma treatment was calculated from colorimetric 136
titration with potassium permanganate, in acidic conditions. 10 mL of plasma treated sample 137
was placed in a beaker with 20 mL distilled water and 10 mL of H2SO4 solution (3 M). The
138
solution was magnetically stirred and a solution of KMnO4 (0.025 M) was added dropwise
139
through a graduated burette. The concentration was calculated from the equivalent point 140
volume. 141
HPLC
142
High Pressure Liquid Chromatography was used to determine the presence of oligosaccharides 143
after plasma processing. Samples were analyzed on a Shodex Sugar KS-802 column 144
(maintained at 40°C) that allows the separation of oligosaccharides by steric exclusion and 145
ligand exchange. The stationary phase consists of polystyrene-divinylbenzene coated with a 146
cation exchange resin and the mobile phase consists of ultra-pure water at a flow rate of 1 147
mL.min-1. 148
Molecules were eluted depending on their hydrodynamic volume. The concentrations of 149
fructose and glucose were defined for each compound by a calibration curve established with 150
different concentrations (supplementary information), giving the concentration in g.L-1 of the 151
analyzed compound as a function of the area of the chromatographic peaks. 152
Solid state Nuclear Magnetic Resonance
153
Solid state 13C NMR experiments were carried out using a Bruker Avance III 400 MHz
154
spectrometer operating at a 13C frequency of 100.62MHz and equipped with a CP/MAS 4 mm 155
1H/13C probe. Prior to the analysis, the samples were neutralized with a solution of NaOH (0.1
156
M) and lyophilized. The pH was measured with a pHmeter (Eutech instrument pH510). The 157
solid samples were packed in a 4 mm NMR rotor without any other preparation. The sample 158
were spun at a rate of 9 kHz at room temperature. The cross polarization pulse sequence 159
parameters were as follow : 3.95 µs for proton 90° pulse, a contact time between 0.8 and 2.0 160
ms and 10 s recycle time. Usually, the accumulation of 5120 scans was used. The carbonyl 161
signal of glycine (176.03 ppm) was used to calibrate the chemical shift of the 13C NMR spectra. 162
The chemical shift, peak half-width and peak area of the different peaks were determined with 163
a least squares fitting method using Peakfit® software 164
Mass spectrometry
165 166
The samples analyzed by ssNMR were also analyzed by matrix-assisted laser 167
desorption/ionization (MALDI)-time-of-flight (TOF) MS. For the measurements, an ionic 168
preparation of 2,5-dihydroxybenzoic acid (DHB) and N,N-dimethylaniline (DMA) was used as 169
the MALDI matrix, as described in (Ropartz, 2011). Briefly, the matrix consists of a mixture 170
of DHB and DMA (DHB 100 mg.ml−1, in H2O/acetonitrile/ DMA (1:1:0.02)) and was mixed
171
with the samples in a 1:1 ratio (v/v). The mixture (1 μL) was then deposited on a polished steel 172
MALDI target plate. MALDI measurements were then performed on an Autoflex Speed 173
MALDI‐TOF/TOF spectrometer (Bruker Daltonics, Bremen, Germany) equipped with a 174
Smartbeam laser (355 nm, 1000 Hz) and controlled using the Flex Control 3.0 software 175
package. The mass spectrometer was operated with positive polarity in reflectron mode. Spectra 176
were acquired in the range of 180–3500 m/z. 177
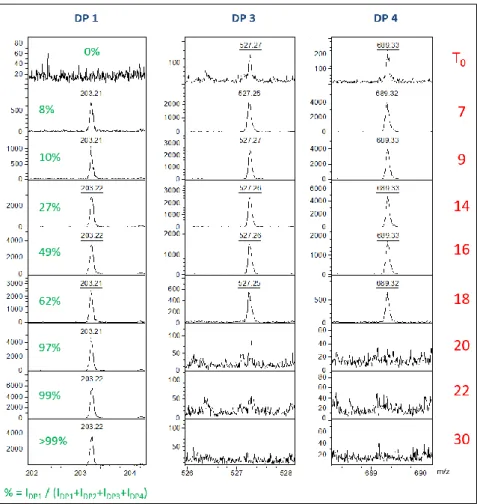
The evolution of the percentage of DP 1 was then monitored using the following formula: 178 % = 𝐼𝐷𝑃1 𝐼𝐷𝑃1+𝐼𝐷𝑃2+𝐼𝐷𝑃3+𝐼𝐷𝑃4 equation 1 179 FT-IR 180
Fourier transform infrared spectroscopy was performed before and after plasma treatment in 181
order to observe the eventual functionalization and/or stabilization of species on the surface of 182
inulin. Prior to analysis, the sample was lyophilized. The powder sample (5 mg) was mixed 183
with KBr (100 mg) and pressed in a hydraulic press and then recovered in the form of a pellet. 184
The analysis was carried out in a Nicolet IS50 spectrometer in transmission mode and the 185
resulting spectra were an average of 200 scans at a resolution of 16 cm-1. All spectra were 186
baseline corrected and normalized to be compared to each other. 187
2. Results and discussion
1882.1. Reactor optimization 189
190
In order to identify the reactivity sites (in gas bubbles, in the upper gas phase or at liquid-gas 191
interface) and to evaluate the discharge propagation, the effect of the volumeof liquid submitted 192
to plasma was studied, introducing 5 mL, 10 mL and 15 mL of an aqueous solution of inulin at 193
8 g.L-1 (figure 2). The experiments were carried out at constant voltage (19 kV), frequency (2 194
kHz) and time (20 min). The efficiency of the plasma discharge was evaluated by its impact on 195
inulin depolymerization via the following of fructose yields, pH, and NO2- / NO3- and H2O2
196
concentrations. 197
When 15 mL were introduced, the inulin solution filled the reactor with 5 mL of the volume 198
standing above the external electrode limit. No depolymerization occurred in this configuration. 199
Additionally, no pH change was observed and no other species were detected (Table 1). It 200
appeared that the observed discharge was occurring in the tube holding the central electrode, as 201
a very small air gap was present between the electrode and the inner wall of the dielectric barrier 202
(visible on figure 1). When the inner tube was sealed with glue, no plasma discharge was 203
observed, neither depolymerization. 204
When 10 mL of solution were inserted in the reactor, it allowed the development of the plasma 205
at the gas-liquid interface but without (or very little) plasma in the gas phase. A concentration 206
of only 0.14 g.L-1 of fructose was detected and, in the same time, pH dropped from 6.5 207
(untreated solution) to 5.0. Using semi quantitative test strips (Quantofix), a small fraction of 208
NOx- species were measured indicating the dissolution of nitrous oxides into nitrites (1 mg.mL
-209
1) and nitrates (≤ 10 mg.mL-1).
210
Finally, 5 mL of solution introduced resulted in a system with two phases of plasma, at interface 211
and in the gas phase. In this case, inulin was totally depolymerized into fructose (7 g.L-1), 212
glucose (0.25 g.L-1) and a compound of DP 2. It clearly showed that the most effective reaction 213
occurred when the gas-liquid interface and even more importantly, the plasma in gas phase are 214
present. From these results, the configuration using 5 mL of solution was kept throughout the 215
study. 216
The fact that the depolymerization was enhanced in presence of a gas phase highlighted the fact 217
that the long lived plasma species from the gas phase may be responsible of the reactivity. Their 218
dissolution in the liquid media would lead to active species capable to dissociate the polymer. 219
In order to verify this hypothesis the reactor was turned upside down, allowing only the contact 220
of the plasma long lived species with the liquid. It resulted in no modification of the inulin 221
chain. The pH of the solution decreased to 3.4, indicating the dissolution of acidic species from 222
the gas phase in the liquid, but no depolymerization occurred. It has been established in the 223
literature (Bruggeman et al;, 2016; Takai, 2008) that the active species generated in the gas 224
phase are transferred from the gas to the liquid phase, creating more reactive species such as 225
H2O2, peroxonitrites (ONOO−) and nitric acid (HNO3).Among the species commonly produced
226
in the liquid phase, H2O2, NO2- and NO3- were detected in the samples after plasma treatment
227
(Table 1). In the case of air treatment, NO3- was detected up to 500 mg.mL-1.
228
Table 1: pH, NO2- / NO3- and H2O2 concentrations measured after 20 min of air plasma treatment
229
for different liquid volumes. Parameters: P = 28 W, gas flow = 30 mL.min-1, f = 2 kHz; [inulin] 230
= 8 g.L-1
231
Volume 15 ml 10 ml 5 ml Upside down (5
mL) pH 6.5 5 1.5 3.4 H2O2mg.mL-1 0 10 11.2 1.5 NO2-mg.mL-1 0 1 15 0 NO3-mg.mL-1 0 15 500 350 232
2.2. Varying the chemical nature of the plasma gas 233
234
In order to further identify and evaluate the reactivity of plasma chemical active species in such 235
a system, the depolymerization reaction of inulin was performed using different gases. The 236
results are summarized in table 2. The highest concentration of H2O2 was measured under
237
oxygen and O2/He plasma. Under nitrogen and air plasma the H2O2 concentrations were lower,
238
due to the presence of NO2-, which in acidic conditions can lead to the H2O2 degradation
(Gorbanev, O’Connell & Chechik, 2016; Lukes, Dolezalova, Sisrova & Clupek, 2014). The 240
lowest concentration was measured under pure helium plasma. 241
Table 2: fructose concentration, pH and oxidized species concentrations measured after 20 min 242
of plasma treatment for different gas phases. Parameters: gas flow = 30mL.min-1, f = 2 kHz; 243 [inulin] = 8 g.L-1 244 Gas nature 100 % O2 100 % He 50% He / 50% O2 100 % N2 Synthetic air Power (W) 12 12 28 14 28 Fructose conc. (g.L-1) 0.3 0.02 0.3 0.9 7 pH 3-4 3-4 3-4 1.5 1.5 H2O2 (mmol.L-1) 15.5 3.6 13.7 10 11.2
NO3- (mg.L-1) none none none 250≥ x ≥500 ≥500
NO2- (mg.L-1) none none none 5<x<10 15
245
The fructose concentration measured after plasma treatment under helium was the lowest (0.02 246
g.L-1). The actives species generated under helium plasma such as He*, He
2*, He+ and He2+, but
247
also dissolved oxygenated species generated from electron and helium impact on water 248
molecules, are not participating in the reaction in the first 30 min. Oxygen gas appeared also 249
quite inert since the addition of oxygen to helium gas and higher injected power in the reactor 250
did not affect the fructose yield as compared with pure oxygen (0.3 g.L-1). When pure nitrogen
251
was flown through the system, a slight increase of fructose concentration was observed but to 252
a lesser extent compared to air treatment where inulin was totally converted. It is worth 253
mentioning that an air plasma treatment at 12W resulted in no conversion. 254
The HPLC results of the plasma treatment under synthetic air showed the progressive 255
depolymerization of inulin into smaller fractions and its two constituents, glucose and fructose. 256
Air plasma is the most effective treatment for the inulin depolymerization. A treatment time of 257
approximatively 20 min allowed the total conversion of inulin (figure 2). The concentration of 258
fructose was 7 g.L-1 reaching a plateau at 20 and 30 min. Interestingly, the glucose concentration 259
(figure 2b) increased until 30 min of treatment (0.4 g.L-1). It appears that the reactive species 260
derived from the reactions between nitrogen and oxygen in the air plasma are responsible for 261
the depolymerization. Nitrous oxides solvation in water would lead to nitric and nitrous acids, 262
providing H+ ions and consequently acid hydrolysis of the polymer.
263 264 265 266 267 268 269
Figure 2: plot of a) fructose and b) glucose yields as a function of treatment time. Conditions: 2 kHz, 30 270
mL.min-1; P = 28 W and P (He) = 12 W; [inulin] = 8 g.L-1
271 272
A series of tests with nitric acid were performed in order to confirm this hypothesis. When 5ml 273
of inulin solution were mixed with nitric acid (1 mol.L-1) till a pH = 1.5, followed by 80°C 274
heating from 20 to 100 min, a total conversion into fructose (8mg.ml-1) was achieved. The same 275
result was obtained when inulin powder was added to plasma treated water (in air; P = 28 W) 276
and heated up at 80°C. The pH of the water treated with air plasma equaled 1.5. These 277
experiments confirmed the participation of H+ in the depolymerization process. 278
2.3.Elucidating the depolymerization process 279
280
13C CP/MAS NMR spectroscopy was used for anomer analyses of reducing terminal units of
281
the treated chains in order to follow depolymerization under air plasma treatment, which proved 282
to be the most efficient treatment. A freeze dried reference (no plasma) was prepared and 283
compared to samples treated in air up to 20 min. The structure of inulin (a), along with the β-284 5 10 15 20 25 30 35 0 1 2 3 4 5 6 7 8 Fr ucto se yie ld ( g.L -1)
Treatment time (min)
air O2 N2 He He-O2 5 10 15 20 25 30 0,0 0,1 0,2 0,3 0,4 0.4 0.3 0.2 0.1 air O2 N2 He He-O2 gluco se yie ld ( g.L -1 )
treatment time (min) 0
D-fructopyranose form (b) detected in some samples is represented in figure 6. When 285
glucopyranose is present at the reducing end, the fructose molecules are in the furanose form. 286
Without glucose at the end, the fructose molecules are in the pyranose form (Levy & Fügedi, 287
2005). The labelling on the NMR spectra are also referenced in figure 3. 288
289
Figure 3: Structure of a) inulin and b) β-D-fructopyranose 290
291
After spectral deconvolution, the average degrees of polymerization have been calculated using 292
the next formula: 293
For untreated inulin, the lyophilized untreated inulin and inulin treated by plasma for 3 min: 294 𝐷𝑃 𝑎𝑣𝑒𝑟𝑎𝑔𝑒 =[ ∑ 𝑎𝑟𝑒𝑎 𝑓𝑟𝑜𝑚 83 𝑡𝑜 57 𝑝𝑝𝑚 5 ]−𝑎𝑟𝑒𝑎 𝑎𝑡 93 𝑝𝑝𝑚 𝑎𝑟𝑒𝑎 𝑎𝑡 93 𝑝𝑝𝑚 Equation 2 295
The numerator corresponds to the signal of fructose monomers subtracted from glucose 296
contribution (figure 4). The denominator corresponds to the signal of anomeric carbons of 297
ending glucose. 298
Inulin treated by plasma from 7 to 40 min: 299
𝐷𝑃 𝑎𝑣𝑒𝑟𝑎𝑔𝑒 =[(∑ 𝑎𝑟𝑒𝑎 𝑓𝑟𝑜𝑚 83 𝑡𝑜 57 𝑝𝑝𝑚)/5]−(𝑎𝑟𝑒𝑎 𝑎𝑡 93 𝑝𝑝𝑚+𝑎𝑟𝑒𝑎 𝑎𝑡 98 𝑝𝑝𝑚)
(𝑎𝑟𝑒𝑎 𝑎𝑡 93 𝑝𝑝𝑚+𝑎𝑟𝑒𝑎 𝑎𝑡 98 𝑝𝑝𝑚) Equation 3
The peak at 93 ppm corresponds to the glucose reducing end in the conformation and the 301
peak at 98 ppm in the β conformation or C2 from fructopyranose (Colombo, Aupic, Lewis &
302
Mario Pinto, 2015). 303
The NMR analysis of the freeze dried reference (figure 4) highlighted the presence of 304
fructopyranose form of inulin and showed that the freeze-drying step was also affecting the 305
supramolecular organization of inulin. The widening of the bands at 103 ppm and in both 306
regions 86-70 ppm and 68-54 ppm reflected a less ordered structure after lyophilization, most 307
probably arising from a loss of the crystallinity. In addition, the chemical shift of C1 (F1) of
308
fructose, between 80 and 74 ppm, was modified suggesting a significant change of the magnetic 309
environment. 310
311
Figure 4: 13C CP/MAS inulin spectra, (a) initial state, (b) after solubilization and lyophilization.
312
(Annotations are referring to figure 3). 313 314 F5 F3+F4 F6 +G6 F1 F2 G1 G2 + G3 + G4 + G5 Initiale a lyophilisée b F5 F3+F4 F6 +G6 F1 F2 G1 G2 + G3 + G4 + G5 Initiale a lyophilisée b
315
Figure 5: 13C CP/MAS spectra zones of non-anomeric carbons (left panel) and anomeric carbon (right
316
panel) of (a) lyophilized inulin (reference) and after plasma treatment of (b) 3min, (c) 7 min, (d) 13 min, 317
(e) 20 min. (Annotations are referring to figure 6) 318
319
Figure 5 shows the 13C CP/MAS spectra of inulin before and after up to 20 min of plasma 320
treatment. As the time of plasma treatment increased, peaks in the 110 – 90 ppm and 90 – 55 321
ppm regions evolved differently. The anomeric and non-anomeric carbon peaks of furanose 322
ring, labelled F1 to F6, are decreasing as the treatment time increases. At 7 min of treatment, 323
an anomeric carbon (FP2) presenting a chemical shift at 98.4 ppm is emerging, identified as C2
324
carbons of free fructose in the β-D-fructopyranose form (Colombo, Aupic, Lewis & Mario 325
Pinto, 2015; Shiomi & Onodera, 1990). The proportion of this signal increases with treatment 326
time. The presence of free β-D-fructopyranose is confirmed by peaks in the non-anomeric 327
carbon region at 70 ppm and 84 ppm, which increases as a function of treatment time. It is 328
worth mentioning that the pyranose form of fructose was predominant during the solubilization 329
step of monomeric fructose. This result indicates that the conversion from the furanose to 330
pyranose form is most likely to occur during the neutralization step and is not due to the plasma 331
treatment. 332
From equations (2) and (3), average values of the degrees of polymerization were calculated 333
(table 3). It shows that after 3 min, a clear depolymerization occurs as already shown by the 334
HPLC. A progressive decrease of the DP was observed as a function of the plasma treatment 335
time up to monomers, without further degradation. 336
Table 3: Calculated average degree of polymerization (DP) of air plasma treated inulin: P = 28 W; f = 2 337
kHz; flow rate: 30 mL.min-1
338 DP Commercial inulin 30 Lyophilized inulin 29 3min 27 7min 13 13min 3 20min 1 339
To investigate the molecular polydispersity of the released products and more specifically the 340
proportion of DP 1 throughout the treatment of inulin by the plasma, MALDI-TOF MS analyses 341
were performed (figure 6). The evolution of the proportion of DP 1 compared to DP 2, 3 and 4 342
was monitored by mass spectrometry, using the equation 1. These experiments showed that 343
above 20 min, it remains almost only DP 1 species (glucose and/or fructose). This result is 344
according to NMR measurements. 345
346
Figure 6: Evolution of the signal of DP 1, 3 and 4 by mass spectrometry as a function of plasma treatment 347
time. Oligosaccharides are detected as sodium adducts. The percentage of DP 1 was determined using 348
equation 1. The DP2 is not represented for esthetic reason, due to the presence of numerous matrix peaks 349
in the same region. 350
351
While fructose and glucose both crystallize as cyclic forms, in solution the free sugars show an 352
equilibrium with an acyclic form in small amount, the formation of which creates a carbonyl 353
group (Levy & Fügedi, 2005). This carbonyl group can react with hydroxyl groups restructuring 354
the hemiacetal cyclic form. For six carbon carbohydrates, like glucose and fructose, the ring 355
closing reaction can occur with more than one hydroxyl group, leading to isomerization and 356
multiple cyclic forms. Inulin is relatively chemically inert, although cleavage of the polymer 357
chain at any of the glycosidic bonds will produce a reactive reducing end, prone to further 358
reaction (Stevens, Meriggi & Booten, 2001; Wack & Blaschek, 2006). 359
2.4. Infrared bands attribution 360
Infrared analysis was used routinely for the assessment of chemical structure of treated inulin. 362
The full IR description of raw inulin has been described elsewhere (Grube, Bekers, Upite & 363
Kaminska, 2002; Ibrahim, Alaam, El-Haes, Jalbout & de Leon, 2006; Wack & Blaschek, 2006), 364
and can be used as reference. In the first region, between 4000-2000 cm-1, the large broad band
365
at 3300 cm-1, corresponding to the stretching of OH groups, did not change during the plasma 366
treatment (Figure 7). A sharp band of middle intensity was noticeable at 2930 cm-1, assigned to 367
the valence vibration of C-H asymmetric stretching of CH2 and a shoulder at 2890 cm-1
368
attributed to C-H symmetric stretching of CH2. A deviation of the baseline with treatment time,
369
giving rise to a broad absorption between 2400 - 3000 cm-1 was attributed to the formation of
370
carboxylic acids, under their dimeric form (Bellamy, 1962). 371
372
Figure 7: Infrared spectra of inulin as a function of plasma treatment time 373
In the following region, between 2000 and 1100 cm-1, multiple modifications were observed. 374
Plasma treated samples showed the formation of a new band at 1740 cm-1, corresponding to 375
stretching vibrations of C=O group. The band at 1640 cm-1, based on the existing literature
376 4000 3500 3000 2500 2000 1500 1000 500 -0,2 0,0 0,2 0,4 0,6 0,8 1,0 1,2 1,4 1,6 Absor ba nce (a rb . u nits) Wavenumber (cm-1) TO T10 T20 T30
(Higgins, Stewart& Harrington, 1961), was assigned to adsorbed water. The light shift of the 377
band to 1660 cm-1 was attributed to a change of the electronic environment due to intermediate 378
states generated during the oxidation steps, i.e. C=O formation. The bands at 1430 and 1334 379
cm-1 of the raw inulin are no longer visible after plasma treatment, hidden by the intensive broad
380
band at 1385 cm-1, corresponding to adsorbed nitrate ion (Elmelouky, Mortadi, Chahid & 381
Elmoznine, 2018). From T10 to T30, the presence of two bands at 1280 cm-1 and at 1205 cm-1 382
indicate a structure modification from the polymer to the monomer as these bands are related 383
to OCH and CCH bending vibrations bands of fructose and glucose. A complete disappearance 384
of the 1130 cm-1 band indicates the loss of C-O-C bridge character.
385
In the third region 1100-500 cm-1, also known as the fingerprint region, modifications are also 386
visible. Firstly, the band at 1030 cm-1 is reduced and hidden by a band at 1080 cm-1 (D-fructose). 387
All the bands (1035, 990, 935, 872 and 820 cm-1) related to the fructose/glucose ring structure 388
(C-O-C ring group and ring vibrations) shift slightly towards lower values but are still present, 389
indicating that the integrality of the monomer ring was not affected during the 390
depolymerization. Finally, a new band is formed at 778 cm-1 corresponding to CCO and CCH 391
bending of D-fructose and D-glucose. From these data, inulin is depolymerized without 392
degradation of the fructose and glucose rings. First, an oxidation of C-OH groups into 393
carboxylic acids takes place. As the plasma treatment time increases, breakage of the C-O-C 394
bridge of the polymer is observed. 395
It has been established in the literature (Bruggeman & Leys, 2009; Gorbanev, O’Connell & 396
Chechik, 2016; Nastase, Tatibouët & Fourré, 2018; Shainsky, 2012), that various types of 397
plasma-chemical species and reactions are initiated in air plasma in and in contact with liquids. 398
Among the chemical species produced by plasma at the gas-liquid interface, OH radical, 399
atomic oxygen, ozone and hydrogen peroxide are the main reactive oxygen species generally 400
accepted (Lukes, Dolezalova, Sisrova & Clupek, 2014; Sunka, 1999) to play the dominant role 401
in the reactivity. As for the nitrogen based species, nitric oxide and its derivatives formed with 402
water (nitrites, nitrates and peroxynitrites) are to be considered. For example, the dissolution of 403
the nitrous oxide gas generated in air plasma (Machala, 2013) leads to the formation of nitric 404
and nitrous acids. The most likely reaction pathway for the depolymerization would be via the 405
hydrolysis of the C-O-C bridge from H+ ions of HNO3 arising from the NOx dissolution in the
406
liquid. The slight depolymerization observed in nitrogen free plasmas could be attributed to OH 407
radicals attack of the glycosidic bond. However, this does not explain the decrease of pH after 408
a plasma treatment without nitrogen. Hydrogen peroxide concentration is too low to induce 409
such pH decrease. Literature reports the formation of acids (Machala, 2013; Shainsky, 2012), 410
arising from superoxide ion, O2.-, that participate in the decrease of pH under nitrogen free
411
plasma discharge and could explain our observation. 412
Conclusions 413
The use of renewable polysaccharide feedstocks to produce chemicals is stimulating a revival 414
in carbohydrate chemistry employing green and sustainable processes. In this study, a new 415
reactor has been successfully designed for the treatment of solutions or suspensions in a double 416
dielectric barrier discharge plasma reactor. This specific reactor configuration was used in the 417
depolymerization reaction of inulin. The conversion was strongly dependent on the gas 418
chemical nature and reactor configuration. Pure gases of helium, nitrogen and oxygen had little 419
effect on the depolymerization. However, plasma treatment under air led to a complete 420
depolymerization into fructose, glucose and a DP2 compound. It appears that reactivity is at 421
play at the gas-liquid interface, where electrons and gas species can be solvated and either attack 422
glycosidic bonds of inulin or recombine into more reactive species. Hydrogen peroxide, nitrous 423
and nitric oxides were identified. It appeared that the breakage of the glycosidic bond is 424
achieved by nitric acid hydrolysis under an air plasma discharge, while OH radicals attack 425
seems to be responsible of the small depolymerization under nitrogen free plasma. There is no 426
doubt with these results that the modification of biomass by non-thermal plasma in liquid media 427
represents a new and non-toxic approach that would reconsider the traditional ways. 428
Acknowledgements 429
The authors would like to thank the financial supports which are ADEME, Pays de Loire Region 430
and the FR CNRS INCREASE 3707 consortium. The mass spectrometry and NMR analyses 431
were performed using the equipment of the BIBS facility in Nantes (UR1268 BIA, IBiSA, 432
Phenome-Emphasis-FR (grant number ANR-11-INBS-0012)). 433
References 434
435
Baig, RB., & Varma, RS. (2012) Alternative energy input: mechanochemical, microwave and 436
ultrasound-assisted organic synthesis, Chemical Society Review, 41,1559-84 437
Bellamy, LJ. (1962) The infra-red spectra of complex molecules, Ed. Methuen & Co LTD. 438
Benoit, M., Rodrigues, A., De Oliveira Vigier, K., Fourré, E., Barrault, J., Tatibouët J.-M., & 439
Jérôme, F. (2012) Combination of ball-milling and non-thermal atmospheric plasma as physical 440
treatments for the saccharification of microcrystalline cellulose, Green Chemistry, 14, 2212-441
2215 442
Benoit, M., Rodrigues, A., Zhang, Q., Fourré, E., De Oliveira Vigier, K., Tatibouët, J-M., & 443
Jérôme, F. (2011) Depolymerization of cellulose assisted by a non-thermal atmospheric plasma, 444
Angewandte Chemie International Edition, 50, 8964 –8967
445
Blecker, C., Fougnies, C., Van Herck, J-C., Chevalier J-P., & Paquot, M. (2002) Kinetic study 446
of the acid hydrolysis of various oligofructose samples, Journal of Agricultural Food 447
Chemistry, 50, 1602-1607
448
Bruggeman, PJ., Kushner, MJ., Locke, BR., Gardeniers, JGE., Graham, WG., Graves, DB., 449
Hofman-Caris, RCHM., Maric, D., Reid, JP., Ceriani, E., Fernandez Rivas, D., Foster, JE., 450
Garrick, SC., Gorbanev, Y., Hamaguchi, S., Iza, F., Jablonowski, H., Klimova, E., Kolb, J., 451
Krcma, F., Lukes, P., Machala, Z., Marinov, I., Mariotti, D., Mededovic Thagard, S., Minakata, 452
D., Neyts, EC., Pawlat, J., Lj Petrovic, Z., Pflieger, R., Reuter, S., Schram, DC., Schröter, S., 453
Shiraiwa, M., Tarabová, B., Tsai, PA., Verlet, JRR., von Woedtke, T., Wilson, KR., Yasui, K., 454
& Zvereva, G. (2016) Plasma–liquid interactions: a review and roadmap, Plasma Sources 455
Science and Technologies, 25, 053002
456
Bruggeman, P., & Leys, C. (2009) Non-thermal plasmas in and in contact with liquids, Journal 457
of Physics D: Applied. Physics, 42, 053001
458
Colombo, C., Aupic, C., Lewis, A.R., & Mario Pinto, B. (2015) In situ determination of fructose 459
isomer concentrations in wine using 13C quantitative nuclear magnetic resonance spectroscopy, 460
Journal of Agriculture and food chemistry, 63, 8551 - 8559
461
Elmelouky, A. Mortadi, A., Chahid, El., Elmoznine, R. (2018) Impedance spectroscopy as a 462
tool to monitor the adsorption and removal of nitrate ions from aqueous solution using zinc 463
aluminum chloride anionic clay, Heliyon, 4, e00536 464
Farmer, JT., & Mascal, M. (2015). Platform molecules. In Clark, J., Deswarte, & F., 465
Introduction to chemicals from biomass, 2nd Edition (pp.89-156). John Wiley & Sons, Ltd. 466
Gorbanev, Y., O’Connell, D., & Chechik, V. (2016) Non thermal plasma in contact with water: 467
the origin of species, Chemistry: a European Journal, 22, 3496-3505 468
Grube, M., Bekers, M., Upite, D., & Kaminska, E. (2002) E. Infrared spectra of some fructans, 469
Spectroscopy, 16, 289-296
470
Higgins, HG., Stewart, CM., & Harrington, KJ. (1961) Infrared spectra of cellulose and related 471
polysaccharides, Journal of polymer chemistry, 51,59-84 472
Horváth, HT., & Anastas, PT. (2007) Innovations and green chemistry,Chemical Reviews, 107,
473
2169-2173 474
Ibrahim, M., Alaam, M., El-Haes, H., Jalbout, AF., & de Leon, (2006) F. Analysis of the 475
structure and vibrational spectra of glucose and fructose, Ecletica Quimica, 31, 15-21 476
Jérôme, F. (2016) Non-thermal atmospheric plasma: opportunities for the synthesis of valuable 477
oligosaccharides from biomass, Current Opinion in Green and Sustainable Chemistry, 2, 10-478
14 479
Jérôme, F., Chatel G., & De Oliveira Vigier, K. (2016) Depolymerization of cellulose to 480
processable glucans by non-thermal technologies, Green Chemistry, 18, 3903-3913 481
Kan, CW., Lam, CF., Chan, CK., & Ng, SP. (2014) Using atmospheric pressure plasma 482
treatment for treating grey cotton fabric, Carbohydrate Polymers, 15, 167-73 483
Levy DE., & Fügedi, P. (2005) The Organic Chemistry of Sugars, CRC Press and Taylor and 484
Francis Group 485
Lukes, P., Dolezalova, E., Sisrova, I., & Clupek, M. (2014) Aqueous-phase chemistry and 486
bactericidal effects from an air discharge plasma in contact with water, Plasma Sources Science 487
and Technologies., 23, 015019
488
Machala, Z., Tarabova, B., Hensel, K., Spetlikova, E., Sikurova, L., & Lukes, P. (2013) 489
Formation of ROS and RNS in water electro-sprayed through transient spark discharge in air 490
and their bactericidal effects, Plasma Process and Polymers, 10, 649-659 491
Mariotti, D., Patel, P., Švrček, V., & Maguire, P. (2012) Plasma–liquid interactions at 492
atmospheric pressure for nanomaterials synthesis and surface Engineering, Plasma Process. 493
Polym, 9, 1074-1085
Nastase, R., Tatibouët, J-M., & Fourré, E. (2018) Depolymerization of inulin in the highly 495
reactive gas phase of a non-thermal plasma at atmospheric pressure. Plasma Process and 496
Polymers, 15, 1800067
497
National Research Council. Plasma processing of materials: scientific opportunities and 498
technological challenges. (1991) Washington, DC: The National Academies Press
499
Ong, HC., Chen, WH., Farooq, A., Gan, YY., Lee, KT., & Ashokkumar, V. (2019) Catalytic 500
thermochemical conversion of biomass for biofuel production: a comprehensive review, 501
Renewable & Sustainable Energy Reviews, 113, 109266
502
Pankaj, SK., & Keener, KM. (2017) Cold plasma: background, applications and current trends. 503
Current Opinion in Food Science, 16, 49–52
504
Postek, MT., Moon, RJ., Rudie, AW., & Bilodeau, MA. (2013) Production and Applications 505
of Cellulose Nanomaterials, Tappi Press
506
Raccuia, SA., Genovese, G., Leonardi, C., Bognanni, R., Platania, C., Calderaro P., & Melilli, 507
MC. (2016) Fructose production by Cynara cardunculus inulin hydrolysis, Acta Horticulturae, 508
43, 309-314 509
Ropartz, D., Bodet, P-E., Przybylski, C., Gonnet, F., Daniel, R., Fer, M., Helbert, W., Bertrand, 510
D., & Rogniaux, H. (2011) Rapid Communication in Mass Spectrometry, 25, 2059–2070 511
Shainsky, N., Dobrynin, D., Ercan, U., Joshi, SG., Ji, H., Brooks, A., Fridman, G., Cho, Y., 512
Fridman, A., & Friedman, G. (2012) Plasma acid: water treated by dielectric barrier discharge, 513
Plasma Process and Polymers, 10, 1-6
514
Sheldon, RA. (2018) Chemicals from renewable biomass: a renaissance in carbohydrate 515
chemistry, Current Opinion in Green and Sustainable Chemistry, 14, 89-95 516
Shiomi, N., & Onodera, S. (1990) The 13C-NMR spectra of inulo-oligosaccharides, 517
Agricultural Biological Chemistry., 54, 215–216
518
Stevens, CV., Meriggi, A., & Booten, K. (2001) Chemical modification of inulin, a valuable 519
renewable resource, and its industrial applications, Biomacromolecules, 2, 1-16 520
Sunka, P., Babicky, V., Lupek, MC., Lukes, P., Simek, M., Schmidt, J., & Cernak, M. (1999) 521
Generation of chemically active species by electrical discharge in water, Plasma Sources 522
Science and Technology, 8, 258–265
523
Sylla-Iyarreta Veitía, S., & Ferroud, C. (2015) New activation methods used in green chemistry 524
for the synthesis of high added value molecules, International Journal of Energy and 525
Environmental Engineering., 6, 37-46
526
Takai, O. (2008) Solution plasma processing (SPP), Pure and Applied Chemistry, 80,
2003-527
2011 528
Tarabova, B., Lukes, P., Janda, M., Hensel, K., Sikurova, L., & Machala, Z. (2018) Specificity 529
of detection methods of nitrites and ozone in aqueous soutions activated by air plasma, Plasma 530
Process and Polymers, 15, 1800030
531
Tendero, C., Tixier, C., Tristant, P., Desmaison, J., & Leprince, P. (2006) Atmospheric pressure 532
plasmas: a review, Spectrochimica. Acta Part B, 61, 2-30 533
Wack, M., & Blaschek, W. (2006) Determination of the Structure and Degree of Polymerisation 534
of Fructans from Echinacea Purpurea Roots, Carbohydrate Research, 341, 1147-53 535