Dynamic Stability Analysis of a Multi-Stage
Axial Compressor with Design Implications
by
Emmanuel Blanvillain
Submitted to the Department of Aeronautics and Astronautics in partial fulfillment of the requirements for the degree of
MASTER OF ENGINEERING IN AERONAUTICS AND ASTRONAUTICS
at the
MASSACHUSETTS INSTITUTE OF TECHNOLOGY
February 2003
@ 2003 Emmanuel Blanvillain. All rights reserved.
The author hereby grants to MIT permission to reproduce and distribute publicly paper and electronic copies of this thesis document in whole or in part, and to grant others the right to do so.
Author a
Department of Aeronautics and Astronautics
December-2,0, 2002
Certified by
Charles Boppe Senior Lecturer, Department of Aeronautics and Astronautics Thesis Supervisor
Certified b3
of sor Zoltin SpaJrlvszky
C.R. Soderberg Assistant Professor of Aeronautics and Astronautics Thesis Supervisor
Accepted by
14 ofessor Edward M. Greitzer
H.N. Slater Professor of Aeronautics and Astronautics
Chair, Committee on Graduate Students
MASSACHUSETTS INSTITUTE OF TECHNOLOGY
SEP 1
0 2003
Dynamic Stability Analysis of a Multi-Stage
Axial Compressor with Design Implications
by
Emmanuel Blanvillain
Submitted to the Department of Aeronautics and Astronautics on December 20, 2002, in partial fulfillment of the
requirements for the degree of
Master of Engineering in Aeronautics and Astronautics
Abstract
This thesis is the first year effort of a joint engineering project initiated by Snecma Moteurs, ENSAE,
ECL and MIT. The objective of this joint project is to conceive, design, implement and operate an
advanced core compressor for an unmanned flight vehicle in the light of three design visions: a classical design vision using state-of-the-art tools, a design vision based on system integration and operability and a design vision robust to uncertainties in compressor stability. This thesis focuses on the dynamic stability analysis of a multi-stage candidate compressor and delineates the design implications for increased stability. The present study addresses three main issues:
System Aspects of Engine Stability A study of the system aspects of engine surge is conducted from operational, cost and regulatory perspectives. The cost of operating a single type of reduced-stability engine for a major US airline can reach up to $10 million a year, which corresponds to 8% of the annual revenue potentially generated by the fleet powered by these engines.
Analysis of Compressor Dynamic Stability in a Multi-Stage Environment An existing
dynamic compressor system model is adapted and extended to a candidate multi-stage compressor.
A detailed outline of requirements for the necessary input for this model is assessed. This dynamic
compressor model is used to investigate the dynamic behavior of the CREATE compressor. The dynamic behavior of this machine is dissected and the dynamics of individual stages are analyzed in the context of the overall compression system pre-stall dynamics.
Design Guidelines for Enhanced Compressor Stability Three effects on the dynamic
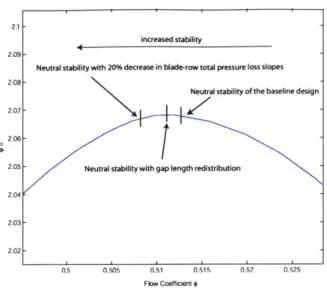
sta-bility of a 4-repeating-stage compressor are considered: the effect of blade-row inertia, the effect of blade-row performance and the effect of axial coupling between blade-rows. Redistributing the inter-blade-row gap length along the compressor to modify the axial coupling extends the stable compressor operability range in terms of flow coefficient by 4.6%. A 20% reduction in total pressure loss sensitivity to blade-row inlet flow angle on all blade-rows extends the stable compressor oper-ability range by 14.3%. These results highlight the potential improvement of compressor dynamic stability by appropriately redesigning the machine and delineate guidelines for the following years of the joint engineering project between Snecma and the three universities.
Thesis Supervisor: Charles Boppe
Title: Senior Lecturer, Department of Aeronautics and Astronautics
Thesis Supervisor: Professor Zoltdn Spakovszky
Acknowledgments
I first want to thank Professor Spakovszky for his support in my research, and for the numerous insights he provided. I also want to thank Professor Boppe for the guidance and encouragement he provided all along this project.
In am also grateful to Professors Hansman and Waitz for sharing with me their knowledge of Air Transportation.
Finally, I want to thank all the members of the joint project, including the engineers at Snecma for their support and insightful guidance, Professors Carrere from ENSAE and Trebinjac from ECL, as well as all the students who contributed to the project.
Contents
Abstract 3 List of Figures 13 List of Tables 15 1 Introduction 21 1.1 Technical Background . . . . 211.1.1 Rotating Stall and Surge . . . . 21
1.1.2 The Path to Instability: Inception Mechanisms of Rotating Stall and Surge . 21 1.2 Previous Work . . . . 22
1.3 M otivations . . . . 23
1.3.1 Consequences of a Surge Event . . . . 23
1.3.2 Current Practice: Sub-Optimal Design due to Surge Margin . . . . 23
1.3.3 Potential Benefits of a Compressor Designed for Stability . . . . 23
1.4 Context of the Project . . . . 24
1.4.1 Joint Project . . . . 24
1.4.2 Suggested Visions of Compressor Design . . . . 24
1.4.3 Joint Project Timeline . . . . 26
1.4.4 Present Thesis in the Light of the Overall Project . . . . 26
1.5 O bjectives . . . . 27
1.6 Contributions . . . . 27
1.7 Thesis Organization . . . . 28
2 System Aspects of Compressor Stability 29 2.1 Surge and Stall from an Operability Point of View . . . . 29
2.2 Consequences of Rotating Stall and Surge . . . . 30
2.2.2
2.2.3 2.2.4
Cost Consequences . . . . Consequences for Flight Regulation . . . .
Surge Event Consequences for Design Practice . . . .
3 Tool Development and Derived Requirements
3.1 Structure of the M odel. . . . .
3.2 M ean-Flow Calculation . . . .
3.2.1 Background and Inputs . . . .
3.2.2 Blade-Row Correction Factors and Validation . . . .
3.2.3 Conclusion and Derived Requirements for the Mean-Flow Calculation . . . .
3.3 Dynam ic M odel . . . . 3.3.1 M odel Description . . . .
3.3.2 Adaptation and Extension of the Model . . . .
3.3.3 Application of the Dynamic Compression Model to the CREATE Compressor
3.3.4 Conclusion and Derived Requirements for the Dynamic Model . . . .
4 Analysis of Blade-Row Interaction on Compressor Stability in a Multi-Stage En-vironment
4.1 Statement of Objectives . . . .
4.2 Impact of Design Parameters on Dynamic Stability . . . . . 4.3 Detailed Analysis of Blade-Row Interaction . . . . 4.3.1 Description of the Standard Compressor . . . . 4.3.2 Description of the Compressor Modes . . . .
4.3.3 Detailed Analysis of the Lightly-Damped Mode . . .
4.3.4 Error Analysis: Assessing the Level of Confidence in 4.4 Conclusions and Design Implications . . . .
4.4.1 Conclusions . . . . 4.4.2 Design Guidelines . . . . 5 Conclusions and Future Work
5.1 Summary and Conclusions . . . .
5.1.1 Impact of Surge on Airline Operations . . . .
5.1.2 Eigenvalue Structure in Multi-Stage Environment . .
5.1.3 Design Guidelines for Increased Stability . . . .
5.2 Recommendations for Future Work . . . .
5.2.1 Tool Development . . . .
the Results
5.2.2 Eigenvalue Structure and Understanding of the Underlying Dynamics
32 36 36 39 39 39 39 40 42 43 43 46 53 60 63 . . . . 63 . . . . 63 . . . . 65 . . . . 65 . . . . 68 . . . . 69 . . . . 75 . . . . 76 . . . . 76 . . . . 77 79 . . . . 79 . . . . 79 . . . . 80 . . . . 80 . . . . 81 . . . . 8 1 81
5.2.3 Evolution Towards Compressors with More Complex Design . . . . 82
5.2.4 Design Guidelines . . . . 82
APPENDICES 83 A Structure of the Mean-Flow Calculation 83 A-1 Flow Field Quantities at the Inlet of a Blade-Row . . . . 83
A-2 Flow Field Quantities Between Blade-Rows . . . . 85
A-3 Mean-Flow Across a Rotor Blade-Row . . . . 86
A-4 Mean-Flow Across a Stator Blade-Row . . . . 89
B Data Processing of Blade-Row Stagnation Pressure Loss Characteristics 93 B-1 General Loss Processing . . . . 93
B-2 Interpolation Process . . . . 94
C Penalty Method for Eigenvalue Search Routines 97 D Analysis of the Nature of Non-Critical Compressor Modes 103 D-1 Analysis of Modes Associated with Unsteady Loss Effects . . . . 103
D-2 Analysis of Highly-Damped Modes . . . . 108
List of Figures
1-1 Joint Project Framework. . . . . 25
1-2 Project Timeline Highlighting C, D, I, 0 Elements . . . . 26
2-1 Compressor Map Illustrating Surge Margin . . . . 37
3-1 Overall Structure of the Model . . . . 40
3-2 Deviation Angle at the Exit of a Blade-Row . . . . 41
3-3 Compared Near Peak Total-to-Total Pressure Ratios for Adjustments of Blockage Rate and Deviation using Carter's Rule . . . . 43
3-4 Single Stage Compressor Model . . . . 45
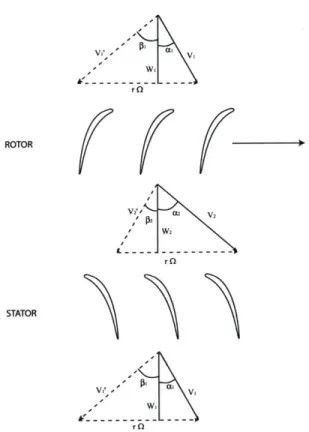
3-5 Velocity Triangles for the Rotor . . . . 46
3-6 Improvement in Initial Guess . . . . 53
3-7 A: Eigenvalues of the Isolated Second Stage of the CREATE Compressor without Unsteady Losses Time-Lags . . . . 55
3-8 B:Eigenvalues of the Isolated Second Stage of the CREATE Compressor with Un-steady Losses Time-Lags . . . . 55
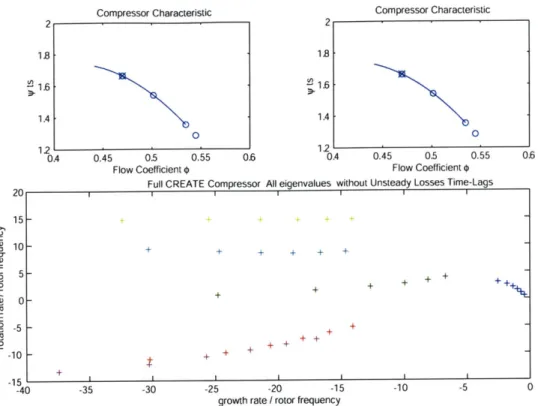
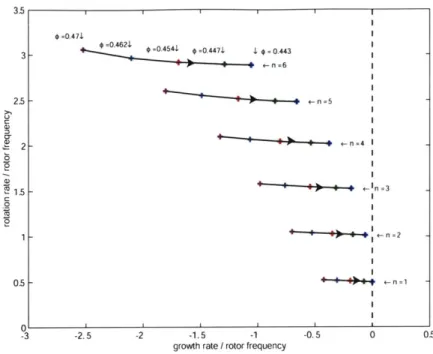
3-9 A: Eigenvalues of the Full CREATE Compressor without Unsteady Losses Time-Lags 56 3-10 B: Eigenvalues of the Full CREATE Compressor with Unsteady Losses Time-Lags 56 3-11 Eigenvalues of the Full CREATE compressor without Unsteady Losses Time-Lags -Instability Point . . . . 58
3-12 Locus of the Low-damped Eigenvalues of the Full CREATE Compressor as the Flow Coefficient Decreases . . . . 59
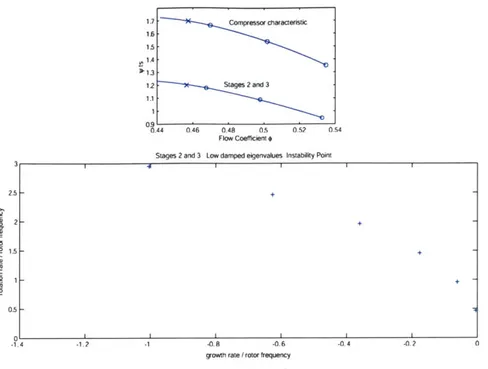
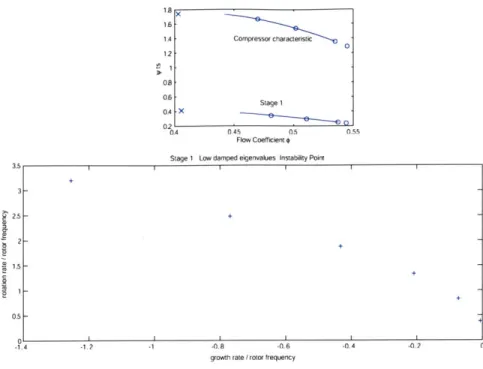
3-13 Eigenvalues of Stage 2 and 3 of the CREATE Compressor Stacked - Instability Point 60 3-14 Eigenvalues of the Isolated First Stage of the CREATE Compressor without Time Lags 61 4-1 Measure of Improvement in Stability . . . . 64
4-2 Comparison of Effects of Blade-Row Performance and Gap Length Redistribution on the Flow Coefficient at Neutral Stability . . . . 65
50% Reaction Blading with Constant Axial Velocity . . . .
Standard Loss Bucket ... ... ... . . . .... . ...
Results for the Moore-Greitzer Formulation of the Dynamics of the 4-Stage Standard
Compressor .
Eigenvalue Map of the 4-Stage Standard Compressor . . . . Inertia Sensitivity on the Critical Mode: Harmonic #1 . . . .
Modifying the Sensitivity of Total Pressure Loss to Blade-Row Inlet Flow Angle .
Loss Slopes Sensitivity on the Critical Mode: Harmonic 1 . . . . Gaps Nom enclature . . . .
Gap Length Sensitivity on the Critical Mode: Harmonic 1 . . . .
Energy Distribution for Two Gap-Length Changes . . . . 4-6 4-7 4-8 4-9 4-10 4-11 4-12 A-1 A-2 A-3 A-4 A-5 A-6 A-7 A-8
B-1 Sequence of Operations to Compute the Sensitivity of Total Pressure Row Inlet Flow Angle . . . .
Loss to
Blade-. Blade-. Blade-. Blade-. Blade-. Blade-. Blade-. Blade-. Blade-. 94
B-2 Determination of the Appropriate Description of Losses that are Input to the Dynamic
Model
B-3 Interpolated Loss Curves for L . . . .
Shape of the Penalty Function . . . .
A: Fitting of a Penalty Function . . . .
B: Fitting of a Penalty Function (continued) . . . . Impact of Semi Max on the Penalty Function . . . . Impact of Semi Max Gaussian on the Penalty Function . . . . Penalty Function Corrections . . . . Modes Associated With Unsteady Loss Effects of the 3-Stage Symmetric Compressor Modes Associated With Unsteady Loss Effects of the 4-Stage Symmetric Compressor Unsteady Loss Time-Lag Sensitivity on Mode X', Y', Z' - Harmonic 3 . . . .
4-3 4-4 4-5 66 66 . . . . 6 7
Velocity Triangle at Inlet . . . .
Structure of the Inlet Flow Parameters Calculation . . . . Evolution of the Velocity Across the Inter-Blade-Row Gap . . . .
Structure of the Inter-Blade-Row Gap Mean-Flow Calculation . . Velocity Triangles for the Rotor . . . . Structure of the Rotor Mean-Flow Calculation . . . .
Velocity Triangles for the Stator . . . . Structure of the Stator Mean-Flow Calculation . . . .
68 70 71 72 72 73 74 83 84 86 87 87 88 89 90 C-1 C-2 C-3 C-4 C-5 C-6 D-1 D-2 D-3 . . . . 9 5 96 97 99 99 101 102 102 104 105 107
D-4 Perturbation Energy Distribution for modes S' and T' - Harmonic #1
D-5 Eigenvalue Map for the 3-Stage Standard Compressor
D-6 Eigenvalue Map for the 4-Stage Standard Compressor
D-7 Blade-Row Inertia Sensitivity on Mode C' . . . ..
D-8 Energy Distribution for Mode C' . . . ..
D-9 Energy Distribution for Mode F' . . . ..
D-10 Energy Distribution for Mode D' . . . ..
D-11 Energy Distribution for Mode G' . . . ..
D-12 Energy Distribution for Mode E' . . . ..
D-13 Energy Distribution for Mode H' . . . ..
D-14 Energy for Mode A' . . . . ..
D- 15 Energy for Mode B' . . . . ..
. . . . 10 8 . . . . 10 9 . . . . 1 10 . . . . 1 12 . . . . 1 12 . . . . 1 12 . . . . 112 . . . . 1 12 . . . . 1 12 . . . . 1 13
D-16 Hypothesis of Correspondence between the Modes Dynamics and t Dynamics for the 4-Stage Standard Compressor . . . .
he Blade-Rows
D-17 Highly Damped Modes for a 3-Stage Standard Compressor and a 4-Stage Standard
C om pressor . . . .
D-18 System Dynamics View of "Expanding" a Compressor . . . . 113 113 114 115 . . 107
.
List of Tables
2.1 Aircraft Costs Related to a Surge Event . . . . 33
2.2 Surge Event Related Airline Costs . . . . 34
2.3 Long Term Recurring Costs Associated with Low-Stability Engines . . . . 34
2.4 Total Costs Associated with a Surge Event . . . . 35
2.5 Annual Airline Costs . . . . 35
2.6 Surge Margin Breakdown for a HPC for a Fixed Operating Point . . . . 37
3.1 Comparison of Deviation Angles Between Carter's Rule Prediction and Snecma Data for the Available Mass Flow Rate Closest to Stall . . . . 42
3.2 Performance of the Baseline Search Routine Compared to an Improved Routine with Penalty M ethods . . . . 52
3.3 Compared Performances of the Baseline Search Routine and the Improved Routine with Improved Initial Guess . . . . 53
3.4 Instability Limits for Different Configurations of the CREATE Compressor . . . . . 59
4.1 Effects of Design Changes on Stability Gain . . . . 64
4.2 Gap Length Sensitivity . . . . 73
4.3 Error A nalysis . . . . 75
4.4 Design G uidelines . . . . 76
B.1 Interpolation Settings for the L Losses . . . . 96
D.1 Hypothesis of Correspondence between the Modes Dynamics and the Blade-Rows D ynam ics . . . . 111
Nomenclature
Acronyms
AD Airworthiness Directive
CFD Computational Fluid Dynamics
CREATE Compresseur de Recherche pour l'Etude des effets Arodynamiques et TEchnologiques
(Research Compressor for the study of Aerodynamical and Technological Effects)
ECL Ecole Centrale de Lyon EGT Exhaust Gas Temperature
EPR Engine Pressure Ratio
FAA Federal Aviation Administration
FAR Federal Aviation Regulation
HPC High Pressure Compressor
HPT High Pressure Turbine
IGV Inlet Guide Vanes
IOD Internal Object Damage
MLW Maximum Landing Weight
MTOW Maximum Take Off Weight
ENSAE Ecole Nationale Sup rieure de l'A6ronautique et de l'Espace UAV Unmanned Aeronautical Vehicle
Greek
a absolute flow angle
#
relative flow angle6 deviation angle, perturbation
< flow coefficient
7, stagger angle
A blade passage inertia Q rotational speed w loss coefficient w, rotation rate
Ot total-to-static pressure ratio
7r Engine Pressure Ratio
p gas density
o- solidity oa growth rate
r unsteady-losses time-lag
Roman
c, specific heat at constant pressure
CxR axial chord of the rotor
c.s axial chord of the stator rh mass flow
M Mach number
NI rotation speed of the low spool
N2 rotation speed of the high spool p static pressure
R mean radius
R perfect gas constant
r radius
S cross sectional area T static temperature
U wheel speed V velocity
W or Vx axial velocity
x axial location
Superscripts
spatial Fourier coefficient
mean value in relative frame Subscripts 1 at inlet 2 at exit is isentropic r rotor stator
o
in tangential direction t stagnation quantity x in axial directionChapter 1
Introduction
1.1
Technical Background
1.1.1
Rotating Stall and Surge
Axial compressors used in gas turbine engines can experience aerodynamic instabilities under certain operating conditions. These instabilities can either be rotating stall and/or surge.
Surge is a circumferentially uniform low-frequency instability (3-10 Hz) that affects the entire engine. When surging, the compressor experiences oscillations of alternatively positive and negative
flow, which can cause severe engine damage.
On the other hand, rotating stall is characterized by one or several reduced velocity regions in the annulus, due to the stalling of one or several blades. These regions, called stall cells, travel circumferentially at a fraction of the compressor rotation rate, with much higher frequency than surge (usually 20-50% of rotor speed). A review of flow instabilities in compression systems is given
by Greitzer [121.
The mechanisms that initiate these flow instabilities are named inception mechanisms. They are reviewed in the following section.
1.1.2
The Path to Instability: Inception Mechanisms of Rotating Stall
and Surge
Camp and Day [4] have identified two main pathways for stall inception: "spike-like" disturbances and "modal oscillations." Both phenomena can occur in the same compressor, either independently or simultaneously, and strongly depend on stage matching.
Spike is characterized by the localized stalling of one blade-row which emerges into stall cells and causes the compressor to stall. This is a short wave-length and local phenomenon that can emerge
from a few blade-passages only.
As opposed to spike-like disturbances, modal oscillations are much longer length-scale circumferential perturbations. The term "modal" refers to circumferential modes, the first mode with a wavelength equal to the circumference, the second mode twice its circumference, etc. Unlike spike-like distur-bances, modal oscillations usually extend over a wide circumferential sector of the annulus, and over the full length of the machine.
Camp and Day suggest a criterion, based on stage-matching, that determines which of these two phenomena is going to arise. If somewhere in the compressor a rotor incidence exceeds its "critical value," i.e. the incidence that causes separation and flow stagnation, spike is likely to trigger stall before the zero-slope point of the total-to-static pressure characteristic is reached (at negative slope). On the other hand, if the stage matching is such that no rotor incidence exceeds its critical value, modal oscillations are likely to occur near the top of the total-to-static pressure characteristic (at zero slope).
This thesis will focus on modal stall inception since this type of inception is known to be present in many high-speed axial compressors [18].
1.2
Previous Work
Extensive experimental and theoretical studies have been conducted on rotating stall and surge in axial flow compressors (see Cumpsty [5] for review).
Rotating stall and surge are the mature forms of small amplitude flow perturbations that are the natural resonances of oscillation in the compressor system. These small disturbances grow when background flow conditions are such that their damping becomes negative and the compression sys-tem drops into an unstable state, rotating stall or surge. Based on these observations, a modeling methodology has been developed by Moore and Greitzer [14]. A review of these different approaches to modeling the nonsteady fluid dynamics associated with two-dimensional compressor flow field can be found in Longley [13].
The fundamental Moore-Greitzer model was extended into a number of descriptions and was applied to a variety of applications (cf. Bonnaure [3], Feulner [10], Paduano [15], Spakovszky [17]). The present study will mainly focus on the compressor dynamic system model developed by Spakovszky
[16]. Its modular structure renders modeling flexibility and enable to resolve the dynamics of
in-dividual blade-rows, inter-blade-row gaps and intermediate ducts. This model can thus deal with dynamic interaction effects between components. In addition, the low-order, analytical nature of the model allows to dissect the dynamic stall phenomena and facilitates the explanation of physical mechanisms.
1.3
Motivations
1.3.1
Consequences of a Surge Event
Several incidents and accidents, involving both hull losses and fatalities, have been attributed to catastrophic engine surge throughout aviation history. Even during less dramatic events, an in-flight surge can have serious consequences on the airline's operations, and affect the passengers' perception of the airline. To limit potential risks associated with surge events, industry design practice and certification authorities impose a substantial margin, called surge-margin, intended to
keep the engine operating away from the surge boundary.
1.3.2
Current Practice: Sub-Optimal Design due to Surge Margin
Surge margin is a measure based on steady-state arguments, and is used as the main metric for compressor operational stability. However, many uncertainties affect this surge margin, such as inlet distortion, transient operation, icing, and engine deterioration. Increasing the level of surge-margin to account for these uncertainties in compressor design is usually accompanied by a reduction in blade loading and diffusion, typically moving away from points of high efficiency. Especially in multi-stage machines, stage matching and the loading distribution strongly affect the surge margin and it is clear that trade-offs between compressor performance and stability have to be made.
1.3.3
Potential Benefits of a Compressor Designed for Stability
With the physical understanding of compressor stability gained over the past fifteen years, many problems have been solved and existing designs have been improved. However, a next step in the understanding of the dynamic pre-stall behavior of axial compressors is to incorporate this knowledge early in the design phase. This thesis discusses the so-far unposed question of how an axial compression system would have to be designed if dynamic stability was a prime design variable, and what potential improvements such a decision could render.
In order to answer the above question and to educate the engineers of the future, a coopera-tive effort was initiated with the engine manufacturer Snecma Moteurs and two French engineering schools: ENSAE and ECL. More details about this joint project follow.
1.4
Context of the Project
1.4.1 Joint Project
In 2001, Snecma Moteurs, the Ecole Nationale Sup6rieure de l'A6ronautique et de l'Espace (ENSAE), the Ecole Centrale de Lyon (ECL) and the Massachusetts Institute of Technology (MIT) signed a cooperative academic agreement. The objectives of this cooperative academic agreement were:
" To conduct an educational program on "Complex Air And Propulsion Systems";
" To prepare students to cope with complex systems in complex environments and international
teams and to recruit students for industry practice;
" To leverage complementary strengths of the US and French educational systems and to immerse
students in an international environment (e.g. student exchange program);
" To offer students opportunities to acquire direct industry experience (e.g. engineering system
projects, industry internships etc.).
The joint project's primary mission, following the MIT Aero/Astro Department educational frame-work, is to Conceive, Design, Implement and Operate (CDIO) an advanced core compressor for an unmanned flight vehicle. It was suggested that a potential candidate compressor for such a vehicle could be an advanced research compressor designed by Snecma Moteurs called CREATE (Compresseur de Recherche pour l'Etude des effets A rodynamiques et TEchnologiques). This com-pressor has been used in previous academic projects and could therefore provide benchmarking information, from both a theoretical and an experimental point of view.
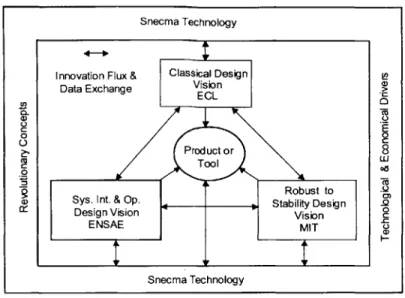
The collaboration between the three universities is based on the expertise that each of them has developed over the years in specific areas. Therefore, all teams are working concurrently on the same project using three different but complementary design visions as illustrated in Figure 1-1. Each of these will be further delineated in Section 1.4.2. The three visions are expected, after simultaneous research efforts, to blend into a unique final design, to be later implemented and tested.
1.4.2
Suggested Visions of Compressor Design
Classical Design Vision Using State-of-the-Art Tools
This part of the joint effort is performed by ECL because of the strong links that have been es-tablished during the previous years with Snecma Moteurs, in terms of computational and testing capabilities. The first objective for the team at ECL is to adapt existing CFD codes to the can-didate compressor and to improve the turnaround time of these high-fidelity computations using parallel computing. This will set a basis for interactions with the other engineering schools and will
Figure 1-1: Joint Project Framework
also allow for an inverse design process to be progressively set up based on an iterative procedure. Moreover, taking advantage of the baseline design of the CREATE compressor that is implemented in a test rig at ECL, the team has also been assigned the mission to help in the validation of the computational tools developed by the other teams.
Design Vision Based on System Integration and Operability
This part of the joint effort is performed by ENSAE due to the expertise of the school in the field of aircraft integration, flight dynamics and propulsion. The first objective is to identify a candidate unmanned aeronautical vehicle (UAV). To enable benchmarking in terms of performance, operability and design, an existing UAV is chosen as the baseline. In a second step, cycle and aircraft integration studies of the engine to power the UAV are conducted, delineating the performance and operability requirements for the core compressor. The core compressor design will be based on an advanced CREATE compressor design that results from the three complementary design visions. Finally, the third step is a preliminary aero-mechanical study of certain engine components.
Design Vision Robust to Uncertainties in Compressor Stability
This part of the joint effort is performed by MIT. The Gas Turbine Laboratory has developed an expertise in the area of compressor stability from both theoretical and experimental studies during the last fifteen years. The first objective of the MIT team is to evaluate the current industry practice with regards to stability, especially in the light of surge margin and engine stability prediction. Then, an existing dynamic system model [16] is adapted to the CREATE compressor and the pre-stall
Snecma Technology
Innovation Flux & Classical Design
Data Exchange Vision
CC 0 0 () C: Product or 8 Tool 0 Robust to
-( Sys. I nt. & Op.Stability Design 0
Design Vision Vision
ENSAE MIT
dynamic behavior of the baseline design is investigated. Then, a sensitivity analysis is conducted to determine which of the design parameters have the strongest impact on dynamic compressor stability. An assessment of how these results can be used in a design framework where stability is a prime design objective is then made.
1.4.3
Joint Project Timeline
On a preliminary basis, the project span is suggested to be three to four years as presented in Figure 1-2. It is intended to incorporate the CDIO approach on the project level over three years, as well as within each year of the program. The first year is dedicated to the conception and preliminary design of the technical approach to the core compressor, including tool development. The second year focuses on the final design and implementation of the core compressor. The third year is dedicated to hardware manufacturing, assembly and experimental testing of the compressor. As mentioned earlier, strong interaction between MIT, the French engineering schools and Snecma Moteurs is expected as the project moves forward.
Year 1 Year 2 Year 3 Year 4
Conception and Final Design and Implementation and
Preliminary Design Imlmntto ImplementationOprto operation -.
(Experimental testing)
Figure 1-2: Project Timeline Highlighting C, D, I, 0 Elements
1.4.4
Present Thesis in the Light of the Overall Project
This thesis represents the first year effort of the MIT contribution to the joint project. The main purpose of this work is to conceive and develop the tools that will be further used in consecutive years of the project. Also, an analysis will be conducted using the developed tools, to define pre-liminary design guidelines for enhanced compressor stability. Even though only the "Conceive" and "Design" parts of CDIO are developed on a joint project level, the entire CDIO methodology is im-plemented in this thesis. The "Conceive" approach establishes stability as a prime design objective in the design process. In order to apply this concept, an existing multi-actuator disk dynamic system model [16] is adapted to the candidate compressor. The high number of cases studied as well as the increased complexity of the problem requires a new interface to be designed to bring flexibility and commonality as well as code-enhancements to render efficiency in the computations. This tool development work forms most of the "Design" component of the thesis. The tool hereby adapted is
then implemented ("Implement" phase). Testing and validation of these tools are performed before a sensitivity analysis can be conducted under the "Operate" phase.
1.5
Objectives
This thesis focuses on:
* Estimating the impact of a surge event and of reduced-stability margin engines on an airline's operations and costs;
9 Establishing a detailed outline of requirements for the mean-flow calculation and the necessary
form of input data for the compressor dynamic system model [16];
* Analyzing the blade-row interaction effects on stability in a multi-stage environment;
* Establishing design guidelines for a compressor with increased dynamic stability.
1.6
Contributions
The contributions of this thesis can be summarized as follows:
1. Analysis of the system aspects of a surge event: operational and cost impacts for an airline,
certification authorities recommendations on engine stability, derived industry design practices;
2. Implementation of an existing dynamic compressor system model for a multi-stage environ-ment;
3. Integration of this dynamic analysis compressor system model into a robust and efficient tool
to analyze compressor stability;
4. Determination of detailed outline of requirements for the mean-flow calculation and for the input data necessary for the dynamic compressor system model;
5. Dissection of the system dynamics in the light of blade-row interaction in a multi-stage
envi-ronment and preliminary investigation of the eigenvalue structure of the compression system dynamics;
6. Assessment of the effects of blade-row inertia, blade-row performance and axial coupling on
multi-stage compressor dynamic stability;
1.7
Thesis Organization
First, in Chapter 2, a very high-level analysis of surge is conducted to describe how surge is per-ceived from an operational, cost and regulatory point of view. Chapter 3 adapts and implements an existing two-dimensional linearized incompressible unsteady aerodynamic model [16] to a 3-stage high-pressure compressor to investigate the dynamic pre-stall behavior of the machine. Then, Chap-ter 4 presents a more thorough dynamic analysis conducted on a standard repeating-stage compressor and assesses the impact of design changes on dynamic stability. Finally, Chapter 5 summarizes the results and proposes future work to be done.
Chapter 2
System Aspects of Compressor
Stability
This chapter presents the consequences of surge from an operational, a cost and a regulatory per-spective. By highlighting the potential harm caused by a surge event, this chapter strongly assesses the need for a new design approach to compressor stability.
2.1
Surge and Stall from an Operability Point of View
This section describes the manifestation of surge events from a flight crew point of view [7]. The first manifestation of surge at high-power engine settings during take-off is an audible bang, far beyond any other engine noise level, accompanied by aircraft yaw and vibrations. In severe cases, reverse flow caused by surge can be accompanied by visible flames propagating out of the engine inlet and the core exhaust nozzle.
Engine surge can be classified into four categories: * Single, self-recovering surge cycle;
" Multiple surge cycles prior to self-recovery;
" Multiple surge cycles requiring pilot action in order to recover;
" Non-recoverable surge.
If the engine does not recover from surge without crew intervention, the pilot needs to cut back the thrust lever until the engine recovers and then slowly advance it again. If surge is initiated again, engine power must be cut to idle or even shutdown. In most cases engine surge does not cause severe
engine damage. However, sustained surge might overheat the turbine and induce compressor blade vibrations that can lead to an internal object damage (IOD).
From a regulation authority point of view (cf.FAA [91), surge events such as the ones discussed above are often classified as "Group 3 take-off surge" (Group 3 corresponding to the most severe type of surge, more likely to occur during take-off.) The FAA uses this term to refer to engines that experiences any of the following symptoms:
" Unusual engine noise, such as rumble and loud bangs; " Unstable engine parameters (N1, N2, EPR, fuel flow); " Increase in EGT;
" Flames out of the inlet, the exhaust or both.
Engine surge can be initiated by various internal events such as engine deterioration or enlarged tip clearance, as well as by external causes such as icing, foreign object ingestion or inlet distortion.
These events can trigger aerodynamic instabilities that develop into rotating stall and surge. Before the inception of rotating stall and surge is discussed more thoroughly in Chapters 3 and 4, a brief study of the consequences of an in-flight surge is conducted, both from an operational and a financial perspective, to assess how critical dynamic instability can be during the lifetime of an engine.
2.2
Consequences of Rotating Stall and Surge
2.2.1 Operational Consequences
The operational consequences are subdivided into two categories:
" The operational consequences immediately following the event, based on the decisions made by the pilots, the air traffic control, and the airline;
" The long term operational consequences, based on the decisions made by the regulation
au-thorities to face the issue and avoid its recurrence.
Immediate Operational Consequences
A standard scenario is discussed here, based on actual occurrences of surge events. The assumption
is made that surge occurs during take-off or at the early stages of a climb. In this case, after surge is detected by the flight crew, the decision is usually made to return to the airport. If the total weight of the aircraft after take-off exceeds the Maximum Landing Weight (MLW), a significant amount
of the onboard fuel has to be dumped before the landing can be conducted. Once the airplane is grounded, the passengers have to be reallocated to other flights, and, if needed, rebooked to flights of other airlines. In the case of insufficient seat availability, passengers may have to wait until the following day to take their flight. The flight crew also has to be reassigned to an aircraft in the new flight schedule after the original flight schedule is disrupted.
After the incident, the affected engine has to undergo inspection, and, if severe damage is detected, the engine has to be replaced. In certain cases of light damage, the maintenance can be performed on wing. The repair work is performed by the airline's mechanics, who have to be flown on site if the location of the incident does not have a maintenance base for the airline. Additional ground tests are performed on the new engine before the airplane can return to service. If the engine that experienced surge has been removed from wing, it is then shipped to one of the airline's maintenance facilities and has to undergo further inspections, repairs, and testing before it can go back to service. The consequences of surge events strongly depend on other factors, such as the location of the surge occurrence (i.e., with or without a maintenance facility, or an available spare aircraft/engine) as well as the load factor of the flights used to reallocate the passengers, that, if too high, can cause severe cascade effects in passenger reallocation (the passengers of the canceled flight taking the seats of booked passengers on another flight, the later also rebooked on an additional flight etc.)
Long-Term Operational Consequences
The consequences analyzed here are based on the decisions made by the certification authorities to avoid the recurrence of surge events, usually after a dramatic event has demonstrated the limitations of the pre-existing regulations. The present study extensively uses the Airworthiness Directive (AD)
2001-08-52 issued by the FAA [6] (updated in [9]), which deals with low-stability engines. In this AD, four requirements are stated for airlines operating engines subjected to this AD. The airlines
have to:
" Limit the presence of the potentially reduced-stability engines to no more than one per aircraft; " Remove specified engines from service before they reach their cycle limits;
" Refurbish all the potentially affected engines before they return to service;
" Make sure that the cycle mismatch between the HPC and the HPT of any of these engines
does not exceed 1500 cycles.
In the following section, the cost associated with the events described in this section is estimated, to assess the financial impact of a surge event.
2.2.2 Cost Consequences
The costs associated with the events described above can be divided into three categories: costs related to the handling passengers, costs directly associated with the aircraft, and other costs related to the airline.
Passenger Related Costs
As mentioned above, passengers have to be reallocated to other flights. In the case where seats are available on the airline's other flights, no additional expenses incur. If the flights are full and pas-sengers have to be rebooked on other airlines, an extra charge may apply. However, the reallocation of passengers between airlines is a standard practice so that airlines alternatively request and offer extra seats. The balancing effect over the year may therefore reduce the net cost for the airline. In some special circumstances, however, due to high load factors, usually during peak periods, passengers may have to wait one day before they are reallocated, which implies hotel and meal compensations to be paid by the airline. In addition, they may be reallocated on overbooked flights, thus generating overbooking fees for some of the newly-affected passengers (cascade effect). Conse-quently, a very rough estimate of costs associated with handling passenger can be made based on a worst case scenario. If a standard hotel and meal fee of $200 is compared to the average ticket price on a wide-body aircraft, which is about $250, the worst case corresponds to the case when all passengers have to be refunded. Based on a 250-passenger aircraft with an average ticket price of
$250, the passenger related costs would be $62,500.
The airline may also have to bear losses in the long run due to a reduction of the repurchase intent rate associated with a public image of low safety that may affect the airline in the period following the incident. However, this effect is very difficult to be estimated and will not be accounted for here.
Aircraft Related Costs
Aircraft costs in the event of surge are directly associated with the aircraft fuel, parts and mainte-nance.
The cost related to the fuel dumped can easily be estimated. For the present study, a fully-loaded twin-engine wide-body aircraft is selected. Assuming surge at take-off or in the early stages of the climb-out phase, the fuel burned between take-off and the occurrence of surge can be neglected and thus the amount of fuel to be dumped is equal to the difference between MTOW and MLW. Based on an average of $1/gallon of fuel, the net cost ranges between $10,000 and $20,000.
As for maintenance costs, having to fly the mechanics to the aircraft is a negligible source of expenses, as they generally travel on the airline's flights. Nevertheless, the farther the mechanics are located from the aircraft, the higher the cost associated with aircraft unavailability. Engine
inspection cost for a suspect engine is based on an industry standard of fifteen man-hours. Ground testing for a replacement engine is based on an industry standard of four man-hours, with a labor rate of $55/hr plus the fuel and oil needed to run the engine for four hours. The FAA [9] specifies that any engine that had a Group 3 surge event must undergo a High Pressure Compressor (HPC) overhaul with an estimated cost of $400,000. In the case of further engine damage, a complete engine overhaul may be required, with an approximate cost of $2,000,000. Table 2.1 summarizes aircraft-related costs.
Source Lower estimate (in US $) Higher estimate (in US $)
Fuel Dump 10,000 20,000 Engine Inspection 825 825 Engine Change 2,000 5,000 Ground Testing 4,000 4,000 HPC or Engine Overhaul 400,000 2,000,000 Subtotal 416,825 2,029,825
Table 2.1: Aircraft Costs Related to a Surge Event
Airline Related Costs
The term "airline costs" refers to general costs related to a surge event, which are usually absorbed into the overall cost structure of the airline.
Short-Term Costs In the present study, the location of the surge event occurrence is a deter-mining driver for costs.
First, the cost of the shipment of an engine from and to the aircraft directly scales with the distance between the aircraft and its maintenance base. For emergency reasons, the cost of getting the engine to the aircraft is much higher than the cost to bring the damaged engine to the maintenance base. The standard cost of a shipment is about $10,000 for a domestic shipment, $30,000 for a transat-lantic shipment and up to $200,000 for a very long range shipment.
Second, the cost of aircraft unavailability is directly proportional to its unavailable flight time, which is mainly driven by the time required to replace the engine, including the time necessary to ship the new engine. Based on an approximate daily revenue which ranges between $60,000 and $100,000 for a wide-body aircraft (1 to 1.7 flight/day on average with an average revenue of $62,500 per flight [2]) and the aircraft downtime ranging from one to four days, the total short-term costs can accrue
up to $400,000.
Concerning the flight crew reallocation, the cost of flying them to their new aircraft is essentially negligible, for the same reasons as the ones mentioned for the mechanics.
The airline-related costs are summarized in Table 2.2.
Source Lower estimate (in US $) Higher estimate (in US $)
Cost of aircraft unavailability 60,000 400,000
Shipment of new engine to aircraft 0 200,000
Shipment of old engine to maintenance base 0 25,000
Subtotal 60,000 625,000
Table 2.2: Surge Event Related Airline Costs
Long-Term Recurring Costs Some indirect costs are more difficult to estimate since they are embedded into the overall cost structure of the airline. The costs related to the application of an
AD are of this type. First, an AD implies direct costs in terms of extra inspection and maintenance.
Estimates made by the FAA ([1] & [9]) show that 35% of the potentially affected engines would re-quire annual on-wing testing at a cost of $2,000 per test. Another 17% of the engines would rere-quire annual off-wing testing, at a cost of $15,000 per test. Based on a failure rate of 12% for this off-wing test, 2% of the total number of engines would have to undergo high pressure compressor overhaul, at a unit cost of $400,000. Finally, unscheduled removal would affect 2% of the potentially affected engines, costing $5,000 each.
The results presented in Table 2.3 indicate an annual cost of about $11,350 per affected engine.
Maintenance Event Type Probability Event Cost (in US $) Average Cost per Engine (in US $)
On-wing Testing 0.35 2,000 700
Off-wing Testing 0.17 15,000 2,550
HPC Overhaul 0.02 400,000 8000
Unscheduled Removal 0.02 5,000 100
TOTAL 11,350
Table 2.3: Long Term Recurring Costs Associated with Low-Stability Engines
More spare engines may also have to be purchased to operate the same fleet, due to early engine retirements and the restriction of one potentially reduced-stability engine per aircraft. However, based on the number of engines subject to this directive (about 50 out of 2115 existing engines of this affected engine type), the probability of having two potentially reduced-stability engines on the same twin-jet is very low (on the order of 0.05%) and consequently, the associated expenses can be considered minor. To a lesser extent, the inventory and supply chain issues related to the AD requirement may also generate additional costs.
Total Costs: Estimation of Engine Surge Related Costs for a Standard US Airline
For simplicity, and due to the data availability from the FAA, a simulated case study is conducted here for a standard US airline with 25% market share.
First, the total cost associated with one surge event is computed, based on the cost breakdown of the previous paragraphs. The results are shown in Table 2.4.
Source Lower estimate (in US $) Higher estimate (in US $)
Passenger related costs 0 62,500
Aircraft related costs 416,825 2,829,025
Airline related costs 60,000 625,000
Surge Event Total Cost 476,825 3,516,525
Table 2.4: Total Costs Associated with a Surge Event
Second, the total cost associated with low-stability engines are compiled for a one-year period, in the case of the simulated airline. Given the airline size, the FAA [9] estimates the total number of surge events to be two events per year. In addition, if the assumption is also made that the airline owns 25% of the engines with reduced stability, the airline's annual long term recurring costs are estimated to be $2,000,000. Table 2.5 summarizes the results.
Source Lower estimate (in US $) Higher estimate (in US $)
Direct costs associated with 2 surge events 953,650 7,033,050
Recurrent costs (Long-Term) 2,000,000 2,000,000
TOTAL ANNUAL COST 2,953,650 9,033,050
Table 2.5: Annual Airline Costs
The previous results show that the annual penalty the airline has to pay for these reduced-stability engines can reach almost $10 million. For the thrust class considered, this is the price of a new engine. Visualizing this result in terms of actual operating revenue is very insightful. Given the airline size, the number of aircraft powered by the low-stability engine type is estimated to be about 50. With the following assumptions of one flight per aircraft per day, $62,500 of revenue per flight and a 10% net margin, it takes the aircraft powered by low-stability engines about a month to generate a revenue of $10 million. Thus, the airline essentially operates these aircraft one month of the year (i.e. about 8% of the year) just to cover the costs for the low stability of their engine fleet. This situation is even more unacceptable in times when the US airline industry is struggling for survival.
These conclusions are delineated, of course, without even considering the catastrophic impact that a hull loss due to an engine surge may cause (aircraft loss, fatalities, lawsuits etc.)
One way to reduce the likelihood of a surge event and its dramatic consequences is to make early decisions in the design process to consider stability as a primary design objective. Another way to reduce the probability of such events is for certification authorities to impose safer design practices on the engine manufacturers. These two possibilities are briefly described below.
2.2.3
Consequences for Flight Regulation
In addition to the operational directives the certification authorities publish (e.g., the AD previously discussed), these authorities also provide general recommendations and requirements regarding en-gine certification. In the US, the Federal Aviation Regulation (FAR) Part 33 [8] specifies the conditions engines must meet in order to be certified. An excerpt from FAR Part 33 related to surge and stall states:
33.65 Surge and stall characteristics.
When the engine is operated in accordance with operating instructions required by
33.5(b), starting, a change of power or thrust, power or thrust augmentation, limiting
inlet air distortion, or inlet air temperature may not cause surge or stall to the extent that flameout, structural failure, overtemperature, or failure of the engine to recover power or thrust will occur at any point in the operating envelope.
As shown in the statement above, these recommendations are very general and do not impose strict design practices on the manufacturers. However, based on experience, standard design prac-tices have been developed in industry and are further described next.
2.2.4
Surge Event Consequences for Design Practice
In order to address the requirements dictated by the certification authorities, engine manufacturers have adopted a conservative measure for surge and rotation stall called the "surge margin." A large enough surge margin is expected to guarantee stable operations throughout the flight envelope. One definition of surge margin, as generally done by industry, (cf. Figure 2-1) is
Surge margin = surge - operating (2.1)
Koperating |ncorr=constant
The surge margin also accounts for uncertainties related to inlet distortion, transient engine oper-ations, engine deterioration and possible damages due to foreign object ingestion.
ltsurge
Ktoperating - -- - - -- - - - - - - - - Operating Point
I 0.
Pressure Ratio
Corrected Mass Flow
Figure 2-1: Compressor Map Illustrating Surge Margin
Current industry practice is to have a surge margin of the order of 20% to 25% for commercial engines. A surge margin breakdown for a high-pressure compressor at a fixed operating point can be found in Williams [19] and is summarized in Table 2.6.
Table 2.6: Surge Margin Breakdown for a HPC for a Fixed Operating Point
However, unlike the operating pressure ratio 7operating, the pressure ratio where surge is initiated
7rsurge is difficult to predict. In current design process, surge line prediction still heavily relies on
empirical correlations as stated by Cumpsty [5]:
"At present the most reliable method of estimating the stall or surge point is to use information obtained from tests of similar machines."
However, surge margin is a rather "static" metric, and is affected by many uncertainties such as inlet distortion, transient operation, icing, and engine deterioration. Therefore, based on the knowledge developed on compressor dynamic stability, a more adequate metric for stability should account for the dynamic behavior of the compressor. Recently, new tools such as a simple
one-Cause Surge margin utilized
Inlet Distortion 7 %
Engine to engine scatter 3.5 %
Deterioration 5 %
Control tolerances 2 % Reynolds number effects 1 %
dimensional unsteady model were developed and applied to predict the surge point on a compressor characteristic. However, these methods rely heavily on the performance curve and can only be a first step towards new stability analysis tools.
A more elaborate tool thus has to be used to predict the surge limit. In this thesis, an existing
two-dimensional dynamic compressor modeling tool [16] is implemented on an existing compressor to assess its dynamic stability (Chapter 3). Design guidelines to enhance compressor stability in the light of dynamic system stability rather than based on surge margin are then delineated in Chapter
Chapter 3
Tool Development and Derived
Requirements
3.1
Structure of the Model
In order to capture the dynamic flow behavior near stall, the Dynamic System Model developed
by Spakovszky [16] describes the flow as modal oscillations (cf 1.1.2) of the aerodynamic quantities
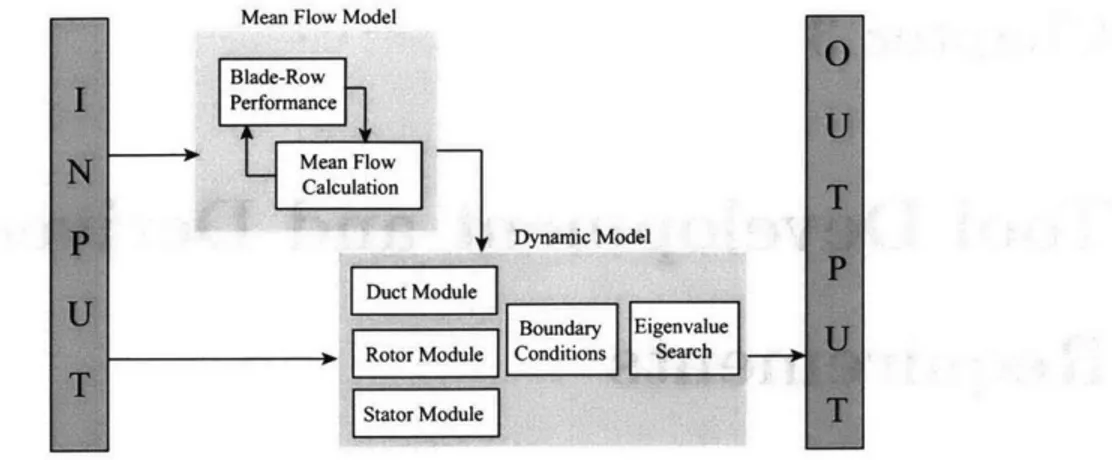
(velocity and pressure) around a mean steady state. The equations of motion of the flow, as discussed in 3.3.1, thus involve the mean-flow velocities and pressure. As a consequence, this information, determined by a mean-flow calculation, has to be fed into the model in order to determine the behavior of the unsteady aerodynamic parameters. The structure of this tool that is expanded here (cf Figure 3-1) is therefore divided into two main parts: the Mean-Flow Model calculation and the Dynamic Model calculation. They are presented in more detail in Sections 3.2 and 3.3, respectively.
3.2
Mean-Flow Calculation
3.2.1
Background and Inputs
In order to provide the necessary inputs to the dynamic model, a mean-flow calculation has to be conducted. To generate these inputs, a compressible mean-flow analysis of the high-speed compres-sor is selected, even though the dynamic comprescompres-sor model is incompressible. This compressible mean-flow calculation gives a better representation of the mean-flow parameters for the high-speed, variable duct area candidate compressor. Since the dynamic model requires as input one-dimensional mean-flow data, a one-dimensional compressible mean-line code is implemented, all thermodynamic quantities being computed at the Euler radius (the radius that divides the annulus into two equal
Mean Flow Model Blade-Row Performance Mean Flow Calclto Dynamic Model IDuct Modue Boundary Eigenvalue
Rotor Module Conditions Search
Stator Module
Figure 3-1: Overall Structure of the Model
areas) for the different stages.
The mean-flow calculation uses the data provided by Snecma Moteurs for the CREATE com-pressor. CREATE is a high-speed 3-stage compressor, with six blade-rows with different designs, a variable duct area and different inter blade-row gap lengths.
The data provided by Snecma Moteurs for this compressor are:
" The three-dimensional geometry;
" The total pressure loss coefficients as a function of inlet flow angle for each blade-row at design
speed;
* The inlet conditions.
The compressible mean-flow calculation forms an implicit problem and thus an iterative blade-row
by blade-row analysis is conducted. This procedure is described in more detail in Appendix A.
3.2.2
Blade-Row Correction Factors and Validation
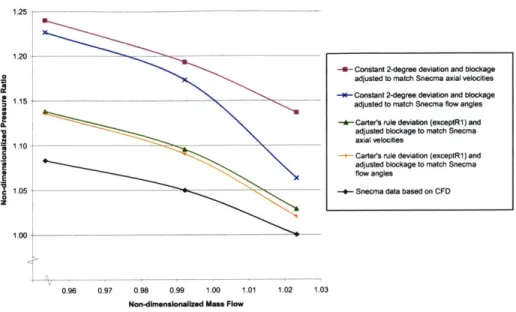
The described procedure is implemented for the CREATE compressor and the results are compared to performance data provided by Snecma Moteurs. A higher pressure ratio is observed compared to the Snecma data based on CFD. Consequently, to represent the compressor performance closer to the CFD based data, two correction factors are implemented: a flow deviation correction and a blockage correction.
Effect of Flow Deviation
The flow at the exit of the blade-rows was assumed to follow the mean exit blade metal angle. However, because of boundary layer separation, in practice, the flow usually deviates by an angle 6.
Figure 3-2: Deviation Angle at the Exit of a Blade-Row
Given the high solidity of the blading, a constant two-degree deviation is first assumed. However, with these settings, the pressure-ratios obtained are about 15% higher than the pressure-ratios from Snecma (cf. Figure 3-3). Therefore, a semi-empirical deviation model, based on Carter's rule, is implemented, assuming parabolic arc blade profiles. The deviation angle can be written as
= m= VO) -(1 -,32) , (3.1)
where me(ys) is an empirical coefficient that depends on the stagger angle, 31 -
#2
is the turning ando-
is the solidity of the blade-row.Effect of Flow Blockage
A correction factor that accounts for blockage is included in the mean-flow calculation. In the present
model, the sensitivity of the total-to-total pressure ratio to blockage rate changes is small.
Consequently, in the following calculations, the effect of deviation will be included, and the blockage coefficients will be adjusted to match the data from Snecma: either the inlet flow angles for each blade-row or the axial velocity at the inlet of each blade-row (Note: This research studies the compressor pre-stall dynamics at mass flows close to the stability limit. Thus, the deviation and blockage factors are adjusted such that the blade-row inlet flow angles, or the axial velocity, provided by Snecma Moteurs are matched for the lowest mass flow points on the speed line.)