HAL Id: insu-01145299
https://hal-insu.archives-ouvertes.fr/insu-01145299
Submitted on 15 Oct 2015
HAL is a multi-disciplinary open access
archive for the deposit and dissemination of
sci-entific research documents, whether they are
pub-lished or not. The documents may come from
teaching and research institutions in France or
abroad, or from public or private research centers.
L’archive ouverte pluridisciplinaire HAL, est
destinée au dépôt et à la diffusion de documents
scientifiques de niveau recherche, publiés ou non,
émanant des établissements d’enseignement et de
recherche français ou étrangers, des laboratoires
publics ou privés.
An examination of the long-term CO records from
MOPITT and IASI: comparison of retrieval methodology
Maya George, Cathy Clerbaux, Idir Bouarar, Pierre-François Coheur, Merritt
N. Deeter, David P. Edwards, G. Francis, John C. Gille, Juliette
Hadji-Lazaro, Daniel Hurtmans, et al.
To cite this version:
Maya George, Cathy Clerbaux, Idir Bouarar, Pierre-François Coheur, Merritt N. Deeter, et al.. An
examination of the long-term CO records from MOPITT and IASI: comparison of retrieval
methodol-ogy. Atmospheric Measurement Techniques, European Geosciences Union, 2015, 8 (10), pp.4313-4328.
�10.5194/amt-8-4313-2015�. �insu-01145299�
www.atmos-meas-tech.net/8/4313/2015/ doi:10.5194/amt-8-4313-2015
© Author(s) 2015. CC Attribution 3.0 License.
An examination of the long-term CO records from MOPITT and
IASI: comparison of retrieval methodology
M. George1, C. Clerbaux1,2, I. Bouarar3, P.-F. Coheur2, M. N. Deeter4, D. P. Edwards4, G. Francis4, J. C. Gille4, J. Hadji-Lazaro1, D. Hurtmans2, A. Inness5, D. Mao4, and H. M. Worden4
1Sorbonne Universités, UPMC Univ. Paris 06, Université Versailles St-Quentin, CNRS/INSU, LATMOS-IPSL, Paris, France 2Spectroscopie de l’Atmosphère, Chimie Quantique et Photophysique,
Université Libre de Bruxelles (U.L.B.), Brussels, Belgium
3Max Planck Institute for Meteorology, Hamburg, Germany
4Atmospheric Chemistry Observations and Modeling, National Center for Atmospheric Research, Boulder, CO, USA 5European Centre for Medium-Range Weather Forecasts, Reading, UK
Correspondence to: M. George ([email protected])
Received: 12 February 2015 – Published in Atmos. Meas. Tech. Discuss.: 23 April 2015 Revised: 14 August 2015 – Accepted: 8 September 2015 – Published: 15 October 2015
Abstract. Carbon monoxide (CO) is a key atmospheric
com-pound that can be remotely sensed by satellite on the global scale. Fifteen years of continuous observations are now avail-able from the MOPITT/Terra mission (2000 to present). An-other 15 and more years of observations will be provided by the IASI/MetOp instrument series (2007–2023 >). In or-der to study long-term variability and trends, a homogeneous record is required, which is not straightforward as the re-trieved quantities are instrument and processing dependent. The present study aims at evaluating the consistency between the CO products derived from the MOPITT and IASI mis-sions, both for total columns and vertical profiles, during a 6-year overlap period (2008–2013). The analysis is per-formed by first comparing the available 2013 versions of the retrieval algorithms (v5T for MOPITT and v20100815 for IASI), and second using a dedicated reprocessing of MO-PITT CO profiles and columns using the same a priori in-formation as the IASI product. MOPITT total columns are generally slightly higher over land (bias ranging from 0 to 13 %) than IASI data. When IASI and MOPITT data are re-trieved with the same a priori constraints, correlation coeffi-cients are slightly improved. Large discrepancies (total col-umn bias over 15 %) observed in the Northern Hemisphere during the winter months are reduced by a factor of 2 to 2.5. The detailed analysis of retrieved vertical profiles compared with collocated aircraft data from the MOZAIC-IAGOS net-work, illustrates the advantages and disadvantages of a
con-stant vs. a variable a priori. On one hand, MOPITT agrees better with the aircraft profiles for observations with persist-ing high levels of CO throughout the year due to pollution or seasonal fire activity (because the climatology-based a pri-ori is supposed to be closer to the real atmospheric state). On the other hand, IASI performs better when unexpected events leading to high levels of CO occur, due to a larger variability associated with the a priori.
1 Introduction
Measuring the variability and trends in carbon monox-ide (CO) on the global scale is essential as it is an ozone and carbon dioxide precursor, and it regulates the oxidizing ca-pacity of the troposphere through its destruction cycle involv-ing the hydroxyl radical (OH) (Duncan and Logan, 2008). The background CO atmospheric loading varies as a func-tion of season and latitude and is significantly perturbed by human activities related to combustion processes: car traffic, heating/cooking systems, industrial activities, etc. CO accu-mulates in the Northern Hemisphere (NH) during the win-ter months due to low solar insolation corresponding to less chemical destruction, and concentrations peak in early spring each year. Natural and human-induced fires also affect the CO budget, in particular in boreal areas where intense fires occur during the dry season and in the tropics where large
4314 M. George et al.: Long-term CO records from MOPITT and IASI
emissions are linked to agricultural practices (Edwards et al., 2006). CO emissions inventories still present large uncertain-ties (Streets et al., 2013), and separating anthropogenic and biomass burning contributions is essential for attributing CO long-term trends (Strode and Pawson, 2013).
Due to its moderate lifetime (1–3 months), CO is an excel-lent tracer of tropospheric pollution, which can often travel far downwind, even between continents (HTAP, 2010). CO can easily be measured by infrared remote sensing as it com-bines high variability and significant perturbations over back-ground concentration levels with a strong infrared absorption signature. Over the last 2 decades, Earth-observing satellites have revolutionized our ability to map CO and to understand its evolving concentration on regional and global scales. At the moment several satellite missions using the thermal in-frared (TIR) spectral range to sound the atmosphere are de-livering CO data, including MOPITT on EOS/Terra launched at the end of 1999 (Drummond and Mand, 1996; Deeter et al., 2003), AIRS on the EOS/Aqua satellite launched in 2002 (Aumann et al., 2003; McMillan et al., 2005), TES on the EOS/Aura satellite launched in 2003 (Beer, 2006; Rinsland et al., 2006), and IASI on the EPS/MetOp-A satellite launched in 2006 (Clerbaux et al., 2009; George et al., 2009). All these missions are maturing and have exceeded their foreseen life-times. More recently, the CrIS (Gambacorta et al., 2014) and IASI/MetOp-B instruments were launched onboard the SNPP and MetOp-B satellites, in 2011 and 2012, respec-tively.
Each of these thermal infrared sensors has a dedicated CO retrieval algorithm that was improved over time and has ben-efited from cross comparisons with other products. The opti-mal estimation (OE) retrieval approach (Rodgers, 2000) is a widely used inverse method in atmospheric sciences to derive geophysical products from instrument measurements (e.g., radiances). It regularizes the under-determined inverse prob-lem and provides the best estimates given the observations and some prior knowledge of the atmospheric state. For MO-PITT and IASI, one CO vertical profile and its associated integrated total column are retrieved at each sounding loca-tion and the OE provides useful diagnostic variables such as the averaging kernel matrix (the sensitivity of both the in-strument and the retrieval to the abundance of CO at differ-ent altitudes), the degrees of freedom for signal (DOFS, in-formation content of the retrieval, given by the trace of the averaging kernel matrix) and the posterior error covariance matrix. The latter includes the contributions from the limited vertical sensitivity (smoothing error), from the instrumental noise, and from uncertainties to all other parameters included in the forward model (temperature profile, surface emissiv-ity, interfering gases, spectroscopy, etc.). The retrieved CO profile can be expressed as a linear combination of the true atmospheric profile and the a priori profile, weighted by the averaging kernel matrix, plus contributions from errors as-sociated with both the observation and the other parameters (see Rodgers (2000) for more details). A key element of the
retrieval process is the choice of the a priori, which con-sists of an expected profile (xa)and its associated
variance-covariance matrix (Sa), to constrain the retrieved CO profile
to fall within the range of physically realistic solutions (based on the known variability of this species).
Previous studies have inter-compared CO retrieved columns or profiles over specific areas and limited time pe-riods. Clerbaux et al. (2002) made a first comparison of the TES, MOPITT, and IASI retrieval algorithms to retrieve CO columns from a common nadir radiance data set, provided by the IMG/ADEOS thermal infrared instrument. Luo et al. (2007) compared, for 2 days in September 2004, TES-retrieved CO profiles adjusted to the MOPITT a priori with the MOPITT retrievals and also the adjusted TES CO profiles with the MOPITT profiles vertically smoothed by the TES averaging kernels. Warner et al. (2007) used the MOPITT a priori profile as AIRS first guess and showed global im-provements to the agreements between CO at 500 hPa from these two instruments, for the 2-month time period of the INTEX-A campaign. Ho et al. (2009) applied TES a priori profiles and covariance matrix to a modified MOPITT re-trieval algorithm, for a 1-month study. George et al. (2009) compared the IASI CO columns with MOPITT, AIRS and TES CO columns, adjusted with the IASI a priori assump-tions, for three different months (August 2008, November 2008 and February 2009) and on the global scale. Illingworth et al. (2011) compared IASI CO with MOPITT CO data over a localized region of Africa, for 1 day. They first retrieved the MOPITT profiles using IASI a priori assumptions and then applied the averaging kernels resulting from these new MO-PITT retrievals to the IASI CO profiles. Finally, Worden et al. (2013) examined hemispheric and regional trends for CO from all four missions, from 2000 through 2011.
The present study compares the CO record from MOPITT and IASI on the global scale, in order to setup a framework for building a consistent long-term data set. These two sen-sors together already provided a 15-year record of data, in-cluding 6 years of common observation (2008–2013). The analysis is performed on both retrieved total columns and vertical profiles, and focuses on identifying differences in the retrievals due to a priori assumptions. Extended compar-ison is performed at several locations, over the 6-year over-lap period, representative of diverse geophysical situations. Section 2 describes the MOPITT and IASI instrument char-acteristics, as well as the current retrieval algorithms and CO products. Section 3 compares the total columns for the 2008– 2013 period, first using each retrieval algorithm, and then us-ing the IASI a priori information to constrain the MOPITT retrievals. Section 4 details how the a priori assumptions im-pact the profile shape. A comparison with aircraft CO mea-surements from the IAGOS program is also presented. Sec-tion 5 concludes the paper and provides perspectives for the future.
2 MOPITT and IASI data
2.1 The instruments
2.1.1 Orbit, geometry and absorption spectral range
MOPITT and IASI are both sun-synchronous polar-orbiting missions designed to measure the spectral radiance at the top of the atmosphere, in the infrared spectral range, using a nadir viewing geometry. IASI and MOPITT cross the equa-tor at around 09:30 and 10:30 LT respectively, each morning and evening. To retrieve CO they take advantage of absorp-tion in the fundamental 1-0 CO rotaabsorp-tion-vibraabsorp-tion band cen-tered around 4.7 µm. Note that MOPITT also has the ability to measure the 2-0 overtone at 2.3 µm (Deeter et al., 2013). For consistency only the products derived from the inversion in the thermal infrared is compared in this paper.
2.1.2 Measurement technique
The MOPITT and IASI measurement techniques differ. MO-PITT uses gas filter correlation radiometry where the signal passes through cells containing gaseous CO in the instru-ment. These act as a high spectral resolution filter, match-ing the signature of the atmospheric gas. The transmission through the gas cells is modulated by varying either cell pressure (PMC) or cell length (LMC) to create signals cor-responding to high and low cell gas optical depth. These sig-nals are then averaged (A-sigsig-nals) or differenced (D-sigsig-nals) for use in the retrieval of CO profiles (Edwards et al., 1999; Drummond et al., 2010). The D-signal is only significant at the target gas absorption line frequencies, thus providing high spectral resolution information on CO abundance, while the A-signal provides information on the underlying scene such as surface temperature and emissivity. The two thermal infrared channels on MOPITT use PMC and LMC gas cells at different pressures to provide sensitivity to the pressure-broadened absorption of CO at different altitudes in the tro-posphere.
IASI is a Fourier Transform Spectrometer with a spec-tral coverage extending from 15.5 to 3.62 µm (645 to 2760 cm−1), associated with an imaging instrument. The spectrometer part of the instrument is based on a Michel-son interferometer, and the optical part consists of a cold box subsystem cooled to a temperature of 94 K that pro-vides measurements in three spectral bands with different photo-detectors; hot optics elements which form the heart of the interferometer; and a black body subsystem for cal-ibration views. The raw measurements performed by IASI are interferograms, which have to be processed to get radi-ances. To reduce the IASI transmission rate raw interfero-grams are transformed into radiometrically calibrated spec-tra before spec-transmission to the ground. The maximum opti-cal path difference is ±2 cm which leads to 0.5 cm−1 full width at half-maximum resolution (apodized). The
radiomet-ric noise below 2250 cm−1ranges between 0.1 and 0.3 K for
a reference blackbody at 280 K.
2.1.3 Horizontal sampling and vertical sensitivity
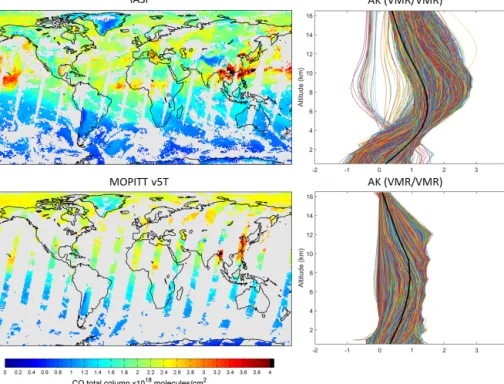
MOPITT observations are made with a four-pixel linear de-tector array which scans across the satellite track forming a 650 km-wide swath. At nadir, the footprint of each pixel is approximately 22 km by 22 km. Each cross-track scan is composed of 116 pixels. It produces nearly continuous cov-erage within that swath as the satellite flies. IASI views the ground through a cross-track rotary scan mirror which pro-vides ±48.3◦ ground coverage along the swath with views towards on board calibration sources every scan cycle during 8 s. The along track drift is compensated during the acqui-sition of each measurement. A total of 120 views are col-lected over a swath of ∼ 2200 km (30 arrays of 4 individual elliptical pixels – each of which of 12 km diameter at nadir, increasing at the larger viewing angles). Figure 1 illustrates 1-day/morning overpasses of typical CO total column maps measured by IASI and MOPITT in April 2013. For MOPITT the Earth’s surface is mostly covered in about 3 days. For IASI a global coverage is achieved twice a day, with some gaps between orbits around the equator. The two instruments are able to measure day and night, but clouds in the field of view can obstruct or reduce the visibility and prevent obser-vation of the lower layers of the atmosphere.
CO is retrieved at each location with a specific vertical sensitivity (characterizing the part of the atmosphere that is sounded), which is a function of wavenumbers (position and shapes of absorption lines), the overlaps with other absorb-ing species, the concentration profile of the species, the lo-cal surface temperature/emissivity, the temperature profile, and the instrumental specifications (noise and spectral reso-lution). For CO sensing in the TIR, the information is in the majority of the cases coming from the mid troposphere, as can be seen from the averaging kernels represented in Fig. 1. A key variable affecting sensitivity is temperature, with hot-ter surface providing generally a stronger signal relative to instrument and geophysical noise and thus allowing retrieval of CO with a higher accuracy. Another important parame-ter for sounding the lower part of the atmosphere is thermal contrast, which is the temperature difference between the sur-face and the near-sursur-face atmosphere, which determines the instrument sensitivity to the boundary layer (Deeter et al., 2007; Clerbaux et al., 2008). Note that bright land surfaces, such as ice and desert sand, sometimes lead to poor retrievals, because of insufficiently detailed knowledge of the surface emissivity and reflectivity (in the CO spectral range, solar radiation is not negligible).
2.2 Retrieved CO products
The MOPITT and IASI missions have now accumulated 15 and 7 years respectively of near-continuous global data for
4316 M. George et al.: Long-term CO records from MOPITT and IASI
Figure 1. CO total column global distributions (left) for 15 April 2013 (morning overpass) and the associated averaging kernels (right), for IASI (top) and MOPITT (bottom). The mean averaging kernel function is represented in black.
tropospheric CO. For this comparison we used the retrieval algorithm versions that were running in 2013 (MOPITT v5T and IASI FORLI v20100815) and the retrieved CO profile products, from which integrated total columns are derived, along with their associated averaging kernel matrices (for profiles) or vector (for columns). Only the data from the IASI/MetOp-A mission are analyzed here.
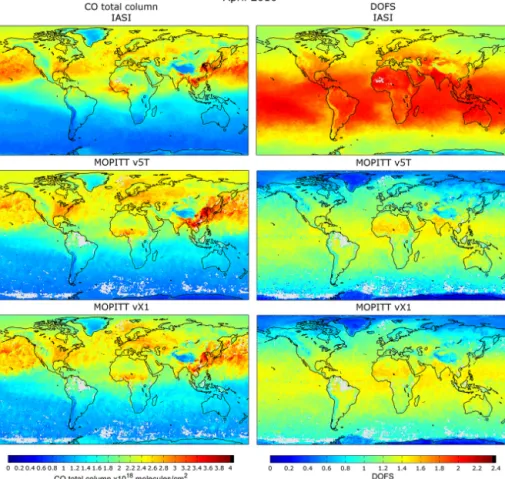
Table 1 provides a detailed description of the retrieved products, the a priori information, and the auxiliary data (temperature, emissivity, cloud content) for each mission. Note that the number of retrieved layers exceeds the num-ber of independent pieces of information available vertically and hence is not representative of the vertical resolution of the observation.
Previous validation studies using ground-based, aircraft and satellite data have shown that CO total columns from MOPITT and IASI are retrieved with an error generally be-low 10–15 % at mid and tropical latitudes, but can have larger errors in polar regions (MOPITT: Deeter et al., 2012, 2013; Emmons et al., 2004, 2009; IASI: George et al., 2009; Pom-mier et al., 2010; De Wachter et al., 2012; Kerzenmacher et al., 2012). The profiles are only weakly resolved, with < 1 to ∼ 2.5 independent pieces of information, depending mostly on the thermal state of the atmosphere. A DOFS of less than 1 indicates that the a priori information dominates the calculated total column, whereas a DOFS of 2 or more means that at least two independent partial columns can be retrieved. The highest sensitivity is achieved in the
inter-tropical region or at mid-latitudes during daytime and over land: for instance, there is a gain of 0.5 DOFS above the northern mid-latitude continental surfaces between the morn-ing and evenmorn-ing orbits (Hurtmans et al., 2012).
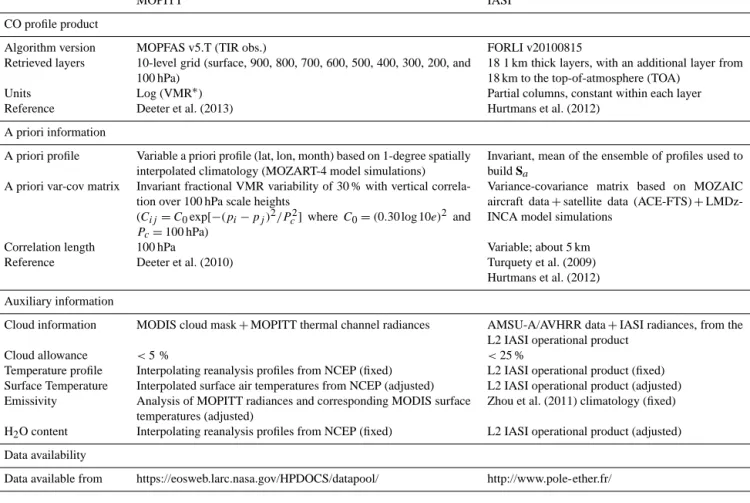
A major difference between MOPITT and IASI retrievals resides in the choice of the a priori, which is fixed for IASI, and variable for MOPITT. Having a variable or a static a priori has implications on the retrieved data set, with both choices presenting advantages and disadvantages as dis-cussed hereafter. Figure 2 represents the a priori profile(s) and the variance-covariance matrices (Sa), for MOPITT (in
September 2010) and for IASI (invariant). These were built using chemistry-transport model simulations and other avail-able data. For MOPITT v5T the a priori profile varies as a function of location and time of year and it is based on a monthly climatology of the MOZART-4 chemistry transport model. For each retrieval, the climatology is spatially and temporally interpolated to match the date and location of the observation. The fixed Samatrix allows for a 30 %
variabil-ity in each retrieved layer. The off-diagonal elements which define the correlations between the different layers are con-sistent with a short vertical correlation length which limits the spread of information from one layer to another (Deeter et al., 2010). On the contrary, the IASI a priori consists on a single profile, and a fixed Samatrix, built from a
climatol-ogy that uses LMDz-INCA model outputs, MOZAIC aircraft data and ACE-FTS satellite profiles (Turquety et al., 2009). The a priori profile is around 90 ± 20 ppbv from the surface
Table 1. Description of the MOPITT and IASI retrieved products.
MOPITT IASI
CO profile product
Algorithm version MOPFAS v5.T (TIR obs.) FORLI v20100815
Retrieved layers 10-level grid (surface, 900, 800, 700, 600, 500, 400, 300, 200, and 100 hPa)
18 1 km thick layers, with an additional layer from 18 km to the top-of-atmosphere (TOA)
Units Log (VMR∗) Partial columns, constant within each layer
Reference Deeter et al. (2013) Hurtmans et al. (2012)
A priori information
A priori profile Variable a priori profile (lat, lon, month) based on 1-degree spatially interpolated climatology (MOZART-4 model simulations)
Invariant, mean of the ensemble of profiles used to build Sa
A priori var-cov matrix Invariant fractional VMR variability of 30 % with vertical correla-tion over 100 hPa scale heights
(Cij=C0exp[−(pi−pj)2/Pc2]where C0=(0.30 log 10e)2 and
Pc=100 hPa)
Variance-covariance matrix based on MOZAIC aircraft data + satellite data (ACE-FTS) + LMDz-INCA model simulations
Correlation length 100 hPa Variable; about 5 km
Reference Deeter et al. (2010) Turquety et al. (2009)
Hurtmans et al. (2012) Auxiliary information
Cloud information MODIS cloud mask + MOPITT thermal channel radiances AMSU-A/AVHRR data + IASI radiances, from the L2 IASI operational product
Cloud allowance <5 % <25 %
Temperature profile Interpolating reanalysis profiles from NCEP (fixed) L2 IASI operational product (fixed) Surface Temperature Interpolated surface air temperatures from NCEP (adjusted) L2 IASI operational product (adjusted) Emissivity Analysis of MOPITT radiances and corresponding MODIS surface
temperatures (adjusted)
Zhou et al. (2011) climatology (fixed) H2O content Interpolating reanalysis profiles from NCEP (fixed) L2 IASI operational product (adjusted)
Data availability
Data available from https://eosweb.larc.nasa.gov/HPDOCS/datapool/ http://www.pole-ether.fr/
∗VMR = Volume Mixing Ratio.
Figure 2. (Left panel) Single a priori profile used by FORLI (in red) and a selection of MOPITT a priori profiles (in blue). The MOPITT profiles were picked over the globe in September 2010, one profile per 18◦latitude × 60◦longitude box. (Middle panel) a priori variance-covariance matrix (Sa) used by MOPFAS. (Right panel) a priori variance-covariance matrix (Sa) used by FORLI.
to the middle troposphere, and then smoothly decreases to 40 ppbv from 7 km up to 18 km. The Samatrix allows a
max-imum variability in the first layer (63 %), decreases to 35 % between 5 and 6 km, to 30 % (as MOPITT) between 6 and 10 km, and is increasing again, reaching 45 % between 15 and 16 km (see Fig. 2). Off diagonal elements are calculated from the ensemble profiles, and allow the information to be
projected from layers with high sensitivity to layers where the sensitivity is much weaker. The correlation length, there-fore variable, is about 5 km.
4318 M. George et al.: Long-term CO records from MOPITT and IASI
Figure 3. (Top panel) CO total column and DOFS distributions for April 2010, for IASI, (middle panel) MOPITT v5T and (bottom panel) MOPITT vX1. Day time data are averaged over a 1◦×1◦grid.
3 Comparison of CO total column products for
selected periods and regions
3.1 Global scale comparison
The comparison analysis is performed over the period ex-tending from January 2008 to December 2013, a period when MOPITT and IASI were both in operation. As the two instru-ments are not onboard the same platform, neither the mea-surement time nor the location are exactly the same.
The top and middle panels of Fig. 3 show the monthly av-erage for CO total column distribution (daytime data) for April 2010 along with the monthly average of the DOFS for the profile retrieval, for each instrument. As expected, it can be seen that large concentrations of CO are found near emission sources, and plumes are transported down-wind. In the NH elevated levels of CO are found above the west and east coasts of the USA, over Europe, and over East Asia. Due to long range transport, high CO concen-trations are also observed over the Northern Pacific and At-lantic oceans. In the tropics, elevated CO concentrations are found over the Guinea gulf countries (fires). Note that re-duced CO total columns at the location of mountains in North
and South America, as well as in the Himalayas, are due to surface height. Figure 4 provides in addition a time series of zonal mean total column CO over the entire period. NH concentrations peak in April, after accumulating during win-ter, and drop off gradually until late summer as the increas-ing solar insolation activates tropospheric chemistry (except over Siberia and Alaska fire regions where CO concentra-tions increase in summer). In the tropics the CO maximum is mainly associated with fires occurring in the Amazon basin, in central and southern Africa and sometimes over Australia, with maximum in August–November. Major fires occurring in Russia in August 2010 (Yurganov et al., 2011; Krol et al., 2013; R’Honi et al., 2013) and in Siberia in July 2012 (Ponomarev, 2013) are also visible on the zonal mean total column plots. The associated DOFS distributions (right pan-els of Fig. 3) illustrate the strong latitudinal variations due to temperature changes. The patterns look similar, but MO-PITT is showing lower associated DOFS than IASI. Note that as the instruments are intrinsically different we do not expect their DOFS values to be the same, and that both the a priori and the measurement covariance matrix (Se)will impact the
Figure 4. (Top panel) Daily zonal mean total column CO for MO-PITT (v5T) and (bottom panel) IASI, from 2008 to 2013. White strips correspond to days with no data (i.e., no MOPITT data be-tween 28 July and 29 September 2009, due to a cooler failure; or annually-scheduled MOPITT hot calibration/decontamination pro-cedures).
Even if the general horizontal spatial concentration pat-terns agree well, differences in the CO total columns can be seen when comparing the MOPITT and IASI data for the same areas/periods. In Fig. 5a representing the relative dif-ferences between IASI and MOPITT v5T for 1-month (April 2010), more than 70 % of the plotted data do not exceed 10 % (ratio calculated from the original grid), which is the CO ac-curacy specification for both missions (Pan et al., 1995; IASI Science Plan, 1998). Note that here we discuss the agree-ment between the two products, not the absolute accuracy which was evaluated in previous validation papers (e.g., see references provided in Sect. 2.2). MOPITT concentrations are generally larger than the IASI concentrations over land, in particular close to the location of strong emission sources (USA’s east coast, China). In contrast, IASI concentrations are generally larger over the ocean, between 30◦S and 45◦N,
and above 75◦N. Major fire events such as in Russia and
Siberia (in 2010 and 2012, respectively) appear to be more marked in the IASI data, and likewise for the fires occur-ring in Africa and Amazonia (Fig. 4). Note that over Antarc-tica, MOPITT DOFS are close to zero, indicating that the retrieved profile is close to the a priori profile.
It is the aim of this paper to investigate the possible sources of the differences between IASI and MOPITT data measured at the same location. We expect differences to be associated with (i) the different vertical sensitivity of the two sensors, (ii) with the a priori assumptions, (iii) the auxiliary data (e.g., surface temperature, temperature profiles, emissivity, cloud information, etc.) used in the retrieval process, as well as (iv) due to the different air masses sounded (different sound-ing angles, and between one and 2-hours time lag for the ob-servation time). Because the two instruments fly on different satellites, and rely on different auxiliary data sets (tempera-ture, clouds, etc.), only the differences associated with the a priori assumptions are studied in this paper.
3.2 Impact of the change of the a priori at global scale
To study the impact of a change of a priori on the retrieval we made a two-step comparison: first with the native retrieved data, and second with a dedicated retrieval chain set-up at the National Center for Atmospheric Research (NCAR), where the MOPITT data were reprocessed using the IASI a priori profile and Samatrix (hereafter referred to as
MO-PITT vX1). It is not possible to exactly convert the IASI
Sa matrix (expressed in altitude and partial columns) into
a MOPITT-compatible matrix (expressed in pressure levels and log(VMR)) since the IASI and MOPITT retrieval al-gorithms exploit mathematically inconsistent formats to ex-press the vertical distribution of CO molecules. Schemes for interpolating or extrapolating Samay also violate basic
prop-erties of covariance matrices, such as positive definiteness. Therefore we built a new a priori profile and covariance ma-trix from the original profiles ensemble used for the Sa
ma-trix generation in FORLI, on a common 35-pressure-layer grid (The MOPITT algorithm uses a priori information on a 35-level pressure grid to produce 10-level a priori profiles used in the actual retrieval algorithm).
The CO total column distribution measured by MOPITT in April 2010 and reprocessed with the IASI a priori constraints (MOPITT vX1) is shown in Fig. 3 (bottom part). Figure 5 provides the relative difference plots between IASI and MO-PITT v5T, MOMO-PITT v5T and MOMO-PITT vX1, as well as be-tween IASI and MOPITT vX1. Probability density functions by latitude bands are also represented (see Fig. 5d–m). It can be seen that the larger differences between the MOPITT v5T and vX1 concentrations are observed over the polar regions, where the v5T concentrations are larger than the vX1 ones at the North Pole (15 % on average between 60 and 90◦N) and smaller over Antarctica (−60 % on average between 60 and 90◦S). Between 60◦S and 60◦N, the differences
gen-4320 M. George et al.: Long-term CO records from MOPITT and IASI
Figure 5. (a) CO total column relative differences (%) between IASI and MOPITT v5T, (b) MOPITT v5T and MOPITT vX1 and (c) IASI and MOPITT vX1, for April 2010. The selected regions for which an in-depth study was performed are indicated with the green squares in (b) (also see Table 2 for the corresponding lon/lat information). On the right hand side (subplots d to m), probability density functions of relative differences by 30◦/40◦latitude bands, between MOPITT v5T and MOPITT vX1 (in black), between IASI and MOPITT v5T (in blue) and between IASI and MOPITT vX1 (in red).
erally range between −5 and 5 %, with the MOPITT v5T columns being larger than the vX1 ones above some emis-sions sources (USA’s east coast, Mexico and China). This can be explained by the MOPITT v5T climatology-based a priori, which is closer to the real atmospheric state, including higher levels of CO above emissions sources.
From Fig. 5a and c we see that the reprocessing of MO-PITT data slightly improves the agreement with IASI over the USA’s east coast and China, i.e., for regions where emis-sion sources are usually high. Between 20◦S and 20◦N and between 20 and 60◦N, the statistics are alike: when looking at the histograms (Fig. 5i–m), the probability density func-tions (100 × MOPITT v5T)/IASI and 100 × (IASI-MOPITT vX1)/IASI) look similar. But in the Southern Hemisphere between 20 and 60◦S the reprocessing of MO-PITT does not reconcile the differences with IASI, in fact the difference percentages are larger for the comparison with MOPITT vX1 (the probability density functions peaks at
−10 %, and it was −5 % with v5T), and it is the same at high northern latitudes (20 % for vX1 compared to 5 % for v5T). Finally, the differences are about the same amplitude
in Antarctica, but with the opposite sign (−30 % for vX1 and
+30 % for v5T).
These differences will be discussed in details in the next two sections.
3.3 Impact of the change of a priori on selected regions
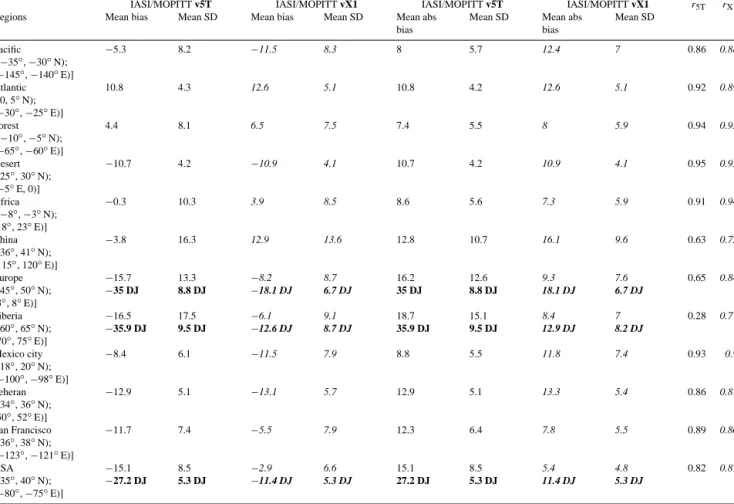
In order to investigate the observed differences, a detailed analysis was performed over the 6-year seasonal record, on 12 selected regions spread over the globe (listed in Table 2, and also identified by green boxes in Fig. 5b). The areas are representative of different ecosystems (water, sand, forest) and of various seasonal CO atmospheric content (cities, fire seasonal activity, background). The size of the grid boxes (5◦×5◦ for nine regions and 2◦×2◦ for three cities) was chosen so that the number of data is statistically significant for each instrument. For each box, 15-day averages of CO total column values are calculated, provided data from both MOPITT and IASI are available for each day. Typically, each grid box contains about 500 MOPITT and 850 IASI pixels. Table 2 lists the biases and the absolute biases, along with
Table 2. Column 1: name and localization (latitude; longitude) of the 12 selected regions. Columns 2 and 3: mean bias (%) over the 2008– 2013 time period and corresponding SD between IASI and MOPITT v5T CO total column. Columns 4 and 5 (in italic): the same but for IASI and MOPITT vX1. Columns 6 and 7: absolute mean bias (100 × (|IASI-MOPITT|)/IASI) and corresponding SD. Columns 8 and 9 (in italic): the same but for IASI and MOPITT vX1. For the “Europe”, “Siberia” and “USA” regions, the bold values correspond to the December and January months (DJ). Columns 10 (r5T) and 11 (rX1): correlation coefficients between IASI and MOPITT v5T and MOPITT
vX1, respectively.
IASI/MOPITT v5T IASI/MOPITT vX1 IASI/MOPITT v5T IASI/MOPITT vX1 r5T rX1 Regions Mean bias Mean SD Mean bias Mean SD Mean abs
bias
Mean SD Mean abs bias Mean SD Pacific [(−35◦, −30◦N); (−145◦, −140◦E)] −5.3 8.2 −11.5 8.3 8 5.7 12.4 7 0.86 0.88 Atlantic [(0, 5◦N); (−30◦, −25◦E)] 10.8 4.3 12.6 5.1 10.8 4.2 12.6 5.1 0.92 0.89 Forest [(−10◦, −5◦N); (−65◦, −60◦E)] 4.4 8.1 6.5 7.5 7.4 5.5 8 5.9 0.94 0.95 Desert [(25◦, 30◦N); (−5◦E, 0)] −10.7 4.2 −10.9 4.1 10.7 4.2 10.9 4.1 0.95 0.95 Africa [(−8◦, −3◦N); (18◦, 23◦E)] −0.3 10.3 3.9 8.5 8.6 5.6 7.3 5.9 0.91 0.94 China [(36◦, 41◦N); (115◦, 120◦E)] −3.8 16.3 12.9 13.6 12.8 10.7 16.1 9.6 0.63 0.72 Europe [(45◦, 50◦N); (3◦, 8◦E)] −15.7 −35 DJ 13.3 8.8 DJ −8.2 −18.1 DJ 8.7 6.7 DJ 16.2 35 DJ 12.6 8.8 DJ 9.3 18.1 DJ 7.6 6.7 DJ 0.65 0.84 Siberia [(60◦, 65◦N); (70◦, 75◦E)] −16.5 −35.9 DJ 17.5 9.5 DJ −6.1 −12.6 DJ 9.1 8.7 DJ 18.7 35.9 DJ 15.1 9.5 DJ 8.4 12.9 DJ 7 8.2 DJ 0.28 0.77 Mexico city [(18◦, 20◦N); (−100◦, −98◦E)] −8.4 6.1 −11.5 7.9 8.8 5.5 11.8 7.4 0.93 0.9 Teheran [(34◦, 36◦N); (50◦, 52◦E)] −12.9 5.1 −13.1 5.7 12.9 5.1 13.3 5.4 0.86 0.87 San Francisco [(36◦, 38◦N); (−123◦, −121◦E)] −11.7 7.4 −5.5 7.9 12.3 6.4 7.8 5.5 0.89 0.86 USA [(35◦, 40◦N); (−80◦, −75◦E)] −15.1 −27.2 DJ 8.5 5.3 DJ −2.9 −11.4 DJ 6.6 5.3 DJ 15.1 27.2 DJ 8.5 5.3 DJ 5.4 11.4 DJ 4.8 5.3 DJ 0.82 0.87
their standard deviation (SD), as well as the correlation coef-ficients for each region.
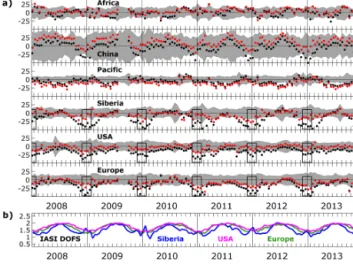
Figure 6 illustrates the seasonal patterns as seen by both instruments, for a subset of six regions representative of dif-ferent regimes: Africa (fires), China (high concentrations and large variability), Pacific (remote sea), Siberia, USA and Eu-rope (NH regions with large discrepancies in boreal win-ter). The figure provides the average and the standard devia-tion for IASI (in red) and MOPITT v5T (in blue), twice per month. The maxima and minima are driven by the chemical and photochemical reactions described in Sect. 3.1. It can be seen that the agreement is good in general although MOPITT columns are most of the time slightly larger for all the boxes located over land, as already discussed. The correlation co-efficients (r5T and rX1in Table 2) are good (range between
0.72 and 0.95) and generally improved by the reprocessing. The variability inside the box (standard deviation in Fig. 6) is an indicator of the rapid changes in the CO content occur-ring over the area. It is very low over the remote sea (see the
Pacific box) and very high over the polluted area in China. Figure 7a provides the differences in percent for the same six areas for both the MOPITT v5T and the MOPITT vX1 pro-cessing, relatively to IASI. The grey envelopes indicate the IASI standard deviation within the box (in %). By analyzing the time periods when the MOPITT v5T vs. IASI differences exceed this “natural” variability (i.e., when the black dots are outside the grey area in Fig. 7), we find as a consistent pattern that the MOPITT total columns sometimes exceed the IASI total columns by ∼ 30 %. This happens each year during the boreal winter period (December–January) for the boxes “Europe”, “USA”, and “Siberia” (see black rectangles and bold figures in Table 2). In the “Siberia” box, the differ-ence can reach 50 % from October to April. This is closely linked to the seasonal evolution of the information content available in the data (how much it can depart from the a pri-ori) as can been seen from IASI DOFS plotted in Fig. 7b for the “Europe”, “USA” and “Siberia” boxes. The largest biases are indeed observed in boreal winter and are
associ-4322 M. George et al.: Long-term CO records from MOPITT and IASI
Figure 6. CO total column variability for IASI (in red) and MO-PITT v5T (in blue) (×1018molecules cm−2) for six selected re-gions (see Fig. 5b and lat/lon information in Table 2). Each point represents a 15 day-average and the vertical bar represents the SD. Black rectangles indicate the January and December months for each year, for “USA”, “Europe” and “Siberia” on which we focus in Table 2.
ated with low DOFS at this time of year. Although they do not totally disappear, these biases are significantly reduced when the MOPITT data are reprocessed to derive CO using the IASI a priori: differences are reduced by a factor of 2 to 2.5 (“Europe”: absolute mean bias of 35 % in December– January compared to 18.1 % after the reprocessing; “USA”: 27.2 vs. 11.4 %; “Siberia”: 35.9 vs. 12.9 %) (see Table 2). Surprisingly, the use of the same a priori information slightly increases the biases for some other regions (Pacific, Atlantic and Mexico City), for which an in-depth analysis of averag-ing kernels would be needed for a complete understandaverag-ing.
A global map of the differences in a priori for both mis-sions is provided in Fig. 8, which shows the global difference between the IASI and MOPITT a priori CO data, for both January and July, at the lowest vertical level and at 400 hPa (∼ 7 km). The larger differences are found near the surface, close to pollution and fire emission sources, mostly in the Northern Hemisphere, and peak in winter over the selected areas as discussed in Sect. 3.2. An in-depth look at the re-trieved profiles will provide more information on how the a priori profiles and associated Samatrix and actual
observa-tions combine.
4 Comparison of CO profiles products: case studies
4.1 General description
Even more than for total column values, the shape of the re-trieved CO profiles will be determined by the vertical instru-mental sensitivity, modulated by the thermal contrast which governs the sensitivity to the lower atmospheric layers, and by the a priori assumptions. If the measurement sensitivity is low and/or the background covariance is small relative to that
Figure 7. (a) CO total column relative differences ( %) between IASI and MOPITT v5T (in black) and IASI and MOPITT vX1 (in red) (100×(IASI-MOPITT)/IASI), for the six regions presented in Fig. 6. The grey area represents the IASI CO total column SD (in %). Black rectangles indicate the January and December months for each year, for “USA”, “Europe” and “Siberia” on which we focus in Table 2. (b) Seasonal variability of the IASI Degree of Freedom for Signal (DOFS) corresponding to the “Siberia” (in blue), “USA” (in magenta) and “Europe” (in green) regions.
Figure 8. Difference (in ppbv) between MOPITT and IASI a pri-ori (MOPITT-IASI), in January (left) and in July (right), near the surface (up) and at 400 hPa (bottom).
of the measurement, then the retrieval tends toward the a pri-ori profile value at these altitudes. When the a pripri-ori profiles differ significantly for IASI and MOPITT, large differences can appear in the retrieved profile products.
As explained in Sect. 2.2, the IASI a priori profile is al-ways the same, and the Samatrix allows a large variability,
in particular near the surface. On the contrary MOPITT v5T a priori profiles rely on a monthly/latitudinal varying clima-tology, and the Samatrix has a moderate and constant
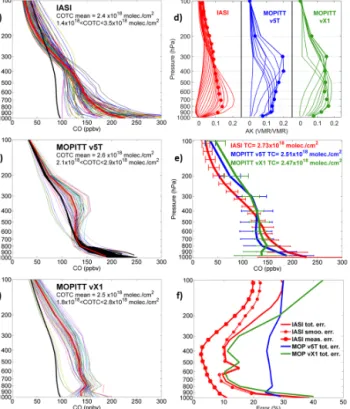
com-Figure 9. (a–c) Ensemble of retrieved profiles in the “Europe” box for 1 day (20100409), for IASI, MOPITT v5T, and MOPITT vX1. The corresponding a priori profiles are plotted in black. For each subplot the CO total columns are also provided. (d) provides the averaging kernels (the altitude of each line is indicated by a dot) for one example case (see red profiles plotted in a–c), (e) retrieved profiles with corresponding total error (horizontal bars) and (f) er-ror profiles in %. The smoothing, measurement and total erer-rors are plotted in red for IASI. For MOPITT, only the total errors are avail-able.
pare the profiles from both the original IASI and MOPITT v5T products, and the profiles obtained after the reprocess-ing (MOPITT vX1). Figure 9 illustrates a typical findreprocess-ing. It shows the CO profiles for 1 day of observation (9 April 2010) for the “Europe” box, when high levels of CO were observed. The total column means are similar for each product but the shape of the profiles differs. We see that the IASI-retrieved profiles (Fig. 9a), depart from the a priori at all altitudes but especially near the surface given the high variance of its Sa
matrix at this altitude. For MOPITT v5T (Fig. 9b), it can be seen that the retrieved profiles remain quite close to the a pri-ori profiles near the surface and depart at around 400 hPa, where its maximum sensitivity lies. This corresponds also to the altitude where the pressure modulated cell (PMC) chan-nels provide most information. The quasi-diagonal MOPITT
Sa matrix limits the “extrapolation” effects to the adjacent
levels. Interestingly, for MOPITT vX1 (Fig. 9c), the shape of the profiles differs from the MOPITT v5T profiles and de-parts more from the a priori. However MOPITT vX1 profiles do not show the large concentrations at the surface that IASI
profiles do, despite the fact that the same a priori is used. As illustrated in Fig. 9d the averaging kernels for a representa-tive case (in red in Fig. 9a–c) show a non-zero sensitivity at the surface for MOPITT. Another possible explanation lies in the constraint applied to the measurements (the Sein the OE),
which might be looser in FORLI, increasing further the range of variability. Looking at the total errors associated with each retrieved profiles (Fig. 9e), we note that the three profiles are within the errors of each other, which indicates the consis-tency of the data sets. The errors in % are plotted in Fig. 9f. The MOPITT vX1 total error profile is close to the IASI one because the smoothing error dominates.
In order to go further in the analysis we selected three illustrative cases, representative of different situations, for which aircraft profile data from the MOZAIC-IAGOS pro-gram (Nedelec et al., 2003; http://www.iagos.org/) were available within a ±12 h time slot. Figures 10 to 12 show for different locations the IASI, MOPITT v5T and MOPITT vX1 averaged profiles with their corresponding a priori pro-files, along with the collocated MOZAIC-IAGOS profile. All data within 0.5◦of the MOZAIC-IAGOS profile path (which corresponds to 36 to 56 km, depending on latitude) were se-lected and then averaged. Note that the MOZAIC-IAGOS profiles were not smoothed by the IASI/MOPITT averaging kernels here, as we wanted to represent the actual altitude of the pollution plume if any. Representative averaging ker-nel functions at different altitudes are also provided for each product, in order to evaluate the altitudes where the retrievals are mostly sensitive.
4.2 Nagoya case (high CO in the mid-low troposphere)
For the “Nagoya” case plotted in Fig. 10, the MOZAIC-IAGOS profile shows a pollution plume around 600 hPa (∼ 4 km) measured on 25 June 2012. The shape of the collo-cated satellite retrieved profiles differs, with MOPITT peak-ing around 300–400 hPa and at the surface, and IASI peakpeak-ing at lower troposphere and at the surface. The MOPITT aver-aging kernel functions show that the retrieval is most sensi-tive just above the plume altitude, where the MOPITT v5T profile peaks. Due to the fact that there is no sensitivity at the surface the retrieved CO sticks to its a priori at this alti-tude. The IASI averaging kernel functions show a sensitivity of the retrieval slightly lower in altitude, with a maximum around 700 hPa, as well as a slight sensitivity near the sur-face. The IASI retrieved profile underestimates the amount of CO around 600 hPa and overestimates it at surface level. Due to the loosely constrained covariance matrix near the surface, the CO amount “seen” by IASI is extrapolated toward the surface. The MOPITT vX1 profile lies “in between”, with lower concentrations than the v5T one in the first layers close to the surface, and larger concentrations than the IASI profile above 400 hPa.
4324 M. George et al.: Long-term CO records from MOPITT and IASI
Figure 10. CO averaged profiles (upper left, red for IASI, blue for MOPITT v5T and green for MOPITT vX1) compared with collocated MOZAIC-IAGOS aircraft data (black), measured near Nagoya (Japan) on 25 June 2012. The a priori profiles are also pro-vided (dashed line) along with the averaging kernels at different alti-tudes (other subplots). The following criteria were used to generate the averaged profiles: all data within 0.5◦of the MOZAIC-IAGOS profile path and within a ±12 h time window were selected. The title of the upper left subplot provides information on the lat/lon limits of the MOZAIC-IAGOS profile path and the number of averaged profiles for the three products.
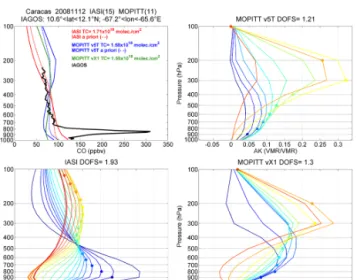
Figure 11. Same as in Fig. 10 but near Caracas (Venezuela) on 12 November 2008.
4.3 Caracas case (high surface CO with sensitivity at the surface)
The case at the Caracas airport (Fig. 11) shows a typical air-craft profile measured at this location, with CO mixing ratios reaching more than 300 ppbv around 900–800 hPa (1–2 km).
Figure 12. Same as in Fig. 10 but near Frankfurt (Germany) on 14 December 2008.
The total columns retrieved by both MOPITT v5T and IASI are quite similar, but again the shape of the profiles differs. The IASI retrieval shows some sensitivity close to the surface as the averaging kernel functions associated with the lower altitudes peak between 700 and 900 hPa. The IASI profile somewhat departs from the a priori for the first altitude levels but it does not reach the MOZAIC-IAGOS high values. On the other hand, the altitude of MOPITT retrieval sensitivity maximum is higher, around 300 hPa (∼ 9 km) and its sensi-tivity is low near the surface. MOPITT does not capture the plume (−40 ppbv compared to IASI near the surface), and the retrieved profiles (v5T and vX1) are close to their a priori profiles (and the climatology is far from the observation in this case).
4.4 Frankfurt case (high CO at the surface)
The “Frankfurt” case (Fig. 12) shows large mixing ratios measured by the MOZAIC-IAGOS aircraft near the surface. Both MOPITT and IASI are sensitive in the mid troposphere (between 500 and 300 hPa) but not at the surface. All the re-trieved profiles stick to their a priori profiles, especially at the surface. The MOPITT v5T profile agrees very well with the MOZAIC-IAGOS profile, sticking to the a priori profile which in this case shows large mixing ratios at the surface (reaching more than 250 ppb). For IASI, the plume is missed and for MOPITT vX1, the profile behaves similarly to the IASI profile.
These three cases were selected to illustrate the impacts of choosing a single or a variant a priori profile and a strongly or loosely constrained Samatrix. In summary, when there is
a good sensitivity of the satellite instrument at the altitude of the plume, both instruments manage to detect the CO in-crease, but MOPITT generally puts it where its maximum sensitivity lies (around 300–400 hPa), whereas IASI tends to
project high CO observed in the middle-troposphere towards the surface (because of the 5 km correlation length). For the altitudes where the instrument is not sensitive, in particular at the surface level when the thermal contrast is low, each instrument sticks to its a priori. This leads to a better agree-ment for the MOPITT-retrieved profile when the measured CO profile at one location is close to the climatology used to build the a priori, which is usually the case for seasonal fires and highly polluted areas (e.g., Frankfurt). On the contrary, for situations where unexpected fires or pollution events oc-cur (e.g., near Caracas) the agreement is better with the IASI derived profile.
In order to confirm the important role of the choice of the a priori assumptions and especially the weight of the Sa
matrix, we also performed some tests processing the IASI algorithm with the MOPITT Sa matrix (but with the
sin-gle IASI a priori profile). As expected, the reprocessed IASI profiles (not shown here) show lower CO concentration than the native IASI profiles near the surface because the allowed variability (used for MOPITT) around the a priori profile is lower.
5 Discussion and conclusion
CO is a key atmospheric species to be analyzed on the global scale, as a precursor of other gases, and as a sink for OH, which contributes largely to the removal of many pollutants. Since the year 2000 there have been several satellite borne instruments able to map CO on the global scale, including MOPITT and IASI, two different instruments that have been providing long-term radiance observations from space, from which CO concentrations can be derived. Because of the ill-posed character of the inverse problem, the choice of the a priori impacts strongly on the retrieved profiles and columns. We have investigated this by reprocessing a 6-year MOPITT data set using the same a priori constraints as those used for IASI.
For total columns we found that it leads to a better agree-ment for source regions and during periods of low sensitiv-ity (such as boreal winter months at mid-latitude) where the differences in total columns are largely reduced. A priori as-sumptions are thought to be the dominant component of the observed discrepancies, but bias differences remain (ranging from 5 to 18 %) and can be explained by a combination of (1) the different time and location for the observations, (2) the different vertical sensitivity of each instrument, and (3) the different auxiliary parameters (in particular temperature, water vapor and cloud content) used in the retrieval.
For vertical profiles, the comparison was achieved above selected sites where correlative aircraft measurements were available. We show that when the sensitivity is good, both in-struments detect CO concentrations increases but as expected the shape of the profiles differs. When the sensitivity is low, MOPITT-retrieved CO profiles are closer to the aircraft ones than IASI when the a priori profile is already close to the
truth. When the opposite occurs (large variation from the a priori profile) IASI provides a more realistic CO profile. It proved to be difficult to find collocated observations for pro-file data, which limits our ability to generalize these findings. Note that data with a single a priori are also easier to inter-pret.
MOPITT and IASI are currently both being assimilated into the Monitoring Atmospheric Composition and Cli-mate (MACC) system (the pre-operational Copernicus At-mosphere Service of the European Union, see http://www. copernicus.eu/), which provides analyses and forecasts of global reactive gases and aerosol fields (Inness et al., 2013). The assimilation system relies on CO total column and averaging kernel information, provided by retrieval algo-rithms described in this paper. Known discrepancies exist be-tween the model and the CO satellite observed data, which have been reported in previous publications (e.g., Stein et al., 2014), but also among the satellite data themselves as demonstrated here. This is accounted for in the assimilation process by using a bias correction scheme for the CO data. Validation with ground-based observations (Wagner et al., 2015) pointed to the need for a more detailed assessment of both data sets, and clearer identification of where differences come from. This work is a step in that direction.
On a longer term/climate perspective, essential climate variables (ECVs) are needed for all climate related gases. This requires continuous and unbiased long-term data records. MOPITT initiated a record of more than 15 years, which is being continued for the next > 30 years by the IASI series of instruments, with the launch of MetOp-C currently scheduled at the end of 2018, and the IASI-New Genera-tion instruments to be embarked on the MetOp-SG platforms (Clerbaux and Crevoisier, 2013; Crevoisier et al., 2014). A systematic processing of both data sets using the same a pri-ori assumptions is foreseen in the framework of the EU-FP7 projects QA4ECV, and this work is paving the way for es-tablishing such a long-term CO compatible record. Our anal-ysis is limited to the study of the impact of the a priori as-sumptions (probably the dominant factor for discrepancy), whereas other variables are known to contribute to the ob-served differences, in particular cloud content and temper-ature profiles. For long-term records and trend analysis it should be envisaged to reprocess the whole MOPITT-IASI series using auxiliary data coming from the same source, e.g., ECMWF (European Centre for Medium-Range Weather Forecasts) Reanalysis (ERA) for winds, cloud cover and rel-ative humidity (Dee et al., 2011). Regarding the differences in time and location, as well as in vertical sensitivity, only data assimilation can process each data set accordingly.
4326 M. George et al.: Long-term CO records from MOPITT and IASI Acknowledgements. The French scientists are very grateful to
NCAR and its visitor program, which allowed the fruitful scientific collaboration between the IASI and MOPITT teams to develop and to be maintained for years. NCAR is sponsored by the National Science Foundation. IASI is a joint mission of EUMETSAT and the Centre National d’Etudes Spatiales (CNES, France). The IASI L1 and L2 input data are distributed in near real time by EUMETSAT through the EumetCast system distribution. The MOPITT project is supported by the NASA Earth Observing System (EOS) Program. The MOPITT team also acknowledges support under NASA grant NNX11AE19G. The authors acknowledge the European Commission for the support to the MOZAIC project (1994–2003) and the preparatory phase of IAGOS (2005–2012). The LATMOS team also acknowledges the French Ether atmospheric database (www.pole-ether.fr) for providing the IASI L1C data and L2 temperature data disseminated via EUMETcast, as well as CNES and CNRS for financial support. This work is also part of the EUMETSAT/O3M-SAF project. The research in Belgium is funded by the Belgian State Federal Office for Scientific, Technical and Cultural Affairs and the European Space Agency (ESA Prodex arrangement 4000111403 IASI.Flow) and by the EU-FP7 projects QA4ECV (grant agreement 607405) and PANDA (grant agreement 606719). P.-F. Coheur is Senior Research Associate with F.R.S-FNRS.
Edited by: J.-L. Attie
References
Aumann, H. H., Chahine, M. T., Gautier, C., Goldberg, M. D., Kalnay, E., McMillin, L. M., Revercomb, H., Rosenkranz, P. W., Smith, W. L., Staelin, D. H., Strow, L. L., and Susskind, J.: AIRS/AMSU/HSB on the Aqua mission: design, science objec-tives, data products, and processing systems, IEEE T. Geosci. Remote, 41, 2, 253–264, 2003.
Beer, R.: TES on the AURA mission: scientific objectives, mea-surements and analysis overview, IEEE T. Geosci. Remote, 44, 1102–1105, 2006.
Clerbaux, C. and Crevoisier, C.: New Directions: infrared remote sensing of the troposphere from satellite: less, but better, Atmos. Environ., 72, 24–26, doi:10.1016/j.atmosenv.2013.01.057, 2013. Clerbaux, C., Hadji-Lazaro, J., Payan, S., Camy-Peyret, C., Wang, J., Edwards, D. P., and Luo, M.: Retrieval of CO from nadir remote-sensing measurements in the infrared by use of four different inversion algorithms, Appl. Optics, 41, 7068–7078, doi:10.1364/AO.41.007068, 2002.
Clerbaux, C., Edwards, D. P., Deeter, M., Emmons, L., Lamar-que, J.-F., Tie, X. X., Massie, S. T., and Gille, J.: Carbon monoxide pollution from cities and urban areas observed by the Terra/MOPITT mission, Geophys. Res. Lett, 35, L03817, doi:10.1029/2007GL032300, 2008.
Clerbaux, C., Boynard, A., Clarisse, L., George, M., Hadji-Lazaro, J., Herbin, H., Hurtmans, D., Pommier, M., Razavi, A., Turquety, S., Wespes, C., and Coheur, P.-F.: Monitoring of at-mospheric composition using the thermal infrared IASI/MetOp sounder, Atmos. Chem. Phys., 9, 6041–6054, doi:10.5194/acp-9-6041-2009, 2009.
Crevoisier, C., Clerbaux, C., Guidard, V., Phulpin, T., Armante, R., Barret, B., Camy-Peyret, C., Chaboureau, J.-P., Coheur, P.-F., Crépeau, L., Dufour, G., Labonnote, L., Lavanant, L., Hadji-Lazaro, J., Herbin, H., Jacquinet-Husson, N., Payan, S., Péquig-not, E., Pierangelo, C., Sellitto, P., and Stubenrauch, C.: Towards IASI-New Generation (IASI-NG): impact of improved spectral resolution and radiometric noise on the retrieval of thermody-namic, chemistry and climate variables, Atmos. Meas. Tech., 7, 4367–4385, doi:10.5194/amt-7-4367-2014, 2014.
Dee, D. P., Uppala, S. M., Simmons, A. J., Berrisford, P., Poli, P., Kobayashi, S., Andrae, U., Balmaseda, M. A., Balsamo, G., Bauer, P., Bechtold, P., Beljaars, A. C. M., van de Berg, L., Bid-lot, J., Bormann, N., Delsol, C., Dragani, R., Fuentes, M., Geer, A. J., Haimberger, L., Healy, S. B., Hersbach, H., Hólm, E. V., Isaksen, L, Kållberg, P., Köhler, M., Matricardi, M., McNally, A. P., Monge-Sanz, B. M., Morcrette, J.-J., Park, B.-K., Peubey, C., de Rosnay, P., Tavolato, C., Thépaut J.-N., and Vitart, F.: The ERA-Interim reanalysis: configuration and performance of the data assimilation system, Q. J. Roy. Meteor. Soc., 137, 553–597, 2011.
Deeter, M. N., Emmons, L. K., Francis, G. L., Edwards, D. P., Gille, J. C., Warner, J. X., Khattatov, B., Ziskin, D., Lamar-que, J. F., Ho, S. P., Yudin, V., Attié, J. L., Packman, D., Chen, J., Mao, D., and Drummond, J. R.: Operational carbon monoxide retrieval algorithm and selected results for the MOPITT instru-ment, J. Geophys. Res., 108, 4399, doi:10.1029/2002JD003186, 2003.
Deeter, M. N., Edwards, D. P., Gille, J. C., and Drummond, J. R.: Sensitivity of MOPITT observations to carbon monoxide in the lower troposphere, J. Geophys. Res., 112, D24306, doi:10.1029/2007JD008929, 2007.
Deeter, M. N., Edwards, D. P., Gille, J. C, Emmons, L. K., Fran-cis, G., Ho, S.-P., Mao, D., Masters, D., Worden, H., Drum-mond, J. R., and Novelli, P. C.: The MOPITT version 4 CO prod-uct: algorithm enhancements, validation, and long-term stabil-ity, J. Geophys. Res., 115, D07306, doi:10.1029/2009JD013005, 2010.
Deeter, M. N., Worden, H. M., Edwards, D. P., Gille, J. C., and Andrews, A. E.: Evaluation of MOPITT retrievals of lower-tropospheric carbon monoxide over the United States, J. Geo-phys. Res., 117, D13306, doi:10.1029/2012JD017553, 2012. Deeter, M. N., Martínez-Alonso, S., Edwards, D. P., Emmons, L. K.,
Gille, J. C., Worden, H. M., Pittman, J. V., Daube, B. C., and Wofsy, S. C.: Validation of MOPITT Version 5 thermal-infrared, near-thermal-infrared, and multispectral carbon monoxide pro-file retrievals for 2000–2011, J. Geophys. Res., 118, 6710–6725, doi:10.1002/jgrd.50272, 2013.
De Wachter, E., Barret, B., Le Flochmoën, E., Pavelin, E., Ma-tricardi, M., Clerbaux, C., Hadji-Lazaro, J., George, M., Hurt-mans, D., Coheur, P.-F., Nedelec, P., and Cammas, J. P.: Retrieval of MetOp-A/IASI CO profiles and validation with MOZAIC data, Atmos. Meas. Tech., 5, 2843–2857, doi:10.5194/amt-5-2843-2012, 2012.
Drummond, J. R. and Mand, G. S.: The Measurements of Pollution in the Troposphere (MOPITT) Instrument: Overall Performance and Calibration Requirements, J. Atmos. Ocean. Tech., 13, 314–320, doi:10.1175/1520-0426(1996)013<0314:TMOPIT>2.0.CO;2, 1996.
Drummond, J. R., Zou, J., Nichitiu, F., Kar, J., Deschambaut, R., and Hackett, J.: A review of 9-year performance and opera-tion of the MOPITT instrument, Adv. Space Res., 45, 760–774, doi:10.1016/j.asr.2009.11.019, 2010.
Duncan, B. N. and Logan, J. A.: Model analysis of the factors regulating the trends and variability of carbon monoxide be-tween 1988 and 1997, Atmos. Chem. Phys., 8, 7389–7403, doi:10.5194/acp-8-7389-2008, 2008.
Edwards, D. P., Halvorson, C. M., and Gille, J. C.: Radiative transfer modeling for the EOS Terra satellite Measurement of Pollution in the Troposphere (MOPITT) instrument, J. Geophys. Res., 104, 16755–16775, doi:10.1029/1999JD900167, 1999.
Edwards, D. P., Emmons, L. K., Gille, J. C., Chu, A., Attié, J.-L., Giglio, J.-L., Wood, S. W., Haywood, J., Deeter, M. N., Massie, S. T., Ziskin, D. C., and Drummond, J. R.: Satellite ob-served pollution from Southern Hemisphere biomass burning, J. Geophys. Res., 111, D14312, doi:10.1029/2005JD006655, 2006. Emmons, L. K., Deeter, M. N., Gille, J. C., Edwards, D. P., At-tié, J.-L., Warner, J., Ziskin, D., Francis, G., Khattatov, B., Yudin, V., Lamarque, J.-F., Ho, S.-P., Mao, D., Chen, J. S., Drummond, J., Novelli, P., Sachse, G., Coffey, M. T., Hanni-gan, J. W., Gerbig, C., Kawakami, S., Kondo, Y., Takegawa, N., Schlager, H., Baehr, J., and Ziereis, H.: Validation of Measure-ments of Pollution in the Troposphere (MOPITT) CO retrievals with aircraft in situ profiles, J. Geophys. Res., 109, D03309, doi:10.1029/2003JD004101, 2004.
Emmons, L. K., Edwards, D. P., Deeter, M. N., Gille, J. C., Cam-pos, T., Nédélec, P., Novelli, P., and Sachse, G.: Measurements of Pollution In The Troposphere (MOPITT) validation through 2006, Atmos. Chem. Phys., 9, 1795–1803, doi:10.5194/acp-9-1795-2009, 2009.
Gambacorta, A., Barnet, C., Wolf, W., King, T., Maddy, E., Strow, L., Xiong. X., Nalli, N., and Goldberg, M.: An ex-periment using high spectral resolution CrIS measurements for atmospheric trace gases: carbon monoxide retrieval impact study, IEEE Geosci. Remote Sens. Lett., 11, 9, 1639–1643, doi:10.1109/LGRS.2014.2303641, 2014.
George, M., Clerbaux, C., Hurtmans, D., Turquety, S., Coheur, P.-F., Pommier, M., Hadji-Lazaro, J., Edwards, D. P., Worden, H., Luo, M., Rinsland, C., and McMillan, W.: Carbon monoxide dis-tributions from the IASI/METOP mission: evaluation with other space-borne remote sensors, Atmos. Chem. Phys., 9, 8317–8330, doi:10.5194/acp-9-8317-2009, 2009.
Ho, S., Edwards, D. P., Gille, J. C., Luo, M., Osterman, G. B., Kulawik, S. S., and Worden, H.: A global comparison of car-bon monoxide profiles and column amounts from Tropospheric Emission Spectrometer (TES) and Measurements of Pollution in the Troposphere (MOPITT), J. Geophys. Res., 114, D21307, doi:10.1029/2009JD012242, 2009.
Hemispheric Transport of Air Pollution (HTAP): Part 1: Ozone and Particulate matter, United Nations Publications, avail-able at: http://www.htap.org/publications/assessment_reports. htm (last access: 29 September 2015), 2010.
Hurtmans, D., Coheur, P.-F., Wespes, C., Clarisse, L., Scharf, O., Clerbaux, C., Hadji-Lazaro, J., George, M., and Turquety, S.: FORLI radiative transfer and retrieval code for IASI, J. Quant. Spectrosc. Ra., 113, 1391–1408, doi:10.1016/j.jqsrt.2012.02.036, 2012.
IASI Science Plan, C. Camy-Peyret, J. Eyre et al., IS-SWG/Eumetsat, available at: https://iasi.cnes.fr/sites/default/ files/migration/smsc/iasi/IASI_Science_Plan_Issue1_released_ version.pdf (last access: 29 September 2015), 1998.
Illingworth, S. M., Remedios, J. J., Boesch, H., Ho, S.-P., Ed-wards, D. P., Palmer, P. I., and Gonzi, S.: A comparison of OEM CO retrievals from the IASI and MOPITT instruments, Atmos. Meas. Tech., 4, 775–793, doi:10.5194/amt-4-775-2011, 2011. Inness, A., Baier, F., Benedetti, A., Bouarar, I., Chabrillat, S.,
Clark, H., Clerbaux, C., Coheur, P., Engelen, R. J., Errera, Q., Flemming, J., George, M., Granier, C., Hadji-Lazaro, J., Huij-nen, V., Hurtmans, D., Jones, L., Kaiser, J. W., Kapsomenakis, J., Lefever, K., Leitão, J., Razinger, M., Richter, A., Schultz, M. G., Simmons, A. J., Suttie, M., Stein, O., Thépaut, J.-N., Thouret, V., Vrekoussis, M., Zerefos, C., and the MACC team: The MACC reanalysis: an 8 yr data set of atmospheric composition, Atmos. Chem. Phys., 13, 4073–4109, doi:10.5194/acp-13-4073-2013, 2013.
Kerzenmacher, T., Dils, B., Kumps, N., Blumenstock, T., Cler-baux, C., Coheur, P.-F., Demoulin, P., García, O., George, M., Griffith, D. W. T., Hase, F., Hadji-Lazaro, J., Hurtmans, D., Jones, N., Mahieu, E., Notholt, J., Paton-Walsh, C., Raffalski, U., Ridder, T., Schneider, M., Servais, C., and De Mazière, M.: Validation of IASI FORLI carbon monoxide retrievals using FTIR data from NDACC, Atmos. Meas. Tech., 5, 2751–2761, doi:10.5194/amt-5-2751-2012, 2012.
Krol, M., Peters, W., Hooghiemstra, P., George, M., Cler-baux, C., Hurtmans, D., McInerney, D., Sedano, F., Bergam-aschi, P., El Hajj, M., Kaiser, J. W., Fisher, D., Yershov, V., and Muller, J.-P.: How much CO was emitted by the 2010 fires around Moscow?, Atmos. Chem. Phys., 13, 4737–4747, doi:10.5194/acp-13-4737-2013, 2013.
Luo, M., Rinsland, C. P., Rodgers, C. D., Logan, J. A., Wor-den, H., Kulawik, S., Eldering, A., Goldman, A., Shep-hard, M. W., Gunson, M., and Lampel, M.: Comparison of carbon monoxide measurements by TES and MOPITT: influ-ence of a priori data and instrument characteristics on nadir at-mospheric species retrievals, J. Geophys. Res., 112, D09303, doi:10.1029/2006JD007663, 2007.
McMillan, W. W., Barnet, C., Strow, L., Chahine, M. T., Mc-Court, M. L., Warner, J. X., Novelli, P. C., Korontzi, S., Maddy, E. S., and Datta, S.: Daily global maps of carbon monox-ide from NASA’s Atmospheric Infrared Sounder, Geophys. Res. Lett., 32, L11801, doi:10.1029/2004GL021821, 2005.
Nedelec, P., Cammas, J.-P., Thouret, V., Athier, G., Cousin, J.-M., Legrand, C., Abonnel, C., Lecoeur, F., Cayez, G., and Marizy, C.: An improved infrared carbon monoxide analyser for routine mea-surements aboard commercial Airbus aircraft: technical valida-tion and first scientific results of the MOZAIC III programme, Atmos. Chem. Phys., 3, 1551–1564, doi:10.5194/acp-3-1551-2003, 2003.
Pan, L. W., Edwards, D. P., Gille, J. C., Smith, M. W., and Drum-mond, J. R.: Satellite remote-sensing of tropospheric CO and CH4 – forward model studies of the MOPITT instrument, Appl. Optics, 34, 6976–6988, doi:10.1364/AO.34.006976, 1995. Pommier, M., Law, K. S., Clerbaux, C., Turquety, S.,
Hurt-mans, D., Hadji-Lazaro, J., Coheur, P.-F., Schlager, H., Ancel-let, G., Paris, J.-D., Nédélec, P., Diskin, G. S., Podolske, J. R., Holloway, J. S., and Bernath, P.: IASI carbon monoxide
4328 M. George et al.: Long-term CO records from MOPITT and IASI validation over the Arctic during POLARCAT spring and
summer campaigns, Atmos. Chem. Phys., 10, 10655–10678, doi:10.5194/acp-10-10655-2010, 2010.
Ponomarev, E. I.: Radiative power of wildfires in Siberia on the ba-sis of TERRA/Modis imagery 897 processing, Folia Forestalia Polonica, Seria A, 55, 102–110, doi:10.2478/ffp-2013-00011, 2013.
R’Honi, Y., Clarisse, L., Clerbaux, C., Hurtmans, D., Duflot, V., Turquety, S., Ngadi, Y., and Coheur, P.-F.: Exceptional emis-sions of NH3and HCOOH in the 2010 Russian wildfires, At-mos. Chem. Phys., 13, 4171–4181, doi:10.5194/acp-13-4171-2013, 2013.
Rinsland, C. P., Luo, M., Logan, J. A., Beer, R., Worden, H., Ku-lawik, S. S., Rider, D., Osterman, G., Gunson, M., Eldering, A., Goldman, A., Shephard, M., Clough, S. A., Rodgers, C., Lam-pel, M., and Chiou, L.: Nadir measurements of carbon monoxide (CO) distributions by the tropospheric emission spectrometer in-strument onboard the Aura spacecraft: overview of analysis ap-proach and examples of initial results, Geophys. Res. Lett., 33, L22806, doi:10.1029/2006GL027000, 2006.
Rodgers, C. D.: Inverse Methods for Atmospheric Sounding: The-ory and Practice, Ser. Atmos. Ocean. Planet. Phys. 2, World Sci., Hackensack, NJ, 2000.
Stein, O., Schultz, M. G., Bouarar, I., Clark, H., Huijnen, V., Gaudel, A., George, M., and Clerbaux, C.: On the wintertime low bias of Northern Hemisphere carbon monoxide found in global model simulations, Atmos. Chem. Phys., 14, 9295–9316, doi:10.5194/acp-14-9295-2014, 2014.
Streets, D., Canty, T., Carmichael, G., de Foy, B., Dicker-son, R., Duncan, B., Edwards, D., Haynes, J., Henze, D., Houyoux, M., Jacob, D., Krotkov, N., Lamsal, L., Liu, Y., Lu, Z., Martin, R., Pfister, G., Pinder, R., Salawitch, R., and Wecht, K.: Emissions estimation from satellite retrievals: a re-view of current capability, Atmos. Environ., 77, 1011–1042, doi:10.1016/j.atmosenv.2013.05.051, 2013.
Strode, S. A. and Pawson, S.: Detection of carbon monoxide trends in the presence interannual variability, J. Geophys. Res., 118, 12257–12273, doi:10.1002/2013JD020258, 2013.
Turquety, S., Hurtmans, D., Hadji-Lazaro, J., Coheur, P.-F., Cler-baux, C., Josset, D., and Tsamalis, C.: Tracking the emission and transport of pollution from wildfires using the IASI CO re-trievals: analysis of the summer 2007 Greek fires, Atmos. Chem. Phys., 9, 4897–4913, doi:10.5194/acp-9-4897-2009, 2009. Wagner, A., Blechschmidt, A.-M., Bouarar, I., Brunke, E.-G.,
Cler-baux, C., Cupeiro, M., Cristofanelli, P., Eskes, H., Flemming, J., Flentje, H., George, M., Gilge, S., Hilboll, A., Inness, A., Kap-somenakis, J., Richter, A., Ries, L., Spangl, W., Stein, O., Weller, R., and Zerefos, C.: Evaluation of the MACC oper-ational forecast system – potential and challenges of global near-real-time modelling with respect to reactive gases in the troposphere, Atmos. Chem. Phys. Discuss., 15, 6277–6335, doi:10.5194/acpd-15-6277-2015, 2015.
Warner, J., Comer, M. M., Barnet, C. D., McMillan, W. W., Wolf, W., Maddy, E., and Sachse, G.: A comparison of satel-lite tropospheric carbon monoxide measurements from AIRS and MOPITT during INTEX-A, J. Geophys. Res., 112, D12S17, doi:10.1029/2006JD007925, 2007.
Worden, H. M., Deeter, M. N., Frankenberg, C., George, M., Nichi-tiu, F., Worden, J., Aben, I., Bowman, K. W., Clerbaux, C., Co-heur, P. F., de Laat, A. T. J., Detweiler, R., Drummond, J. R., Edwards, D. P., Gille, J. C., Hurtmans, D., Luo, M., Martínez-Alonso, S., Massie, S., Pfister, G., and Warner, J. X.: Decadal record of satellite carbon monoxide observations, Atmos. Chem. Phys., 13, 837–850, doi:10.5194/acp-13-837-2013, 2013. Yurganov, L. N., Rakitin, V., Dzhola, A., August, T., Fokeeva, E.,
George, M., Gorchakov, G., Grechko, E., Hannon, S., Kar-pov, A., Ott, L., Semutnikova, E., Shumsky, R., and Strow, L.: Satellite- and ground-based CO total column observations over 2010 Russian fires: accuracy of top-down estimates based on thermal IR satellite data, Atmos. Chem. Phys., 11, 7925–7942, doi:10.5194/acp-11-7925-2011, 2011.
Zhou, D. K., Larar, A. M., Liu, X., Smith, W. L., Strow, L. L., Yang, P., Schlussel, P., and Calbet, X.: Global land sur-face emissivity retrieved from satellite ultraspectral IR mea-surements, IEEE T. Geosci. Remote Sens., 49, 1277–1290, doi:10.1109/TGRS.2010.2051036, 2011.