HAL Id: hal-00296975
https://hal.archives-ouvertes.fr/hal-00296975
Submitted on 26 Apr 2007
HAL is a multi-disciplinary open access
archive for the deposit and dissemination of
sci-entific research documents, whether they are
pub-lished or not. The documents may come from
teaching and research institutions in France or
abroad, or from public or private research centers.
L’archive ouverte pluridisciplinaire HAL, est
destinée au dépôt et à la diffusion de documents
scientifiques de niveau recherche, publiés ou non,
émanant des établissements d’enseignement et de
recherche français ou étrangers, des laboratoires
publics ou privés.
Freezing precipitation in Russia and the Ukraine
I. A. Khomenko, A. R. Ivanova, N. P. Chakina, E. N. Skriptunova, A. A.
Zavyalova
To cite this version:
I. A. Khomenko, A. R. Ivanova, N. P. Chakina, E. N. Skriptunova, A. A. Zavyalova. Freezing
precip-itation in Russia and the Ukraine. Advances in Geosciences, European Geosciences Union, 2007, 10,
pp.25-29. �hal-00296975�
© Author(s) 2007. This work is licensed under a Creative Commons License.
Geosciences
Freezing precipitation in Russia and the Ukraine
I. A. Khomenko1, A. R. Ivanova2, N. P. Chakina2, E. N. Skriptunova2, and A. A. Zavyalova2 1Ecological State University, Odessa, Ukraine
2Hydrometeorological Centre of Russia, Moscow, Russia
Received: 30 June 2006 – Revised: 29 December 2006 – Accepted: 27 February 2007 – Published: 26 April 2007
Abstract. Conditions for freezing precipitation (FP),
includ-ing freezinclud-ing rain (FR) and freezinclud-ing drizzle (FZ) for 8 airports in Russia and 4 in the Ukraine are studied on the basis of 10 to 20-year series of surface observations, radiosonde and ob-jective analysis data. Statistical characteristics are presented of the FP episode durations and of occurrence frequency de-pendences on surface air temperature, wind direction and speed and cloud base height. From the radiosonde data, it is found that the “classical mechanism” of FP generation (for which, stratification of “warm nose” type in the cloud layer is necessary) is not frequent: most of FP cases are associated with “all cold” conditions in the lower 3-km layer, that is, with negative temperatures in and below the clouds.
1 Introduction
Freezing precipitation (FP), which causes icing of the parked, taking-off or landing aircraft and subsequently produces glaze, represents one of the weather phenomena that is haz-ardous for aviation. Despite all the present-day anti-icing facilities, accidents caused by icing still happen. The large-drop FP caused several fatal accidents in the 1990’s, which led to understanding that the existing means of the aircraft protection against icing should be improved. In particular, this implies improvement of the forecasting efficiency of ic-ing on aircraft, both at the surface and airborne. For this pur-pose, in a number of countries and under the support of the World Meteorological Organization (WMO), studies have been carried out on weather conditions and climatic char-acteristics of freezing precipitation (Carriere et al., 2000). Studies and forecasting of icing phenomena are of interest for a number of fields of economic activity, including com-munications, power engineering, transportation and housing.
Correspondence to: A. R. Ivanova
(ivanova@mecom.ru)
In this paper, conditions associated with FP at 8 Russian and 4 Ukrainian airports are studied. The study is based on surface observations in these airports along with radiosonde data. The results outline specific features of weather condi-tions, vertical stratification of the atmosphere and synoptic situations at these airports, under FP in different climatic and physical-geographic conditions.
2 The data
For five airports of Moscow (Vnukovo, Sheremetyevo, Do-modedovo, Bykovo, and Zhukovsky), the airports of Min-eralnye Vody, Nizhni Novgorod, Irkutsk, Odessa, Kiev (Zhulyany), Kharkov and Dnepropetrovsk, the surface ob-servations for periods of 10 to 20 years are analyzed. The locations of these airports are shown in Fig. 1.
The periods for which the hourly data are available and the months of FP occurrence are shown in Table 1. The airports of Kharkov and Dnepropetrovsk are not included in Table 1, because for these airports only 3-h observations are available during 1986–2001.
The cases of FP (including freezing rain, FR, freezing driz-zle, FZ, and “FP during last hour”) are selected from the surface observations. The radiosonde data for which FP is observed within 2-h vicinity of the launching time are also collected.
3 Surface observations
The number of times for which FP is observed (“number of cases”) varies largely from one site to another. In gen-eral, the occurrence frequencies of FP decrease from west to east. The only Asian airport under study, namely that of Irkutsk, is characterized by a complete absence of FP during the whole 10-year period. A maximum monthly mean occur-rence frequency corresponds to Mineralnye Vody (4.8% in
26 I. A. Khomenko et al.: Freezing precipitation in Russia and the Ukraine
Table 1. Periods of hourly surface observations and months in which FP occurs at the respective airports.
5 Moscow airports Mineralnye Vody Nizhni Novgorod Irkutsk Odessa Kiev
1986–1995 1986–1995 1985–2005 1986–1995 1986–2001 1985–2005
Oct–April Oct–April Oct–Feb – Nov–Feb Oct–March
Moscow Nizhni Novgorod Kiev Kharkov Dnepropetrovsk Odessa Mineralnye Vody
ons of the airports in European Russia and Ukraine, for which the FP
Fig. 1. Locations of the airports in European Russia and Ukraine, for which the FP conditions are studied in the paper.December). At the other airports, FP monthly mean maxima are 1.13 (Sheremetyevo, January), 1.03 (Domodedovo, De-cember), 1.29 (Vnukovo, January), 0.44 (Nizhni Novgorod, November), 1.35 (Kiev, December), 1.10% (Odessa). For Kharkov and Dnepropetrovsk, the maximum monthly mean occurrence frequencies derived from the available data are about 1.0% (November to January) and 1.45% (December), respectively.
The duration of the FP episodes, that is, the time period from the beginning to the end of the event, also varies largely: 55 to 83% of the the episodes last less than 3 h at all air-ports, except at Mineralnye Vody, where this percentage is only 40. The longer lasting are episodes of FP (especially FZ) in Mineralnye Vody, in 16% of the cases, they lasted longer than 10 h, with a maximum of 44 h. For Moscow air-ports, the maxima are 18 (Vnukovo), 16 (Domodedovo) and 12 h (Sheremetyevo). For the other airports, the results do not differ much from those for Moscow. The FP conditions at the airport of Mineralnye Vody differ considerably from those at the other sites, due to special geographic features in-fluencing the weather. The airport is situated at the foothills of the Great Caucasus where the surrounding terrain has a general slope from W to E. The persistent easterly (upslope) winds in the lower troposphere are typical of the cold season in this region.
The distributions of FP cases as dependent on surface air temperature, that is temperature at 2 m above the surface, are shown in Fig. 2. Maximum number of the FP cases is ob-served under temperatures −2.0 to 0◦C. The lowest temper-ature under which FP occurs is −16–14◦C (Moscow); at the other sites, FP is not observed below −14◦C (in Odessa, be-low −10◦C). Everywhere, a certain, low number of the cases is observed under positive temperatures below 2◦C. The mea-sured cloud base height (ceiling) is usually below 300 m and is, on average, higher in the cases of FR than of FZ.
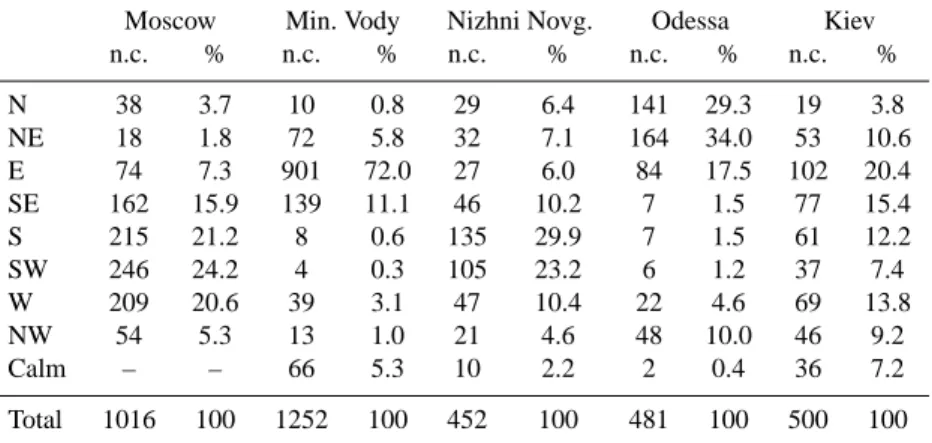
The distributions of wind direction at the airports reflect local features of circulation in the lower layers. As a result, the differences between different sites are large (Table 2). In Moscow (overall for the 5 airports), about 82% of FP cases occur under SE-S-SW-W winds, while in Mineralnye Vody, even higher percentage corresponds to E-SE winds. In Nizhni Novgorod, the situation is similar to that at Moscow airports, though the peak is less pronounced. The winds from N, NE, E dominate in Odessa, where the atmospheric cir-culation patterns in the cold season have much in common with Mineralnye Vody’s. In the central Ukraine (Kiev), the wind direction distribution is more homogeneous, because the contribution of the east winds, typical for the southern Russia and Ukraine, decreases, while westerly flows become more frequent.
Distributions of wind speeds are homogeneous enough: FP occurs under surface wind speeds below 7 m/s, in about 90% of the cases.
4 Radiosonde data
The radiosonde data are used to study the stratification of temperature and wind for the FP occurrence. The main pur-pose of the analysis is to reveal warm layers in the clouds, below and above them (stratification of “warm nose” type), and thus determine conditions in which the so called classi-cal mechanism of FP formation can act. The classiclassi-cal mech-anism suggests that the snow and ice particles, which pre-cipitate from the cold upper part of the cloud, melt in the warm layer (inside or below the cloud) and then, in a form of droplets, fall into the lower cold layer, become supercooled droplets and finally freeze up at the surface.
The cloud top is estimated from the temperature and hu-midity profiles, as the level at which relative huhu-midity de-creases down to 95 or 90%. In the cases where these
0 10 20 30 40 50 60 -15 -13 -11 -9 -7 -5 -3 -1 1 3 5 The Moscow Airports
(Total, 1016 cases) -16 -14 -12 -10 -8 -6 -4 -2 0 2 64 6 0 10 20 30 40 50 60 -15 -13 -11 -9 -7 -5 -3 -1 1 3 5 -16 -14 -12 -10 -8 -6 -4 -2 0 2 4 Mineralnye Vody (Total, 1252 cases) 6 0 10 20 30 40 50 60 -15 -13 -11 -9 -7 -5 -3 -1 1 3 5 -16 -14 -12 -10 -8 -6 -4 -2 0 2 4 Odessa (Total, 514 cases) 6 6 0 10 20 30 40 50 60 -15 -13 -11 -9 -7 -5 -3 -1 1 3 5 -16 -14 -12 -10 -8 -6 -4 -2 0 2 4 Nizhny Novgorod (Total, 230 cases) 6 0 10 20 30 40 50 60 -15 -13 -11 -9 -7 -5 -3 -1 1 3 5 -16 -14 -12 -10 -8 -6 -4 -2 0 2 4 Dnepropetrovsk (Total, 125 cases) 6 6 0 10 20 30 40 50 60 -15 -13 -11 -9 -7 -5 -3 -1 1 3 5 -16 -14 -12 -10 -8 -6 -4 -2 0 2 4 Kharkov (Total, 186 cases) 6
snow and ice particles, which precipitate from the cold upper part
0 10 20 30 40 50 60 -15 -13 -11 -9 -7 -5 -3 -1 1 3 5 -16 -14 -12 -10 -8 -6 -4 -2 0 2 4 Kiev (Total, 500 cases) 6
Fig. 2. Freezing precipitation observations (%) vs surface (2 m) air temperature. Vertical axis – case percentage (%). Horizontal axis – surface temperature (◦C).
threshold values are not reached, statistical criteria are ap-plied (Chakina et al., 2003, 2005a, b). The soundings as-sociated with FP are classified with respect to warm layer positions (Table 3).
It is found that the warm layers, in or below the clouds, are not frequent (from 18% of the cases in Nizhni Novgorod to 26% in Odessa, with an exception for Mineralnye Vody, 4%, and 16.5% on average). On the contrary, stratification of “all cold” type dominates. That is, FP from cold clouds is typical for both Russia and Ukraine. Almost all (90 to 100%) soundings under FP reveal the temperature inversion layers within the lower 3 km.
Wind stratifications are also classified with respect to the direction change with height and occurrence of low-level jets (LLJ). Again, conditions in Mineralnye Vody are very spe-cial: easterly winds, which dominate near the surface, are very frequent in the lower troposphere. In 26% of all pro-files, LLJ up to 22–25 m/s are observed. They lie mostly (75%) within the cloudy layers. The LLJ are long-lasting flows (one of them is revealed by 6 consecutive soundings) and are associated with FZ (not with FR). In other Russian airports, LLJ are also frequent enough (18% of the sound-ings in Moscow, 24 in Nizhni Novgorod). For Ukraine, this percentage is lower. Typically, wind veering with height is
28 I. A. Khomenko et al.: Freezing precipitation in Russia and the Ukraine
Table 2. Distributions of FP cases as a function of surface wind directions (hourly data): number of cases (n.c.) and % are given. Moscow Min. Vody Nizhni Novg. Odessa Kiev
n.c. % n.c. % n.c. % n.c. % n.c. % N 38 3.7 10 0.8 29 6.4 141 29.3 19 3.8 NE 18 1.8 72 5.8 32 7.1 164 34.0 53 10.6 E 74 7.3 901 72.0 27 6.0 84 17.5 102 20.4 SE 162 15.9 139 11.1 46 10.2 7 1.5 77 15.4 S 215 21.2 8 0.6 135 29.9 7 1.5 61 12.2 SW 246 24.2 4 0.3 105 23.2 6 1.2 37 7.4 W 209 20.6 39 3.1 47 10.4 22 4.6 69 13.8 NW 54 5.3 13 1.0 21 4.6 48 10.0 46 9.2 Calm – – 66 5.3 10 2.2 2 0.4 36 7.2 Total 1016 100 1252 100 452 100 481 100 500 100
Table 3. Classification of radiosonde-derived temperature profiles in the cases of FP: number of cases and corresponding % (in parentheses) are given for each class.
Class of temperature profile Moscow Min.Vody Nizh.Novg. Odessa Kiev Total
Warm nose 23 (25.8) 5 (3.9) 10 (18.6) 6 (26.1) 16 (23.2) 60 (16.6) Warm top of the cloud 7
(7.9) 3 (2.3) 4 (7.4) 2 (8.7) 3 (4.3) 19 (5.2) Warm layer above the cloud 1
(1.1) 28 (21.9) 2 (3.6) 3 (13.1) 6 (8.7) 40 (11.0)
Warm surface layer 6
(6.7) 6 (4.7) – 5 (21.7) 7 (10.1) 24 (6.6)
Warm cloud, cold surface – – – 1
(4.4) – 1 (0.3) All cold 52 (58.5) 86 (67.2) 38 (70.4) 6 (26.0) 37 (53.7) 219 (60.3) Total 89 (100) 128 (100) 54 (100) 23 (100) 69 (100) 363 (100)
observed in the lower 3 km layer, from S-SE to SW-W-NW, which indicates warm advection. For instance, in Moscow and Nizhni Novgorod, warm advection at 850 hPa occurs in 70 and 72% of FP, 79 and 83% of FR, respectively.
5 Conclusions
1. Freezing precipitation in Russia and the Ukraine repre-sents a rare event, whose monthly maximum averaged occurrence frequency does not exceed a few percent and generally decreases from west to east. In Siberia, FP is extremely rare (no cases during 10 years in Irkutsk). In North Caucasus (Mineralnye Vody), occurrence fre-quency of FP (mainly FZ) is several times higher than at the other sites under study, due to local features of synoptic processes.
2. The low clouds, which produce FP, are mainly cold. The classical stratification of “warm nose” type, with warm layer within the cloud, occurs, on average, in about 16% of FP cases, while “all cold” stratification – in about 60% of the cases.
This result is important from a practical point of view. The existing schemes for FP forecasting are based on revealing the warm layers in or below the lower clouds (Changnon, 2003; Hux et al., 2001; Robbins and Cortinas, 2002). It is evident now that this notion cannot be efficient in the situa-tions typical for Russia and the Ukraine. Other approaches, in particular, probabilistic ones should be found. Investiga-tions of FP condiInvestiga-tions, using all of the available data, can pro-vide useful indications for detection of areas with increased probability of FP.
Acknowledgements. This work has been supported by the Russian Foundation for Basic Research (Grants 01-05-64271, 04-05-64646) and by the Federal Aviation Administration of the USA (Contract CSF0908/01).
Edited by: S. C. Michaelides and E. Amitai Reviewed by: anonymous referees
References
Carriere, J.-M., Lainard, C., Le Bot, C., and Robart, F.: A climato-logical study of surface freezing precipitation in Europe, Meteo-rol. Appl., 7, 1–10, 2000.
Chakina, N. P., Skriptunova, E. N., and Ivanova, A. R.: Conditions for freezing precipitation in the airports of Russia and CIS. 1. The Moscow airports, Russ. Meteorol. Hydrol., 6, 40–58, 2003.
Chakina, N. P., Skriptunova, E. N., and Ivanova, A. R.: Conditions for freezing precipitation in the airports of Russia and CIS. II. The airport of Mineralnye Vody, Russ. Meteorol. Hydrol., 2, 27– 42, 2005a.
Chakina, N. P., Skriptunova, E. N., Ivanova, A. R., Khomenko, I. A., and Khomenko, G. V.: Conditions for freezing precipitation in the airports of Russia and CIS. III. The airport of Odessa, Russ. Meteorol. Hydrol., 9, 5–18, 2005b.
Changnon, S. A.: Characteristics of ice storms in the United States, J. Appl. Meteorol., 42, 5, 630–639, 2003.
Hux, J. D., Knappenberger, P. C., Michaels, P. J., Stenger, P. J., Cobb III, H. D., and Rusnak, M. P.: Development of a dis-criminant analysis mixed precipitation (DAMP) forecast model for Mid-Atlantic winter storms, Wea. Forecast., 16, 2, 248–259, 2001.
Robbins, C. C. and Cortinas Jr., J. V.: Local and synoptic envi-ronments associated with freezing rain in the contiguous United States, Weat. Forecast., 17, 1, 47–65, 2002.