HAL Id: hal-00297064
https://hal.archives-ouvertes.fr/hal-00297064
Submitted on 2 Jan 2008
HAL is a multi-disciplinary open access
archive for the deposit and dissemination of
sci-entific research documents, whether they are
pub-lished or not. The documents may come from
teaching and research institutions in France or
abroad, or from public or private research centers.
L’archive ouverte pluridisciplinaire HAL, est
destinée au dépôt et à la diffusion de documents
scientifiques de niveau recherche, publiés ou non,
émanant des établissements d’enseignement et de
recherche français ou étrangers, des laboratoires
publics ou privés.
Identifying unstable rock blocks by measuring
micro-tremors and vibration on cliffs
H. Tanaka, K. Fujisawa, K. Asai
To cite this version:
H. Tanaka, K. Fujisawa, K. Asai. Identifying unstable rock blocks by measuring micro-tremors and
vibration on cliffs. Advances in Geosciences, European Geosciences Union, 2008, 14, pp.165-171.
�hal-00297064�
Received: 18 June 2007 – Revised: 15 September 2007 – Accepted: 20 September 2007 – Published: 2 January 2008
Abstract. It is important to identify unstable rock blocks
and take countermeasures to prevent sudden rock fall disas-ters. However, identifying such blocks visually is extremely difficult, so an identification method using peculiar features of unstable blocks must be developed. The method reported here uses a vibrometer, which is inexpensive and easy to op-erate.
In order to assess the feasibility of the method, a field ex-periment was carried out on rock cliffs in three regions of Japan where unstable blocks are likely to exist. Vibrome-ters were set up on the cliffs to capture two types of vibration waves in three dimensions, i.e., micro-tremor and reactive vi-bration. The former type naturally exists all the time, while the latter is generated only by applying stimulation waves. At least one of the vibrometers was installed on stable base-rock to compare the results with the wave patterns of unstable rock blocks.
In addition to conventional items (amplitude, frequency spectrum, vibration particle trace), trace accumulation length, that is the accumulation of the trace length of a vi-brating particle for ten seconds, was introduced to analyze the patterns for both types of wave.
As a result, unstable rock blocks were found to generate higher amplitudes of vibration waves than stable rock blocks, and different patterns of frequency spectrum, direction of vi-bration particle trace, and trace accumulation length. Hence, vibrators were shown to be useful for identifying unstable rock blocks. In particular, by using trace accumulation length as an indicator, the stability of a block can be evaluated with-out generating stimulative waves, providing a direction for developing a cost-effective simple method for identifying un-stable blocks in future.
Correspondence to: K. Fujisawa
1 Introduction
Rock failure is induced by many causes, e.g. rainfall, snow-fall, freeze-thaw, wind, earthquake, and human causes (Japan Road Association, 2000). When this failure does occur, it causes severe damage. On cliffs facing roads or human habi-tations in particular, a rock failure claims human lives. So it is important to prevent a disaster caused by rock falling from a rock cliff by accurately identifying unstable rock blocks on a rock cliff to monitor them and take countermeasures to prevent their failure. However, unstable rock blocks are usu-ally identified by studying the distribution and aperture of cracking visible on the rock cliff by a surface survey, but it is difficult to reliably perform such a survey visually from the ground surface, which means that accurately identifying un-stable rock blocks is extremely difficult. Although physical methods to evaluate the stability of rock blocks improve the current situation, they do not exist as far as the authors know. Hence we carried out a field test to develop a method of simply and precisely identifying unstable rock blocks by measuring vibrations of a rock cliff. This method of identify-ing unstable rock blocks is based on the idea that in contrast to stable rock in which surrounding cracks adhere closely and are integrated with the foundation, in unstable rock blocks, the cracks have opened and deteriorated, causing separation from the foundation, with the result that unstable rock vi-brates more than stable rock (Fig. 1).
2 Outline of the measuring technology
To apply this measuring technology, a number of vibrome-ters are installed on a rock cliff to measure the micro-tremors (micro-tremors occurring at all times) of rock blocks and the vibrations produced in reaction to stimulation vibrations, and the amplitudes or wave lengths (frequencies) are compared to evaluate the stability of the rock blocks (Landslide
Re-166 H. Tanaka et al.: Identifying unstable rock blocks
Figure 1. Image of this measuring method
Fig. 1. Image of this measuring methodFigure 2. Vibrometer shape and its installation
Fig. 2. Vibrometer shape and its installation.
search Team, Erosion and Sediment Research Group, 2007). At this time, the amplitude of vibrations applied to the cliff is not constant, so in principle, one measurement point is set on a known stable baserock to measure its vibrations. The vibrometers that are used can measure vibrations in three di-mensions, and their size is approximately 8×8×4 cm. Each vibrometer is equipped with an approximately 8cm long spike and is installed by drilling a hole in the rock, insert-ing the spike in the hole, then fixinsert-ing it in place with putty (Fig. 2). They are installed by rock climbers (Fig. 3).
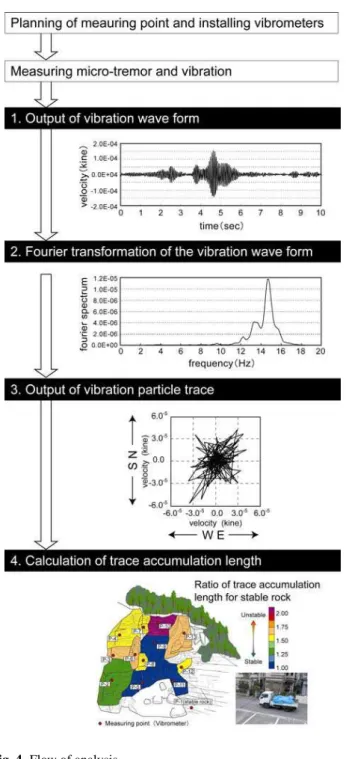
The vibration that has been measured is analyzed to eval-uate the stability of rock blocks as shown in Fig. 4. First, the vibration wave form is output and its amplitude and the way it declines, and other characteristics are visually observed to judge the unstability at the measurement point. Secondly, a Fourier transformation of the vibration wave form is per-formed to obtain the frequency spectrum. The results of the frequency spectrum analysis are applied to judge whether or not measurement points are on the same rock block, based on characteristics such as the existence/non-existence of a dom-inant frequency, its value, etc. Third, because the vibration is measured in three dimensions, combinations of two dimen-sions are formed to output the vibration particle trace in a to-tal of three directions: one horizonto-tal direction and two ver-tical directions. The vibration particle trace visually shows
Figure 3. A rock-climber installing vibrometers
Fig. 3. A rock-climber installing vibrometers.
the amplitude of the vibration, but also permits observation of the direction of the vibration and allows the evaluation of the instability of each measurement point accompanied by a judgment of whether or not they are on the same block. Fourth, trace accumulation length (cumulative length of the trace of the vibration of a measurement point within a fixed period of time) is obtained to represent the vibration ampli-tude numerically based on the vibration particle trace. This value is used to establish the priority of relative instability of unstable blocks. Trace accumulation length is a new concept applied by this measurement technology, and is a value ob-tained by accumulating the lengths of traces moved by vibra-tion at the measurement points on rock during a fixed period of time.
3 Field test results
3.1 Relationship of stability and vibration properties of a rock block
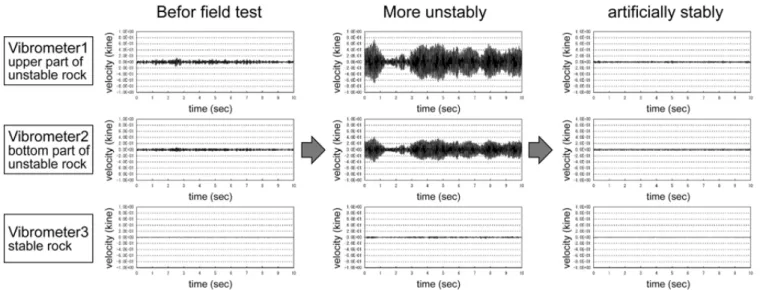
In Site A where overturning type rock failure had actually occurred, the relationship between the stability and vibration properties of rock blocks was surveyed (Asai et al., 2003, 2005). Figure 5 shows the state of the rock cliff and the lay-out of the vibrometers. The rock blocks are composed of sandstone that is about 4 m high, 2.5 m wide, and 1m thick, and there are open cracks on their back surfaces. During the test, the bottom of the rock block was destabilized by crush-ing or the rock bloc was stabilized by pushcrush-ing it towards the mountain to artificially vary the stability of the rock block and to measure the rock vibrations under each state. The vi-brometers were installed at two locations at the top and bot-tom of rock block and at one point on stable rock.
Figure 6 shows the normal micro-tremors before the rock block was destabilized and when its stability was varied.
Figure 4. Flow of analysis
Fig. 4. Flow of analysis.When the rock block was destabilized, its vibrations were greater than in its previous state. Later when the rock block was stabilized, its vibrations fell.
This demonstrates there is a correlation between the stabil-ity and the vibration properties of the rock block, so that it is possible to evaluate the stability of a rock block by analyzing the state of its vibrations.
Figure 5. Situation at Site A
Fig. 5. Situation at Site A.3.2 Identifying unstable rock blocks by vibration measure-ments
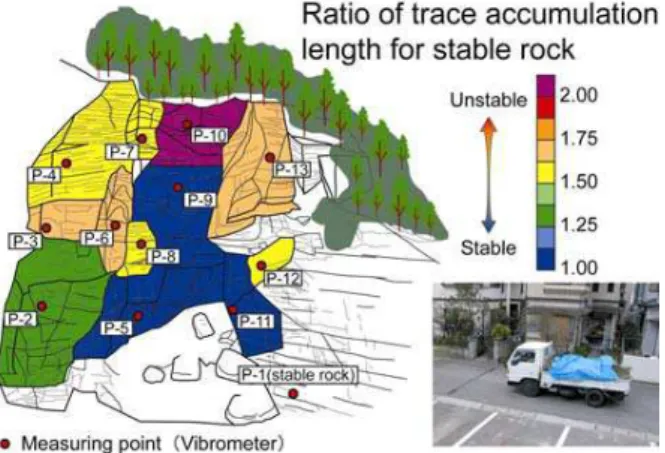
In Site B, vibration measurements were done in order to iden-tify unstable rock blocks (Asai, 2004). This rock cliff is at risk of rock failure so preventive measures must be taken. The rock cliff that is made of crystalline schist is divided into many blocks by horizontal cracks formed by the joint faces and vertical cracks at right angles to the horizontal cracks. It was hypothesized that it includes many unstable rock blocks. Figure 7 shows the state of rock cliff and the layout of the measurement points. The measurements were done by in-stalling measurement points at a total of 13 locations, includ-ing stable rock (P-1) installed on the lower right so that the major rock blocks are encompassed. The measurements were performed to measure normal micro-tremors and vibrations produced by artificial vibrations applied by the passage of a two-ton truck and by an oscillator.
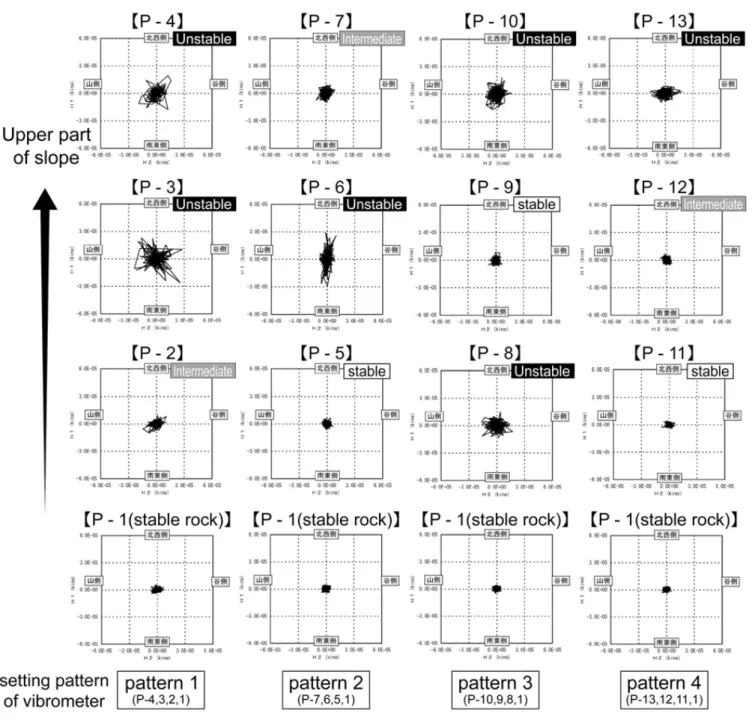
The results of the measurements when vibrations were ap-plied artificially by the two-ton truck are shown. Figure 8 shows the plane vibration particle trace. And Fig. 9 shows the ratios of the trace accumulation lengths obtained from the vibration particle traces for the other rock blocks with the value for the stable rock block (P-1) as the reference value.
Judging from the measurement values, the stability of this rock cliff was evaluated as shown below.
1. P-5, P-9, and P-11 are stable, because the fluctuation of those vibration particle traces are small similarly to that of the stable rock blocks (P-1) (Fig. 8). Also the ratios of trace accumulation length for stable rock are low for those blocks (Fig. 9).
2. P-3, P-4, P-6, P-8, P-10, and P-13 are unstable, because the fluctuation of those vibration particle traces are large compare to that of the stable rock blocks (P-1) (Fig. 8). Also the ratios of trace accumulation length for stable rock are high for those blocks (Fig. 9).
168 H. Tanaka et al.: Identifying unstable rock blocks
Figure 6. Relationship between rock stability and vibration
Fig. 6. Relationship between rock stability and vibration.
Figure 7. Situation at Site B
Fig. 7. Situation at Site B.
3. P-2, P-7, and P-12 are intermediate state (between sta-ble and unstasta-ble), because the fluctuation of those vi-bration particle traces are likely small as to that of the stable rock blocks (P-1) (Fig. 8), but the ratios of trace accumulation length for stable rock are intermediate for those blocks (Fig. 9).
And if the rock blocks are integrated, the directions of their vibrations are harmonized. Therefore, judging from the dominant vibration direction of the vibration particle trace shown in Fig. 8, at P-3, P-6, and P-8, there were unstable rock blocks separated from the rock blocks above them. A detailed survey of the Site was done, confirming that at P-3, P-6, and P-8, there were clearly opened cracks on the front
and side surfaces, and these were unstable rock blocks com-pletely separated from the foundation.
It can be concluded that this is an effective method of using vibrometers to evaluate rock block stability and to identify unstable rock blocks.
3.3 Judging the effectiveness of rock adhesion work by vi-bration measurements
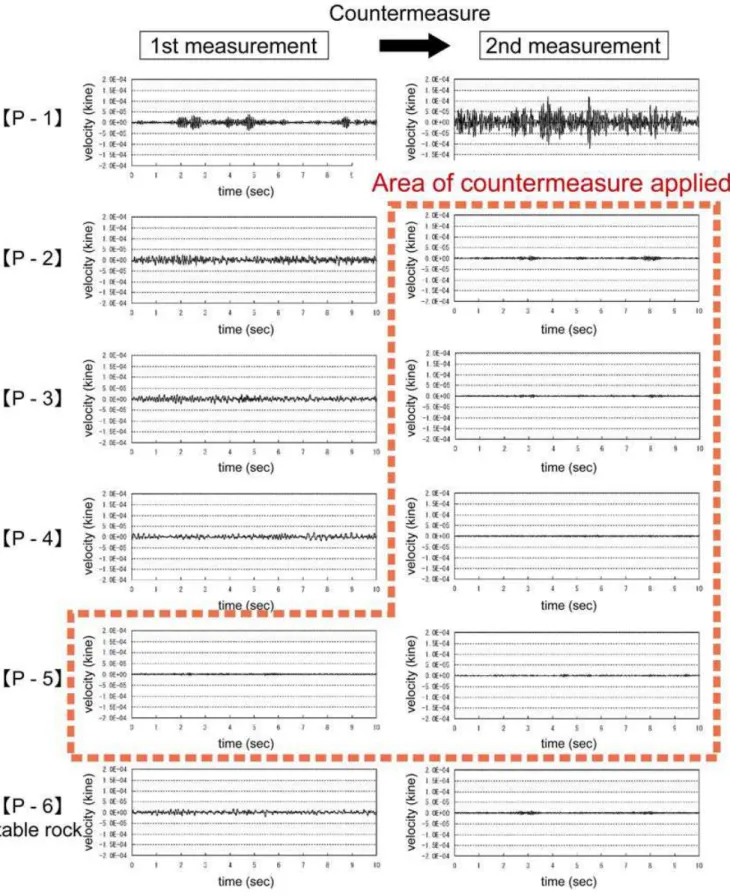
On a rock cliff in Site C, bonding material was injected into open cracks on the unstable rock block. On this cliff, vi-bration was measured before and after this was done in an attempt to make a judgment of the effectiveness of this coun-termeasure by this method (Asai, 2005). Figure 10 shows a sketch of the rock cliff, the state of progress of the coun-termeasure work, and locations of measurement points (P-1 to P-6). The measurements were performed once when the countermeasure was completed to above P-5 and a second time when it was completed to above P-2.
Figure 11 shows the wave form when a vehicle passed. The first measurement showed small amplitude at P-5 where the countermeasure was already completed, and the further up the cliff the measurement points – from P-4 to P-1 – the larger the amplitude. In contrast, the second measurement shows that the amplitude at P-2 to P-4 where the counter-measure was newly taken was small as at P-5. But, at P-1 where the measure was not taken, the amplitude continued to be large.
For the above reasons, the fluctuation of the amplitude of rock vibration that was measured is in harmony with the state of progress of the countermeasure, and its effectiveness can be judged by measuring amplitude.
Figure 8. Results of measuring vibration particle traces
Fig. 8. Results of measuring vibration particle traces.170 H. Tanaka et al.: Identifying unstable rock blocks
Figure 9. Distribution of unstable rock blocks estim
Fig. 9. Distribution of unstable rock blocks estimated by stimula-tion waves.4 Conclusions
This research obtained the following results.
1. Results of testing performed by artificially varying the stability of rock blocks and measuring their vibrations have shown that there is a correlation between stability and vibration properties of rock blocks, and that the sta-bility of a rock block can be evaluated by analyzing the state of its vibrations.
2. The results of testing performed by measuring vibra-tions of a rock cliff requiring countermeasures have shown that measuring vibrations is an effective method of evaluating stability of rock cliffs and of identifying unstable rock blocks.
3. The results of testing performed by measuring vibra-tions before and after countermeasures on an unstable rock cliff have shown that rock vibrations and progress of the countermeasure are in harmony, and that this method is a useful way to judge the effectiveness of countermeasures on an unstable rock cliff.
Edited by: P. Fabian
Reviewed by: R. Supper and D. Keefer
Figure 10. Situation at Site C
Fig. 10. Situation at Site C.References
Asai, K., Fujisawa, K., Osanai, N., and Nishimoto, H.: Study of Estimation Method for Unstable Rock Block by Vibration Mea-surement on Rock Slope, Journal of Public Works Research In-stitute, 47, 4, 48–53, 2005 (in Japanese).
Asai, K., Fujisawa, K., Osanai, N., and Tsuji, M.: Application of Vibration Measurement for Identifying Unstable Rock Blocks in the Rock Slope, Proc. of the 43th Conference of the Japan Land-slide Society, 527–530, 2004 (in Japanese).
Asai, K., Osanai, N., Chida, Y., Nakano, M., Terada, H., Tsuji, M., and Onoda, S.: Experimental Examination on Relationship between Micro-tremors of Rock Block and Unstability of the Block, Proc. of the 42th Conference of the Japan Landslide So-ciety, 563–566, 2003 (in Japanese).
Japan Road Association: An Anti-falling Rock Measure Manual, 2000 (in Japanese).
Landslide Research Team, Erosion and Sediment Research Group, Public Works Research Institute: Technical manual for vibra-tion measurement on rock cliff to identify unstable rock blocks (draft), Public Works Research Institute document, No. 4051, 2007 (in Japanese).