Line shape of the μ H(3 p - 1 s ) transition
7
0
0
Texte intégral
Figure
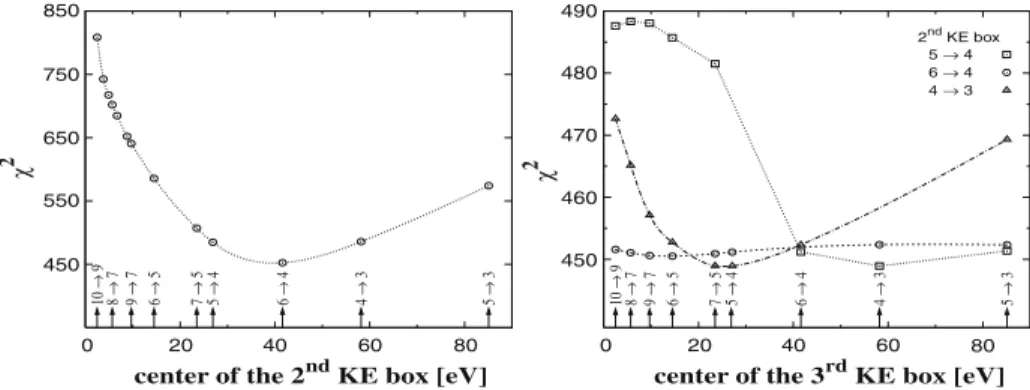
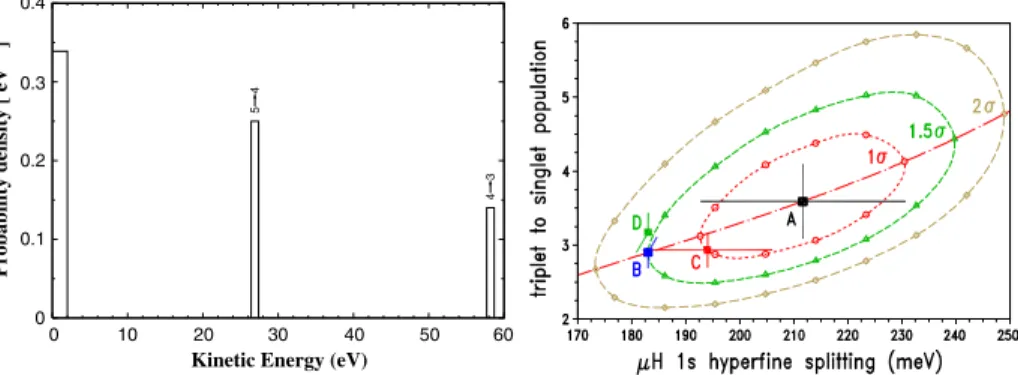
![Fig. 1 Left: Kinetic energy distribution of μ H atoms in the 3p state for a hydrogen density of 12.5 bar as predicted from ECSM [12–14] using a) cross sections calculated by [12–14] (dashed curve) and b) recalculated cross sections [25] stimulated by the p](https://thumb-eu.123doks.com/thumbv2/123doknet/14845645.627206/3.659.71.587.111.210/kinetic-distribution-hydrogen-predicted-sections-calculated-recalculated-stimulated.webp)
Documents relatifs
