HAL Id: hal-03164693
https://hal.uca.fr/hal-03164693
Submitted on 10 Mar 2021
HAL is a multi-disciplinary open access
archive for the deposit and dissemination of
sci-entific research documents, whether they are
pub-lished or not. The documents may come from
teaching and research institutions in France or
abroad, or from public or private research centers.
L’archive ouverte pluridisciplinaire HAL, est
destinée au dépôt et à la diffusion de documents
scientifiques de niveau recherche, publiés ou non,
émanant des établissements d’enseignement et de
recherche français ou étrangers, des laboratoires
publics ou privés.
The leaning Puy de Dôme (Auvergne, France) tilted by
shallow intrusions
Michael Petronis, Benjamin van Wyk de Vries, Daniel Garza
To cite this version:
Michael Petronis, Benjamin van Wyk de Vries, Daniel Garza. The leaning Puy de Dôme (Auvergne,
France) tilted by shallow intrusions. Volcanica, Presses Universitaires de Strasbourg, 2019, 2 (2),
pp.161-189. �hal-03164693�
O
V L O
V
NI O
V
RESEARCH ARTICLE
V L O
O
V
NI O
V
RESEARCH ARTICLE
V L O
O
V
NI O
V
RESEARCH ARTICLE
The leaning Puy de Dôme (Auvergne, France)
tilted by shallow intrusions
Michael S. Petronis
*α, Benjamin van Wyk de Vries
β, Daniel Garza
ααEnvironmental Geology, Natural Resources Management Department, New Mexico Highlands University, Las Vegas, New Mexico, 87701, USA.
βUniversité Clermont Auvergne, Observatoire du Physique du Globe de Clermont, Laboratoire Magmas et Volcans, UMR6524-CNRS
Abstract
Monogenetic lava domes are a special type of volcanic structure, prone to mass wasting and explosive eruption hazards. The existence of such domes raises fundamental questions about the nature of monogenetic volcanism. We study the iconic Puy de Dôme (Chaîne des Puys, Auvergne) that gave its name to ‘dome’ landforms. It is asymmetric with one side more rugged and steeper than the other. The Puy de Dôme grew rapidly in one simple pulse from a bulging shallow intrusion, the Petit Puy de Dôme, and then solidifiedin situ. Using mapping and paleomagnetism
we find that it was subsequently tilted by ~17° to the southwest by further surface-bulging inflation of the Petit Puy de Dôme intrusion. During the tilting, there were landslides and there was a final small phreatomagmatic eruption. The dome’s history verges on polygenetic, spanning several hundred years of intrusion and eruption, extending hazard periods for such activity. We find other intrusive uplifts with paired domes and tilted cones both in the Chaîne des Puys and in other monogenetic and polygenetic systems.
Résumé
Les dômes de lave monogéniques sont un type particulier de structure volcanique, qui sont souvent associés à des glissements et des événements explosifs. L’existence de telles structures remet en cause les principes fonda-mentaux du volcanisme monogénique. Nous étudions l’iconique Puy de Dôme (chaîne des Puys, Auvergne) qui a donné son nom à la forme géomorphologique connue comme ‘dôme’. Il est asymétrique, avec un coté plus rugueux et pentu que l’autre. En utilisant de la cartographie et du paléomagnétisme, nous remarquons que le dôme fut basculé vers le sud-ouest par une intrusion superficielle, le Petit puy de Dôme, qui bomba la surface. Le puy de Dôme grossit rapidement à partir de cette intrusion, en un seul événement bref, se solidifia, et ensuite fût basculé à environ 17º. Pendant le basculement, des glissements de terrain se produisirent, suivis d’une ultime petite éruption phréatomagmatique. L’histoire du dôme s’approche de celui d’un volcan polygénique, avec une durée d’intrusion de plusieurs centaines d’années qui prolonge de manière considérable la période d’exposition aux aléas. Nous écri-vons d’autres exemples de bombements intrusifs avec des dômes jumelés dans la chaîne des Puys et dans d’autres systèmes polygéniques et monogéniques.
Keywords: Chaîne des Puys; Paleomagnetism; Lava dome; Polygenetic volcanism; Puy de Dôme
1
Introduction
Lava domes are a type of volcanic landform with very particular dynamics and hazards [Calder et al. 2015]. Monogenetic lava domes are a special class of dome, which by nature of their short, single eruption tend to preserve any evidence of processes that might oth-erwise be destroyed by subsequent eruptions in poly-genetic volcanoes [Németh 2010]. Yet such short-lived monogenetic domes can have very complex histories and they are useful analogues for larger polygenetic systems [Kereszturi and Nmeth 2012; Valentine et al. 2017].
Of equal interest to domes are uplift structures pro-duced by near-surface magma intrusion, which are
*Corresponding author:mspetro@nmhu.edu
also well-preserved in monogenetic volcanic fields [van Wyk de Vries et al. 2014], and are found to be common in many settings [e.g.Reeves et al. 2018; Magee et al. 2017]. These structural domes were originally termed ‘craters of elevation’ [von Buch 1820], and in structural geology these features are called ‘forced folds’ [ Cos-grove and Hillier 1999], or in volcanology the terms ‘bulges’ and ‘cryptodomes’ have been used [Minakami et al. 1951; Gorshkov 1959; Moore and Albee 1981]. In this article, we have chosen to use the term ‘bulge’, as we are dealing with a surface morphological fea-ture, while we keep in mind that for structural geol-ogy we have a forced fold. Importantly, bulge features are known to deform volcanic structures, and the un-derlying intruding magma can also break the surface and be erupted [Minakami et al. 1951; Magee et al. 2017]. Thus, bulges and their intrusions are shallow
The leaning Puy de Dôme Petronis et al., 2019
sources of potentially explosive magma, which merit study as they are obvious harbingers of hazard, and are clearly identifiable as they bulge up. The Usu domes [e.g.Minakami et al. 1951]—probably the most famous polygenetic active shallow intrusion, bulge and dome system—are part of a UNESCO Global Geopark, where the cycle of bulging, eruption and recovery is a central theme for risk awareness [Okada et al. 2016; Nakada 2018].
The study of near surface intrusion uplift and mono-genetic edifice growth encompasses the essential ques-tion of how volcanoes form and how they erupt, a subject which has been debated since volcanology be-gan. The Puy de Dôme in the Chaîne des Puys (Cen-tral France) is a classic monogenetic volcanic dome, and its name is one of the origins of the term ‘vol-canic dome’, in use since the Puy de Dôme was recog-nized as a volcano in the mid 18thCentury [Guettard
1752]. It has been a focus of volcanological study since this time, as the Chaîne des Puys has continually at-tracted the attention of scientists by virtue of the di-versity of volcanic features, its accessibility, and its par-ticular visibility on a plateau above the Limagne Rift. This clarity of expression has led to the ‘Chaîne des Puys–Limagne fault tectonic arena’ being included on the UNESCO World Heritage list in 2018 for rifting-related tectonics and magmatism, exemplified by the Puy de Dôme (van Wyk de Vries et al. [2012], UN-ESCO:http://whc.unesco.org/en/list/1434). The Puy de Dôme has recently been studied for the conditions of dome eruptive dynamics and structure [Miallier et al. 2010;Martel et al. 2013;Portal et al. 2016;Boudon et al. 2015;France et al. 2016], while its smaller neigh-bour, the Petit Puy de Dôme, has been studied for in-trusion related uplift [van Wyk de Vries et al. 2014]. In this latter paper, the authors suggested that the dome’s eruption was fed from the Petit Puy de Dôme intrusion that created the uplift, however this connection was not studied in detail.
Despite this recent attention, detailed knowledge of Puy de Dôme’s emplacement history through structural mapping and especially the detailed geomorphology is lacking. The morphology of the the dome is intrigu-ing: like the leaning tower of Pisa (also a World Her-itage site), one side of the Puy de Dôme is steeper than the other, a feature that has attracted the attention of many geologists, and is the focus of our current inves-tigations.
In this study, we have taken advantage of the in-creased interest in the area as a prospective UNESCO World Heritage site, which has promoted more detailed mapping and provided LiDAR data (openly available on CRAIG—Centre Regional d’Auvergne des Informa-tions Géographiques: https://www.craig.fr/). The Li-DAR comes from two datasets, that of the city of Clermont-Ferrand (5 m spacing), and from the Li-dArverne campaign (0.5 m spacing).
Paleomagnetic data are a valuable complement to
structural data, with which we expected to provide information on the rotation of parts of the dome af-ter cooling. Thus, while mapping the dome we also collected drill core samples for paleomagnetic and anisotropy of magnetic susceptibility analysis (unfor-tunately these latter AMS data are inconclusive, but are included as an annex for completeness).
While the motivation for this study was initially to study the complexities of the growth of the Puy de Dôme and to compare these observations and data with other domes studied around the world [e.g. Carrasco-Núñez and Riggs 2008;Duffield et al. 1995;Závada et al. 2009], we found quickly that the Puy de Dôme was best understood in context of its surrounding geology and that it was but one part of a prolonged intrusion and eruption event.
We expected from early field work to find evidence of complex rotations of parts of the dome as it grew. However, the paleomagnetic data did not support this hypothesis, suggesting a more simple growth with sub-sequent slow cooling for the dome itself. In contrast, a complex multistage eruption sequence was uncov-ered including associated features like the Petit Puy de Dôme, hinted at from earlier work [Miallier et al. 2010;
van Wyk de Vries et al. 2014]. This activity started be-fore the emplacement of the Puy de Dôme, with up-lift and bulging, and it continued after the dome was formed. This late stage activity deformed and tilted the dome, causing faulting, collapse events and landslides, and creating its present morphology.
1.1 Description of the Puy de Dôme
The Puy de Dôme is the tallest volcano within the Chaîne des Puys at 1,465 m, and has remained for more than two millenia an iconic symbol for the region (on the summit there are the remains of the Roman tem-ple of Mercury built circa 1st century BCE, probably over a previous Gaullish religious site) and is one of the most visited volcanic domes in the world [Jerram et al. 2017]. The Puy de Dôme is about 11,000 years old, and is one of the youngest volcanoes in the Chaîne des Puys (Figures1and2). The Chaîne des Puys is an ~40 km long north-south trending alignment of mono-genetic domes, cones, and maars that began erupting about 95,000 years ago [Camus et al. 1995;Boivin et al. 2017]. The Chaîne is built on the ‘Plateau des Dômes’, formed of Hercynian basement and it is parallel to the Limagne fault (Figure 1), which forms the western bor-der of the Limagne rift, part of the larger European Cenozoic Rift System [Michon and Merle 2001].
The Puy de Dôme is a classic lava dome, with steep sides, a flat top, and a broad breccia apron (see Fig-ure 2). Morphologically, it has two distinct sides that have been interpreted as two phases of growth and col-lapse [Camus et al. 1995;Camus 1975]. On the south and western flanks, the Puy de Dôme is rocky with steep slopes marked by radial ridges, and punctuated
Figure 1: Location map of the Puy de Dôme, set in the Chaîne des Puys, aligned on the shoulder of the Limagne Rift, near Clermont-Ferrand. Their location within France, and the location of the geological map (Figure 2) are shown.
by small pinnacles or spine-like structures (Figures3,
4,5,6and7). In contrast, the eastern flank of the Puy de Dôme is smooth and gently sloping and lacks the rugged nature of the south and western flanks (Figure 3
toFigure 7).
The north-east side was suggested to have been em-placed onto the eastern margin of the first dome after flank collapse [Camus 1975]. Alternatively, it has been suggested that the dome is mostly the product of one main eruption, which changed from endogenous to ex-ogenous, covering the initial lava carapace and block and ash deposits with thick cemented ash layers on the northeast side from a final small eruption [Boivin et al.
2017].
The internal structure of the Puy de Dôme has been investigated with electromagnetic and gravity tech-niques and and muon tomography, revealing various zones of different degrees of fracturing and/or porosity arranged around a central conduit [Portal et al. 2016;
Cârloganu et al. 2013]. The dome partially covers possi-bly two previous scoria cones, seen in geophysical data, called the Creux de la Berte (also visible in the land-scape e.g. Figure 5), and another mostly hidden cone called the Cornebeuf [Boivin et al. 2017].
To the north-east of the dome the Petit Puy de Dôme is a prominent bulge formed by 10s to 100s of meters
The leaning Puy de Dôme Petronis et al., 2019
Figure 2: Topography and geology of the Puy de Dôme area. [A] Shaded relief image using the LiDAR data for Clermont-Ferrand (CRAIG dataset). [B] Geological map, based on the ‘Volcanological map of the Chaîne des Puys’ [Boivin et al. 2017], and previous fieldwork [van Wyk de Vries et al. 2014]. The Puy de Dôme is in the centre of the shaded relief image.
of bulging uplift over a shallow intrusion [van Wyk de Vries et al. 2014]. van Wyk de Vries et al. [2014] sug-gested that this bulge pierced the surface at the south-west to form the Puy de Dôme itself. The eruption age estimates of the Puy de Dôme range from ~12,000 BP to ~9,700 BP based on U–Th age determinations [Condomines 1997], thermoluminescence dating [Faïn et al. 1988;Faïn et al. 1988], and radiocarbon dates on peat deposits within and beneath the pyroclastic ma-terial [Juvigné and Gewelt 1987]. Most recently, using tephra chronology,Miallier et al. [2010]concluded that
the Puy de Dôme was erupted at about 11,000 BP, and may have had two eruptions—the main dome forming event, and a later phreatic event (at about 10,700 BP)— before being covered by a vulcanian pumice eruption from the Kilian crater 500 m to the south-west at 9,400 BP [Colombier et al. 2017].
The Puy de Dôme is composed of a greyish tra-chyte with phenocrysts of potassic oligoclase, sanidine, biotite, and rare green clinopyroxene [Condomines 1997]. Titanomagnetites were the likely initial oxide mineral phase but they have been extensively replaced
Figure 3: Maps of the Puy de Dôme. [A] Shaded relief map with transparent slope map overlay. This shows the steepest parts of the Puy de Dôme on the south-west side. [B] Contour map that shows the steep, closely-spaced crenulated contours on the south-west side, the smooth eastern contours, and the Petit Puy de Dôme bulge to the north-west.
by hematite [Condomines 1997]. Apatite and zircon crystals are found as inclusions within the feldspar or biotite crystals, and sometimes show epitactic growth [Condomines 1997].
2
Methods
2.1 Field work ethics and protocol
The Puy de Dôme is a protected area, and all sampling and fieldwork were carried out with prior permission
Figure 4: [A] Slope map (slopes above 20° = Green, 30° = Brown, and 40° = Yellow), showing the concentra-tion of steep slopes on the west and south, while lit-tle over 30 in the eastern part. [B] Oblique image from Google Earth with the LiDAR data draped over in trans-parency. This shows the rugged south-west slopes, the dark, smooth east flank and the Petit Puy de Dôme. ©2019 Google.
from the many local landowners and protective bod-ies. These were the village commune of Ceyssat, who own the western flanks; the Puy de Dôme ‘Grande Site’; the local Council of the Puy de Dôme UNESCO World Heritage project; the Puy de Dôme railway; and the Re-gional Park of the Auvergne Volcanoes. Field access was limited to minimise impact on the fragile geosystem and ecosystem of the volcano, which in many parts still reflects the natural state of the dome, which is slowly
The leaning Puy de Dôme Petronis et al., 2019
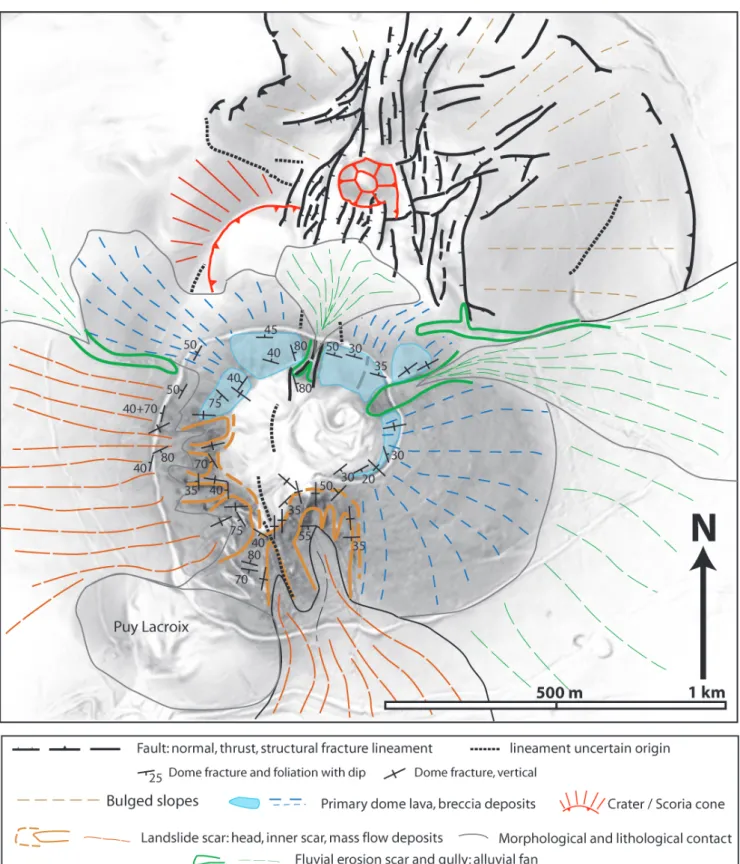
Figure 5: Morphological and structural map of the Puy de Dôme. Note the bulged area of the Petit Puy de Dôme, with its faulted area, and the Nid de la Poule crater inside the main graben. Note also the preponderance of landslide scars and debris flow deposits on the west and south of the Puy de Dôme and their lack on the smooth east side. Fracture and foliation data show two families: concentric down slope foliation with associated fractures, and radial vertical foliation and fractures. The vertical foliation is mostly seen near the top of the Puy de Dôme and on the south-west ridge.
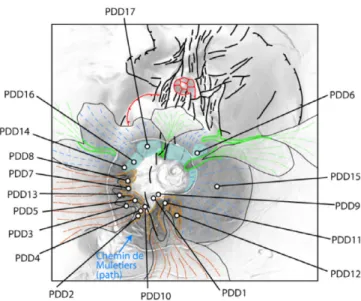
Figure 6: Location of the sample sites, given on the in-terpretative geomorphological map.
eroding and adjusting to 10,000 years of environmen-tal change.
Sampling was done discreetly, mostly out of sight of the few paths, with a few holes left visible for educa-tional purposes, as arranged with the UNESCO project. Drill core holes were not filled in, but left to blend into the rock surface, and now form very discreet features that require a keen eye to detect. The return of the sample sites to ‘natural’ conditions is monitored, and they are at present a subtle mark on rock surfaces, of-ten covered by small plants, and providing niches for small animals.
The detailed work presented here serves also to en-rich the general knowledge of the Puy de Dôme, and increase the geoheritage value, and through recognition of the various outcrop values, can allow for a more rig-orous protection of the features. The maps and our ex-perience can be integrated into a detailed geosite ventory, which would serve as a factual basis for in-formed management. The French national inventory of geoheritage [de Wever et al. 2015] does contain a Puy de Dôme geosite, which gives the fundamental descrip-tion. However, despite this sound general foundation, we do have a concern that the geological and geoher-itage values have yet to be fully integrated into the of-ficial protective practices, leaving the site exposed to disturbance far greater than our drill holes. There re-mains a need to communicate these geoheritage values, and hopefully this publication will go some way to em-phasising the value of the Puy de Dôme, and stressing the need for strict geological conservation worthy of a UNESCO World Heritage site.
2.2 Field and Remote Sensing Methods
All sides of the Puy de Dôme were mapped in detail including all the geomorphological and the structural
features, such as foliation, fractures, faults, and alter-ation. The geomorphology was also studied using de-tailed topographic maps and the LiDAR data, openly available from the CRAIG database (‘LidArverne’ data set:https://www.craig.fr/).
Eight to ten drill core samples were collected at each of seventeen sites (Figures6and10) across the Puy de Dôme using a modified Echo 280E gasoline-powered drill with a non-magnetic diamond tip drill bit. All samples were oriented using a magnetic and, when pos-sible, a sun compass. Drill site locations were precisely located using a 62st Garmin GPS.
All core samples were cut into 2.2 × 2.5 cm cylindri-cal specimens, using a diamond tipped, non-magnetic saw blade with up to three specimens per core sample obtained at New Mexico Highlands University’s Rock Processing laboratory.
2.3 Laboratory Methods
To identify magnetic mineral phases and the overall ability of these rocks to faithfully record an ambient magnetic field, we conducted a suite of laboratory ex-periments to characterise their magnetic remanence and anisotropy of magnetic susceptibility (AMS). These data are summarized inA. Equipment used included an AGICO JR6A dual-speed spinner magnetometer, home-built and ASC Scientific (Model IM-10-30) static im-pulse magnets capable of 1 to 3 Tesla peak fields, and a Quantum Design 7 Tesla magnetic properties measure-ment system. All susceptibility and Curie Point exper-iments were measured with an AGICO MFK1-A kap-pabridge susceptibility meter with a CS4 high temper-ature attachment at the New Mexico Highlands Univer-sity Paleomagnetic – Rock Magnetic laboratory.
2.3.1 Rock Magnetic Experiments
Curie point experiments are used to establish the dom-inant magnetic mineral phase(s) present in the sam-ple and to define the composition of the titanomag-netite phase(s). The samples are heated from room temperature to 700◦
C and cooled down at a rate of ~14◦C min−1in an Argon atmosphere to minimize oxi-dation of the sample. To characterize the domain state of the magnetic minerals, we conducted isothermal manent magnetization (IRM) and low temperature re-manence experiments. The IRM acquisition experi-ments involve magnetizing a sample of near zero initial remanence in progressively higher peak applied fields using an impulse magnet until the specimen reaches saturation. The shape of the IRM acquisition curve pro-vides data on the domain state and magnetic mineral-ogy.
To evaluate the stability of an induced remanence on cooling and warming, we performed FC and ZFC ex-periments. The low temperature experiments involved field cooled (FC), and zero field cooled (ZFC)
experi-The leaning Puy de Dôme Petronis et al., 2019
Figure 7: Views of the Puy de Dôme asymmetry from different vantage points, with selected sample points shown. [A] From the southwest. [B] Oblique aerial view from the north-northeast, looking over the Petit Puy de Dôme bulge. [C] From the Pariou volcano summit to the north-northeast, looking past the Petit Puy de Dôme. The northern gully of the Puy de Dôme is indicated. Location of viewpoints given inFigure 2.
ments with a Quantum Design 7 Tesla magnetic prop-erties measurement system (MPMS). The MPMS experi-ments are used primarily for magnetic mineral identifi-cation based on low-temperature crystallographic tran-sitions (e.g. the Verwey transition;Verwey [1939]), and for characterizing particle size distributions. The ex-periment involves the sample being cooled in a sus-tained DC field of 2.5 T to 10 K. The field is then switched off at 10 K and the magnetic remanence is
measured as the specimen warms back up to room tem-perature (FC remanence). The specimen is then subse-quently cooled in a null magnetic field (ZFC) to 10 K where a low temperature saturation isothermal rema-nent magnetization is imparted using a 2.5 T applied field, and the remanence is measured again on warm-ing back to room temperature (ZFC remanence).
2.3.2 Paleomagnetic Methods
Remanent magnetizations of all samples were mea-sured using an AGICO JR6A dual-speed spinner mag-netometer at the New Mexico Highlands University Paleomagnetic-Rock Magnetic laboratory. Specimens were progressively demagnetized in an alternating field (AF), typically in 10 to 25 steps, to a maximum field of 120 mT using an ASC Scientific D-TECH 2000 AF-demagnetizer. Samples with high coercivity were treated with thermal demagnetization (TH) up to a maximum of 630◦C, yet most sampleswere fully de-magnetized below 580◦C. Thermal demagnetization experiments on replicate specimens, to compare with AF behavior, were conducted with an ASC Scientific TD48 thermal demagnetizer. Principal component analysis (PCA; Kirschvink [1980]) was used to deter-mine the best-fit line through selected demagnetiza-tion data points for each sample using Remasoft 3.0 [Chadima and Hrouda 2006] (Table 1). For most sam-ples, a single best-fit line could be fit to the demagneti-zation data points. Best-fit magnetidemagneti-zation vectors gen-erally comprised 5 to 18 data points, but as few as 3 to as many as 25 were occasionally used; for less than 10 % of the samples it was necessary to anchor them to the origin. Magnetization vectors with maximum angular deviation values greater than 5° were not included in site mean calculations.
3
Results
3.1 Field and Topographic Mapping Results
The Puy de Dôme summit has low slopes, cut by small north-south trending scarps, and these flatter areas have been much modified by anthropogenic activity. In contrast, the steeper slopes retain the natural structural and morphological features of the dome (Figures8, 9
and10). The summit plateau has one high peak, which hosts a telecommunication antenna, the Observatoire de Physique du Globe de Clermont-Ferrand’s (OPGC) meteorological observatory, and the ruins of a Roman temple of Mercury. Around this peak, there are out-crops of dome lava with dome breccia at the base. The breccia descends down the flanks to the base of the dome. The Kilian vulcanian deposits [Colombier et al. 2017], which erupted just after the Puy de Dôme formed, are found in patches on the lower slopes, the summit, and in topographical depressions [Miallier et al. 2010;Miallier et al. 2012].
On the eastern and northern slopes, the flanks are smooth, cut only by one pinnacle/spine-like feature of dome lava (Figures3,4,5and6), and there are some narrow, deep erosional gullies from ephemeral streams that activate only during very strong rainfall (Figure 5). The gullies open onto alluvial fans, and these reworked slopes pass over a few hundreds of meters onto pre-Puy de Dôme lavas and tephra (Figures2and6).
Only one outcrop on the mid eastern flank (PDD15) was large enough to be considered asin situ and was
sampled. However, the good outcrop on the road shows the flank underlain by outward dipping foliated and fractured trachyte (Figure 9C).
The southern and eastern slopes of the dome are very different. Starting at the north-east, the dome lava out-crops are cut by a series of deep scars, leaving interven-ing ridges (Figures5and 8). The internal layering of the dome is uncovered, exposing down-slope dipping concentric foliation, and radial fractures with vertical-steep dips (Figures9and10). The trachyte in most out-crops is dense, massive, and sometimes crumbly, and contains few conjugate fractures, although some heav-ily fractured zones exist. The best exposures of this are seen on the road to the summit (Figure 9C), where cut-tings expose a 10s-of-cm-spaced conjugate fracture set, that in places has cm-spaced fractures that form sets of about 60–80° Riedel shears, and tension gashes be-tween 20–30° to the main fractures. The rock mass remains compact, so the structures probably formed when the rock was near the brittle–ductile transition. The rocks in this area contain only the widely spaced vertical fractures that cut the outward dipping folia-tion.
One particularly sizeable ridge on the south-west side has a series of large down-slope fractures at its base and several large open cracks on its upper side. This is buttressed on its lower edge by a large lava mass, but the the absence of lichen or other vegetation along the fractures suggests some continued movement. ( Fig-ure 9).
The landslide scars continue around the dome to the south, interrupted by a large ridge where the main hik-ing path (Chemin des Muletiers) (Figure 5) ascends to the summit. In this ridged area, the dome lava is more massive and the marked down-slope foliation is more spaced and much steeper (60–80°). On this ridge, radial foliation and fractures dominate instead, along with breccia zones and fumarole-altered outcrops. This ver-tical foliation creates a serrated morphology. The top of this area flattens and is separated from the sum-mit by a small scarp, which is tentatively interpreted as a slumped block (between sample sites PDD1 and PDD10 onFigure 5, and seeFigure 6).
To the eastern side of the large ridge, a broad land-slide scar occupies the southern flank (Figure 5), be-fore the primary smooth eastern slope of the dome is regained to the south-east. The foliation is again con-centric and down-slope within and on the edge of this scar, in addition to radial vertical fractures.
Below all the landslide scars, the terrain is rough and large blocks are mixed with a coarse angular breccia of Puy de Dôme lava. The uneven surface is very different from the smooth eastern slopes and the alluvial fans. Small ridges and scarps that strike down-slope along with the coarse breccias indicate that these are debris flow deposits (Figures5and8). In some places the Puy
The leaning Puy de Dôme Petronis et al., 2019
Figure 8: Pictures taken from the Puy de Dôme, of its slopes. [A] Looking over the old road (now train track) from the southwest side up to the west side and sample points PDD3 and PDD5. The former forms a large cliff buttress (Figure 8B) with fractures above and below the sampling site that retains a highly fractured down-slope dipping plane. The outcrops above could be an arrested or potential landslide (seeFigure 9for close up images). [B] Sample sites PDD7 and PDD 8 on the west side of the steepest part. These have steeply outwardly dipping foliation, producing slabby outcrops. Vertical radial fractures are also seen, which guide the sides of deep landslide-controlled gullies. [C] Same sample sites as [B], but viewed from the northwest side.
de Dôme material is covered or mixed with the pumice from the Kilian eruption, indicating that debris flows also occurred after this eruption.
Immediately to the north of the Puy de Dôme, the Petit Puy de Dôme is a prominent feature (Figures2,5
and 7). This is a deformed and uplifted scoria cone, with a probable trachytic intrusion below, that also caused a small phreatic eruption, the ‘Nid de la Poule’ [van Wyk de Vries et al. 2014].Figure 5shows the Petit Puy de Dôme and the faults that extend off its southern side, which are aligned with a deep gully on the Puy de Dôme and the scarps on the dome summit (views in
Figure 7).
To the south-east of the Puy de Dôme, there is an-other intrusion-related uplift called the Grosmanaux (Figure 2), which hosts the Kilian vulcanian crater. The Kilian uplift is up to 100 m, half that of the north-eastern Petit Puy de Dôme bulge [van Wyk de Vries et al. 2014].
3.2 Rock Magnetic Experiment Results
Magnetic experiments on rock samples were conducted to determine the magnetic mineralogy and domain state of the principle magnetization carriers in the Puy de Dôme. The rock magnetic data indicate that the dominant magnetic mineral phase is a cubic Fe-Ti oxide of a restricted magnetic grain size, primarily pseudo-single domain titanomagnetite with a minor amount of coarse-grained maghemite and hematite. The detailed rock magnetic results are presented inAppendix 1. 3.2.1 Curie Point Estimates
The Curie Point estimates are indicative of a single magnetic phase for most samples of a low to moder-ate titanomagnetite composition [Dunlop and Özdemir 1997]. We do not see evidence of high coercivity phase(s). These data provide evidence that the samples contain a magnetic phase that is capable of preserving a geologically stable primary remanent magnetization. 3.2.2 Isothermal Remanent Magnetization
All Isothermal Remanent Magnetization (IRM) acqui-sition curves are steep and reach ~85 % saturation by ~0.40 T with the remaining 15 % of the magnetiza-tion acquired up to 2.5 T. The results indicate the dom-inance of magnetite, likely single domain titanomag-netite of a restricted grain size, along with the presence of titanomaghemite and hematite [Özdemir and Dun-lop 2003]. These data support the Curie point estimates in that the rocks contain a magnetic phase capable of preserving a geologically stable remanence.
3.2.3 Low Temperature Remanence
The magnetic properties measurement system (MPMS) results yield similar curves on warming yet the abso-lute intensity of the magnetization remanence varies between the three representative samples. All show a suppressed Verwey transition [Verwey 1939] indicative of non-stoichiometric behavior. Ti cation substitution or partial oxidation can lower the transition tempera-ture or suppress it entirely [Özdemir et al. 1993]. We see evidence of a hematite Morin transition.
In summary, all the rock magnetic data indicate that the Puy de Dôme trachyte is a material that is capa-ble of preserving a geologically stacapa-ble remanence and there is no evidence of secondary magnetizations ac-quired after initial cooling. The remanence is likely to be a primary thermoremanent magnetization (TRM) that was acquired shortly after magma emplacement that formed the lava dome.
3.3 Paleomagnetic Results
3.3.1 General Demagnetization Behavior
Paleomagnetic data were obtained from seventeen sites across the Puy de Dôme (Figure 6). The seventeen sample sites yield overall normal polarity demagneti-zation results with a few specimens from some sites yielding reverse polarity directional data (Table 1; Fig-ure 11). The overall progressive alternating field (AF) demagnetization response is characterized by a near linear trend to the origin for most samples defined over a broad range of peak fields. Most samples yield a single-component magnetization that decayed linearly to the origin with less than 10 % of the natural re-manent magnetization (NRM) remaining after treat-ment in 80–120 mT applied field or, for high coerciv-ity phases, treatment with thermal demagnetization up to 630◦C. A few samples contained additional low co-ercivity viscous remanent magnetization (VRM) com-ponents that were readily randomized by 20 mT ( Fig-ure 11) with the remaining magnetization decaying along a linear trend to the origin.
Four sites did not yield stable end-point behaviour or had a high dispersion between specimens within the site (random normal and reverse polarity direc-tions); these four sites were rejected and will not be dis-cussed further. The thirteen accepted sites yield well-defined normal polarity magnetization directions that provided a group mean direction of D = 19.7°, I = 70.8°, α95 = 4.4°, k = 90.1, n = 13, which is statistically dis-tinct at a 95 % confidence level from the expected Qua-ternary normal polarity field direction (D = 359.3°, I = 64.2°, A95 = 5.7°) based on the average data of mul-tiple Quaternary virtual paleomagnetic pole positions (Table 2;Figure 12).
To test the dispersion of the site mean virtual geo-magnetic poles (VGPs), we compared the average VGP
The leaning Puy de Dôme Petronis et al., 2019
Figure 9: Pictures of the Puy de Dôme outcrops. [A] Fresh open fractures that are parallel to the magmatic foliation in the downslope-dipping breccia zone near sample site PDD5. [B] Massive buttress at PDD3, which is an unusually poorly foliated or fractured outcrop and which buttresses the potential landslide planes shown in [A]. This vertical face is probably the side wall of a landslide scar, which formed the elongate gully. The ope fractures are clean with no lichen, suggesting recent formation. [C] Outcrop of lava, 200 m down road on south side of Puy de Dôme. Here the trachyte lava shows the typical foliation, and outward-dipping conjugate fractures, with steeper planes as Riedel shears. While fractured, the outcrop is one coherent rock mass, suggesting that it deformed while still ductile and hot at low strain rates.
Figure 10: Pictures of sample sites showing how they are integrating back into the natural environment. All sites were chosen to be out of sight of the main tourist paths, in off-limits areas. The only exception is for a site near the restaurant terrace, where holes were drilled to be viewed by visitors. Holes were not filled-in, as they return to a ‘natural’ weathered state better with the least intervention. [A] Site PDD9, just below the summit of the Puy de Dôme on a scarp above a slight depression that might be a slumped block. [B] Site PDD1 on the very summit of the Puy de Dôme, next to the terrace on the café (note steel ring on rock). [C] Site PDD4 on the north side of the Chemin des Muletiers, the main walking path up the south-east of the Puy de Dôme.
dispersion to the predicated dispersion value for the latitude of the site (45.5° N) [Merrill and McElhinny 1983]. If secular variation has been adequately sam-pled, the observed angular dispersion estimate of site
mean VGPs should be consistent with that predicted. In this case ~17.0° with a ± error range of 18.0° to 15.5° (Table 1;Merrill and McElhinny [1983]). The estimated dispersion (S) of the thirteen accepted site mean
direc-The leaning Puy de Dôme Petronis et al., 2019
Figure 11: Orthogonal demagnetization diagrams representing the typical AF and TH demagnetization behavior [Zijderveld 1967]. Solid symbols represent the projection onto the horizontal plane, open symbols onto the vertical. The demagnetization steps are given in mT and temperature (T◦C). Magnetization (in A/m) is shown along one axis for each sample; each division equals indicated intensity. A few samples contained additional low coercivity viscous remanent magnetization (VRM) components that were readily randomized by 20 mT.
tions yields a group mean VGP dispersion of 13.3° ± 6.9° (95 % confidence); a value which is less than, yet statistically indistinguishable from, the predicted VGP dispersion estimate. From this analysis, we suggest that the thirteen sites may reflect either 1) a time in-terval covering the longer periodicities of secular varia-tion and represent a time averaged result, or 2) tectonic deformation associated with differential tilting of the dome. As we discuss below, we prefer the latter inter-pretation of the data given the field relationships.
3.4 Anisotropy of Magnetic Susceptibility Results
A1summarizes all anisotropy of magnetic susceptibil-ity data and key magnetic parameters. Km(mean bulk
susceptibility) intensities (in the SI system) are moder-ate and range from 9.81 × 10⁻³
SI to 0.24× 10⁻³
SI with a mean of 3.16× 10⁻³±2.53 × 10⁻³ SI. The AMS fabric
results reveal a near random orientation of K1lineation
and K1–K2foliation plane data; 16 of 17 susceptibility
ellipsoid shapes are oblate (A1 A). The corrected de-gree of anisotropy (P j; Jelinek [1981]) varies between
Figure 12: Paleomagnetic data from the Puy de Dôme. [A] Lower hemisphere equal area projection of site mean paleomagnetic data from the Puy de Dôme. The yellow triangle indicates the group mean result of the 13 ac-cepted sites with α95 confidence ellipse about the group mean direction. The black star is the Quaternary ref-erence direction based on the average of multiple paleomagnetic poles (Table 2). [B] Lower hemisphere equal area projection of site mean virtual geomagnetic pole positions (VGPs). The yellow triangle with A95 confidence ellipse indicates the mean Quaternary virtual geomagnetic pole position (Table 2).
1.011 and 1.164, and averages 1.067 ± 0.053, indicat-ing a weak (~6 %) degree of anisotropy. The magnetic lineation (L) and foliation (F) averaged 1.014 ± 0.015 and 1.048 ± 0.041, respectively. There was no corre-lation between the corrected degree of anisotropy (P j) and mean susceptibility (Km), and no correlation
be-tween the shape parameter (T ) and Km, P j versus T
(Km = mean bulk susceptibility, P j = corrected degree
of anisotropy, T = shape parameter).
4
Discussion
4.1 Implications of the Paleomagnetic Data
The paleomagnetic and existing geochronology data from the Puy de Dôme place magma emplacement dur-ing the normal-polarity Chron C1n (0.0 Ma–0.780 Ma) in the Holocene [Gradstein et al. 2012]. The group mean data are statistically distinguishable at 95 % con-fidence level from the expected Quaternary normal po-larity field direction (Table 2) and yield a rotation (R) and flattening (F) estimate of R = 20.4° ± 12.5° and F = −6.6° ± 7.5° relative to the expected field direction (
Ta-ble 1).
These paleomagnetic data can be interpreted as being either a time-averaged result, a spot reading of the ge-omagnetic field, or a time-averaged result with the
di-rectional discordance attributed to deformation of the dome. The dispersion of the VGPs is less than the pre-dicted value of ~17°, but there is statistical overlap. Here, we argue that the paleomagnetic data likely do not represent a time average result and the spatially variable directional data reflects tectonic deformation that has led to the discordance of the data relative to the expected field direction.
In order to evaluate the paleomagnetic data more fully to assess any possible variation in age or true dis-persion among the data, a mean discrimination test was conducted between each individual site mean [ McFad-den and Lowes 1981]. Essentially, the test compares an observed site mean direction to another observed site mean direction with the null hypothesis being that the two mean directions are separate samples from the same population of directions and the same geomag-netic field direction.
Alternatively, if the means are distinct, they were either drawn from different populations that sampled different geomagnetic field directions or sub-volcanic deformation occurred which increased the dispersion of the data between sampling locations. The mean dis-crimination test does not prove the null hypothesis, but sets a probability (in this study 95 %) of it either being accepted or rejected. The mean discrimination test re-sults reveal that seven sites are statistically distinguish-able at the >95 % confidence level from the other six
176
Table 1 – Paleomagnetic data from the Puy de Dôme, Auvergne, France. Explanation: Site, site name; N/No, number of specimens means used in site mean (N) to total number of specimen means at the section (No); Dec/Inc, site declination and inclination; R, resultant vector length; k, best estimate of (Fisher) precision pa-rameter; α95, 95 % confidence interval of the estimated site mean direction assuming a circular distribution; VGP Lat/Long, latitude and longitude of the virtual ge-omagnetic pole; Rotation (R) and flattening (F) and as-sociated error estimates (±R, ±F) [Beck 1980;Demarest 1983] with respect to the average Quaternary expected field direction. N/No Dec Inc R α 95 k V GP Rota tion Error Fla ttening Error C ommen ts UTM W GS 84 La t Long R ∆ R F ∆ F Easting Northing 11/12 9.2 70.4 10.7 8.2 32.0 79.3 32.7 9.9 26.6 -6.2 9.2 496894.9 5068463.8 8/10 359.3 70.4 7.7 10.9 26.9 80.9 0.1 0.0 35.4 -6.2 11.7 496918.9 5067416.8 6/9 32.1 67.7 5.9 8.8 58.5 68.1 67.5 32.8 25.3 -3.5 9.8 496959.5 5068514.9 8/8 16.8 76.4 7.9 6.5 74.3 69.1 23.5 17.5 30.1 -12.2 7.7 496930.4 5068407.1 9/11 18.9 72.8 9.0 3.1 273.7 72.9 38.3 19.6 13.7 -8.6 5.2 496841.9 5068443.7 9/10 29.1 71.5 9.0 2.2 527.6 68.9 51.6 29.8 11.2 -7.3 4.7 496978.1 5068907.1 11/11 10.3 75.5 10.8 6.7 46.9 71.9 18.1 11.0 29.2 -11.3 7.9 496854.2 5068508.9 6/7 16.4 31.4 5.6 20.8 11.4 58.3 151.8 17.1 25.4 32.8 22.1 reject 496853.4 5068555.9 10/10 40.5 17.0 7.5 30.2 3.5 39.4 126.6 41.2 32.3 47.2 31.7 reject 497053.8 5068497.5 5/7 27.4 70.0 5.0 4.4 299.0 70.5 57.2 28.1 15.6 -5.8 6.1 496799.9 5068479.2 12/12 22.0 70.4 11.9 4.0 116.3 73.3 51.9 22.7 14.8 -6.2 5.8 497068.6 5068482.2 5/7 24.1 66.1 4.7 20.1 15.4 73.4 73.9 24.8 58.6 -1.9 20.6 reject 497175.6 5068478.4 5/8 26.8 63.1 4.8 17.5 20.0 71.1 86.1 27.5 42.5 1.1 18.0 496879.2 5068477.2 5/6 38.3 65.9 4.9 10.1 58.2 63.9 73.0 39.0 26.8 -1.7 11.0 496930.9 5068920.6 9/10 58.9 84.8 8.4 14.5 13.5 50.0 16.6 59.6 --20.6 15.0 497617.9 5068642.0 6/9 31.3 74.6 5.6 19.0 13.3 66.0 40.9 32.0 --10.4 19.4 reject 496968.1 5068920.0 8/12 358.9 55.0 7.5 15.7 13.4 80.0 188.0 0.6 29.2 9.2 16.4 497053.2 5068940.7
Table 2 – Quaternary virtual paleomagnetic pole posi-tions and calculated expected direcposi-tions for the Puy de Dôme. Explanation: Rock Name; Age, estimated age in millions of years (Ma) or thousands of years (Ka); VGP Position, virtual geomagnetic pole position; Ex-pected Direction, based on the cited references; A95 (estimated), error estimate of the calculated pole posi-tion. Rock N ame A g e V GP P osition α 95 Expected Direction (estima ted) Ref erence Pla t Pl ong Dec Inc A95 er V ol g a Sedimen ts, C en tr al E urope 1.0 Ma 81.0 227.0 4.0 347.2 63.8 2.8 McElhinn y and Lock [1995] a Ice C av es, ID 10.130 Ka ± 0.350 Ka 82.8 81.8 2.7 10.3 64.6 1.9 Cham pion [1980] Reservior Fl ows, C O M, ID 10.240 Ka ± 0.120 Ka 79.3 352.7 1.5 356.7 71.4 0.9 Hagstrum and Cham pion [2002] ; Cham pion [1980] C av es fl ows, ML V , C A ∼ 12.700 Ka 70.2 153.4 9.9 10.8 46.4 9.6 Hagstrum and Cham pion [1994] t C artor precurcr fl ows, ML V , C A 10.676 Ka ± 0.038 Ka 75.5 335.0 2.8 347.4 72.5 1.7 Hagstrum and Cham pion [1994] alen tine C av e basal t fl ow , ML V , C A 10.850 Ka ± 0.060 Ka 78.6 330.1 4.6 349.4 70.5 2.9 Hagstrum and Cham pion [1994] thetic V GP P oles 10 Myr sliding W indow 0 Ma–10 Ma 86.3 172.0 2.6 0.9 60.8 1.9 Besse and C ourtill ot [2002] thetic V GP P oles 5 Myr sliding W indow 0 Ma–5 Ma 86.7 178.7 3.0 0.3 61.1 2.2 Besse and C ourtill ot [2002] C al cula ted Expected Direction 89.3 320.9 8.2 359.3 64.2 5.7
accepted sites (Table 1). The remaining sites are statis-tically indistinguishable from each other at >95 % con-fidence.
We interpret the statistically distinct sites to reflect some post-emplacement deformation following rema-nence acquisition. The pattern of deformation across the dome reveals that the tilting (i.e. rotation) is, for the most part, uniform with only local deformation be-tween a few site locations. We suggest that the sub-volcanic deformation from the Petit Puy de Dôme may have caused the observed discordance of the paleomag-netic data following remanence acquisition.
4.2 Emplacement and Deformation Mechanism of the Puy de Dôme
The geomorphological, structural and paleomagnetic data all indicate that the Puy de Dôme has been tilted to the south-east some time after it erupted and cooled. The paleomagnetic data also suggest that the dome ex-truded as one unit and solidified without any major reorientation of the cooled carapace. This makes the Puy de Dôme a monogenetic dome with one short-lived eruption, but the tilting and activity of the Petit Puy de Dôme began before, and continued after the sim-ple dome extrusion (Figures13and14). We note that there was probably a deflation phase of the Petit Puy de Dôme during the effusion of the dome (Figure 14), although no clear evidence has been left of this.
Subsequent to dome emplacement there was another eruption from the summit, a few hundred years after the cessation of the first (a thin soil layer is present be-tween the two deposits [Miallier et al. 2010]). A thou-sand years after this, the Kilian erupted and its prod-ucts were deposited over the Puy de Dôme, and during this interval two small trachyandesite eruptions (Nid de la Poule and possibly the Traversin) occurred, as well as the trachyte–basalt Puy de Pariou eruption just to the north-east [Miallier et al. 2012]. Kilian tephra de-posits are found on the Petit Puy de Dôme [Miallier et al. 2012], so the deformation associated with the lat-ter, and thus the tilting, could extend to around the eruption of the second Puy de Dôme tephra. Since the Petit Puy de Dôme is considered to have triggered the eruptive sequence by growing and then breaching to the south-west to allow the extrusion of the Puy de Dôme, this bulge growth both pre-dates and post-dates the Puy de Dôme.
The sequence is thus: Petit Puy de Dôme bulging > Puy de Dôme lava extrusion > ongoing growth of Petit Puy de Dôme + final Puy de Dôme small eruption > Nid de la Poule eruption (+ more bulging?) > Kilian eruption.
If we draw comparisons with current volcanic activ-ity, the Puy de Dôme–Petit Puy de Dôme growth could be seen as an equivalent of the Usu volcano domes [ Mi-nakami et al. 1951; Katsui et al. 1985; Tobita et al. 2001], which grew in a matter of weeks to months.
The long term growth of the Petit Puy de Dome could be equated to the continually deforming Alu bulge in Ethiopia [Magee et al. 2017;Pagli et al. 2012].
Thus both eruption and tilting of the Puy de Dôme probably happened over weeks to months, while the intrusion growth took maybe a few hundred years, pos-sibly extending to the Nid de la Poule eruption with a more mafic magma input. There may have been infla-tion and deflainfla-tion periods, the latter associated with the eruptions.
The petrographic and intrusive sequence of events can be seen as a prolonged monogenetic eruption, dur-ing a heightened period of activity in the Chaîne des Puys, which verged on polygenetic in its duration and complexity.
The Puy de Dôme is not the only volcano in the Chaîne des Puys to have been affected by subse-quent, geographically-close eruptions. For example, the Grand Suchet is tilted to the west by the Puy Suchet trachyte intrusion [van Wyk de Vries et al. 2014]. Also, the Chopine trachyte intrusion deformed the Puy de Gouttes before destroying the latter in a sector collapse [van Wyk de Vries et al. 2014]. Other cones, such as the Montchie and Lemptégy have had multiple eruptions [Petronis et al. 2013;Miallier et al. 2013], separated by long time-periods during which the edifices have com-pletely cooled. An extended sequence is also seen with the Pariou eruption and that of the Puy de la Nugère [Camus et al. 1995; Boivin et al. 2017], that go from initial trachyte to basalt.
The response of each cone to the subsequent intru-sion/eruption varies. In general they all are deformed and tilted, and may additionally be pierced by erup-tions and/or suffer landslides. The Puy de Dôme itself has been tilted, pierced by a small eruption and has un-dergone a landslide on the south-west side. The reason that there was not a larger collapse, such as that of the Gouttes, might relate to the strength and structure of the Puy de Dôme trachyte, which ensured that the core remained intact while only some of its outer carapace was shed on the outward-dipping planes.
As many cones in the Chaîne des Puys have been af-fected by subsequent tilting, such activity might be re-lated to the dense concentration of edifices; the Chaîne has the highest concentration of any monogenetic field [Corvec et al. 2013]. Such interference between edifices would be less likely in more dispersed monogenetic fields. On stratovolcanoes, pulses of magma intrusion follow one after another, and so similar tilting could occur. However, the magma volume may be small with respect to the volume of the edifice, creating a partial bulge rather than tilting, such as at Mount Saint Helens or Bezymianny [van Wyk de Vries et al. 2014]. Larger intrusions might occur, but the likelihood of magma breaking out at the surface might limit the scale of up-lift and tilting, instead giving rise to the formation of a satellite cone. Also, the larger size of a stratovolcano with respect to its internal strength would favour
de-The leaning Puy de Dôme Petronis et al., 2019
Figure 13: History of the Puy de Dôme area. [A] Oblique image of LiDAR-derived shaded relief (CRAIG dataset), overlain on the Google Earth image of the Puy de Dôme area. Line of cross section inFigure 14shown in yellow. [B] Map of the area up to 10,000 years before the start of the Petit Puy de Dôme intrusion. [C] Map after 9,400 years (e.g. like inFigure 2), with the newly appeared volcanoes and structures indicated. Compare this diagram with the cross-sections inFigure 14.
formation of a relatively smaller area. Thus tilting of an entire, large stratovolcano seems unlikely, at least by shallow intrusions, but growth of larger magma cham-bers at greater depths could provide the volume and
area of uplift to tilt a large volcano. The large-scale sliding of the Mull volcano [Mathieu and van Wyk de Vries 2009], or the present-day Mount Etna could be considered in this context [Borgia et al. 1992]. The huge
Figure 14: Summary cartoon of the sequence of events around the Puy de Dôme. [A] Pre-Puy de Dôme before 11,000 years BP. The area is mostly older scoria cones, with one trachyte dome, the Petit Suchet, emplaced a few thousand years before. [B] Start of activity with shallow intrusion starting to create the Petit Puy de Dôme bulge. [C] Trachytic magma breaks through on the south of the bulge to allow the Puy de Dôme to grow. We note that there was probably a deflation phase of the Petit Puy de Dôme during the effusion of the dome, although no clear evidence has been left of this. The dome gains a carapace of ash towards the end [Boivin et al. 2017]. [D] The cooled Puy de Dôme is then tilted by continued growth of the Petit Puy de Dôme, and a small summit eruption occurs around 10,700 BP. [E] Activity stops, and a small trachyandesitic eruption cuts the Petit Puy de Dôme (Nid de la Poule) and possibly a small vent opens on the Traversin. This activity may have occurred at about 10,000 years with the Pariou eruption. Then at 9,400 BP the whole area is covered by Kilian eruption deposits.
The leaning Puy de Dôme Petronis et al., 2019
uplift and sliding identified at Heart Mountain, Utah, USA [Beutner and Gerbi 2005] shows that such grand-scale tilting is possible. So finally, while it appears most likely that tilting is more common on small, mono-genetic volcanoes, especially lava domes, the same pro-cesses can occur in a scaled up way in larger systems.
The message for monitoring and hazards is that broad uplift beneath one side of a volcano might be ac-companied by a collapse of the opposite side, in the di-rection possibly least expected.
The paired collapses on opposite flanks of Momba-cho, Nicaragua, might be an example of this [Shea et al. 2007], where intrusion and alteration of a bulge on the SE side caused a landslide on the south side, as well as generating a corresponding slide on the north side of the volcano. Therefore, when volcanoes start to deform due to an intrusion, a whole range of possible scenarios need to be considered. It is only as the growth of such a bulge evolves that the outcome might become clear. 4.3 Geoheritage and conservation
This work adds to the growing body of knowledge about the history of the iconic Puy de Dôme, contribut-ing to the understandcontribut-ing of an important part of the Chaîne des Puys - Limagne Fault World Heritage site. The work also supplies information that can be inte-grated into the conservation strategy for the site, espe-cially identifying key outcrops, key natural areas and locations of high geoheritage value. These can be in-tegrated into a detailed geosite inventory, which is as yet to be created for the site, but without which it can not be properly protected [van Wyk de Vries and Vereb 2019].
The geomorphological mapping helps identify how the dome evolved during and after eruption, especially the erosional processes that accompanied and followed tilting and which are ongoing at present (slope creep, landslides, rock fall, debris flows). The mapping helps underline that the Puy de Dôme remains an actively-evolving landscape feature. The areas of the dome where these active natural surfaces processes are little or unaffected by anthropic activity have become better known. This increases the potential to protect these by providing vital information to indicate to authorities where human intervention should be avoided. It also gives scientists experience of the site that can be used to advise on the management of anthropic installations (e.g. cog train and paths), so that they can have the least effect on the natural environment.
This improved knowledge is not yet fully formalised and integrated into the conservation strategies for the Puy de Dôme, exposing it to a risk of damage to its out-standing geoheritage.
We are presently urgently talking to and working with the World Heritage site managers to rapidly inte-grate the new information, and to formalise a detailed inventory, since development projects, such as slope
stabilisation are already planned to start (14 October 2019) that have not yet benefited from any in-depth geoheritage constraint.
Conclusions
Geomorphological mapping has showed that the Puy de Dôme is asymmetric and steeper to the south-west than the north-east. Paleomagnetic data are consis-tent with a modest tilt of the dome on a north-west axis. The tilt is best explained by the 200 meters of uplift produced on the north-east side by the Petit Puy de Dôme bulge. The low dispersion of the paleomag-netic data from the Puy de Dôme also suggests that the dome cooled essentially en-masse without
signifi-cant post eruption flow.
Whole scale tilting of volcanic edifices by intrusions may have occurred at other volcanoes in the Chaîne des Puys and elsewhere. At larger scales this could affect the stability of large stratovolcanoes.
Precursory activity, in terms of doming and faulting at the base of the edifice could provide timely warning of the way intrusions are developing. Such activity is especially likely to occur at previously dormant volca-noes that have consolidated their conduits. Deforma-tion on one side might cause landslides on the other side, where they might not be expected. Hazard assess-ment should take this into account in the event of an intrusion being detected, as the opposite side from the most obvious danger may be at risk.
The tell-tale signs should be seen in tilting of the edi-fice away from a peripheral uplift, displacing the whole volcano to one side. Fracturing and precursory sliding on the opposite side of a bulge could also be a precursor to greater instability.
Acknowledgements
This work was funded by New Mexico Highlands Uni-versity Faculty Research funds, National Geographic Grant #8887-11 awarded to Petronis and Lindline, Na-tional Science Foundation Grant #1423396 awarded to Petronis and Lindline, and National Science Founda-tion Grant DMR-1523611 (PREM) awarded to Tatiana Timofeeva.. A special thanks to Dr. Linda LaGrange for her support of faculty and student research at New Mexico Highlands University.
A very special thank you to F. van Wyk de Vries for editing the manuscript. Tatum Miko Herrero, Giachino Roberti, Delphine Sourisseau assisted with the field sampling. Thanks also to Didier Miallier and Pierre Boivin for comments. Permission of sampling came from the Grande Site du Puy de Dôme, the Conseil De-partmental du Puy de Dôme and the Train du Puy de Dôme as well as the commune of Ceyssat.
The final work has been carried out under the UN-ESCO Geosciences Project No 692 ‘Geoheritage for Geohazard Resilience’.
Author contributions
This work represents a large portion of Garza’s Mas-ter’s thesis research at New Mexico Highlands Univer-sity, supervised by Petronis and van Wyk de Vries. Both Petronis and van Wyk de Vries were primarily responsi-ble for the initial ideas and plans, and then writing the manuscript, drafting the figures, and data interpreta-tion. All authors worked to collect the data, and Garcia ran the palaeomagnetic analyses under supervision of Petronis.
Data availability
All data related to this project is available at
http://www.nmhugeology.com/, the paleomag-netic data can be found in the MagIC database (https://www2.earthref.org/MagIC), and all data sets may be requested from the first author (mspetro@nmhu.edu).
Copyright notice
© The Author(s) 2019. This article is distributed un-der the terms of theCreative Commons Attribution 4.0 International License, which permits unrestricted use, distribution, and reproduction in any medium, pro-vided you give appropriate credit to the original au-thor(s) and the source, provide a link to the Creative
Commons license, and indicate if changes were made.
A
Appendix 1
Anisotropy
of
Magnetic
Susceptibility
Methods and Results and Rock Magnetic
data
A.1 Analytical Methods
Anisotropy of magnetic susceptibility (AMS) measure-ments of a rock specimen yield an ellipsoid of mag-netic susceptibility (K) defined by the length and ori-entation of its three principal axes, K1 ≥ K2 ≥ K3,
which are the three eigenvectors of the susceptibility tensor [Tarling and Hrouda 1993]. The long axis of the magnetic susceptibility ellipsoid, K1, gives the
mag-netic lineation, while the short axis, K3, defines the
nor-mal to the magnetic foliation plane (K1–K2). The bulk
magnetic susceptibility (Km) is the arithmetic mean of
the principal axes K1, K2, and K3 [see Jelinek 1981;
Tarling and Hrouda 1993]. We measured the AMS of 332 specimens prepared from samples collected at 17 sites distributed throughout the study area. The AMS measurements were performed on an AGICO MFK1-A multi-function kappabridge operating at low alternat-ing field of 200 A/m at 976 Hz at the New Mexico High-lands University Paleomagnetic-Rock Magnetic labora-tory. The AMS results and the susceptibility parameters are summarized inTable A1.
The leaning Puy de Dôme Petronis et al., 2019
A.2 Anisotropy of Magnetic Susceptibility Results
Table A1 – Anisotropy of Magnetic Susceptibility Data from the Puy de Dôme
Site No N Km K1 K2 K3 K1 –K 2 L F Pj T Shape UTM W GS 84 10 − 3SI Easting Northing PDD1 24 24 9.81 184/08 092/15 302/76 032/14E 1.005 1.006 1.011 0.048 O 496894.9 5068463.8 PDD2 20 22 3.46 037/71 281/09 188/17 278/73N 1.006 1.106 1.127 0.882 O 496918.9 5067416.8 PDD3 13 13 1.59 243/73 060/17 101/01 191/89W 1.066 1.088 1.159 0.778 O 496959.5 5068514.9 PDD4 17 17 4.43 192/47 311/24 058/33 148/57W 1.005 1.055 1.067 0.816 O 496930.4 5068407.1 PDD5 24 25 4.47 005/31 193/59 097/04 187/86W 1.003 1.022 1.028 0.750 O 496841.9 5068443.7 PDD6 14 16 3.77 288/08 044/72 195/16 285/74N 1.020 1.043 1.065 0.357 O 496978.1 5068907.1 PDD7 17 17 3.30 202/14 297/18 076/67 166/23W 1.008 1.041 1.054 0.658 O 496854.2 5068508.9 PDD8 12 12 2.74 216/47 352/35 100/23 190/67W 1.011 1.002 1.014 -0.654 P 496853.4 5068555.9 PDD9 22 22 2.55 172/61 063/10 328/27 058/63S 1.009 1.135 1.164 0.870 O 497053.8 5068497.5 PDD10 20 20 3.59 075/49 342/03 250/41 340/49E 1.010 1.026 1.038 0.467 O 496799.9 5068479.2 PDD11 14 14 4.35 019/20 125/38 297/46 027/44E 1.004 1.023 1.029 0.677 O 497068.6 5068482.2 PDD12 15 19 0.52 351/58 221/02 130/32 220/58W 1.012 1.019 1.032 0.232 O 497175.6 5068478.4 PDD13 17 17 0.40 333/26 227/28 098/50 188/40W 1.012 1.014 1.027 0.089 O 496879.2 5068477.2 PDD14 16 16 6.97 070/45 193/29 303/31 033/59E 1.022 1.088 1.119 0.596 O 496930.9 5068920.6 PDD15 22 24 0.96 305/52 127/38 036/01 126/89S 1.007 1.008 1.015 0.052 O 497617.9 5068642.0 PDD16 21 21 0.24 274/58 094/33 004/00 094/90S 1.016 1.031 1.048 0.309 O 496968.1 5068920.0 PDD17 31 33 0.48 199/45 302/42 032/49 122/41S 1.016 1.105 1.134 0.725 O 497053.2 5068940.7
Figure A1: Anisotropy of Magnetic Susceptibility results for [A] PDD1; [B] PDD2; [C] PDD3; [D] PDD4; [E] PDD5; [F] PDD6; [G] PDD7; [H] PDD8; [I] PDD9.
The leaning Puy de Dôme Petronis et al., 2019
Figure A1: [cont.]: Anisotropy of Magnetic Susceptibility results for [J] PDD10; [K] PDD11; [L] PDD12; [M] PDD13; [N] PDD14; [O] PDD15; [P] PDD16; [Q] PDD17.
A.3 Rock Magnetic Results
A.3.1 Isothermal Remanent Magnetization Results
Figure A2: Isothermal Remanent Magnetization Results A.3.2 Low Temperature Remanence Experiments
Figure A3: Low Temperature Remanence Results A.3.3 Curie Point Estimates
Table A2: Curie Point Estimates
Site Low temperature Inflection point Hopkinson peak Ti-content
PDD - 1C - 558 499* 0.1360 PDD - 2D - 576* - 0.0110 PDD - 3F - 582* - 0.0005 PDD - 4B - 582* 386* 0.0005 PDD - 5K 289 584* - 0.0028 PDD - 6H - 494* - 0.1440 PDD - 7L - 491* - 0.1480 PDD - 8A - - 488* 0.1450 PDD - 9E - 588* - 0.0094 PDD - 10J - 574* - 0.0140
The leaning Puy de Dôme Petronis et al., 2019
Figure A4: Curie Point Estimate Heating-Cooling Diagrams for [A] PDD - 1C; [B] PDD - 2B; [C] PDD - 3F; [D] PDD - 4B; [E] PDD - 5K; [F] PDD - 6H; [G] PDD - 7L; [H] PDD - 8A; [I] PDD - 9E [J] PDD - 10J; [K] PDD - 11P; [L] PDD - 12G; [M] PDD - 13J.

![Figure 2: Topography and geology of the Puy de Dôme area. [A] Shaded relief image using the LiDAR data for Clermont-Ferrand (CRAIG dataset)](https://thumb-eu.123doks.com/thumbv2/123doknet/13722857.435580/5.892.74.819.101.832/figure-topography-geology-dôme-shaded-clermont-ferrand-dataset.webp)
![Figure 3: Maps of the Puy de Dôme. [A] Shaded relief map with transparent slope map overlay](https://thumb-eu.123doks.com/thumbv2/123doknet/13722857.435580/6.892.90.818.97.794/figure-maps-dôme-shaded-relief-transparent-slope-overlay.webp)

![Figure 8: Pictures taken from the Puy de Dôme, of its slopes. [A] Looking over the old road (now train track) from the southwest side up to the west side and sample points PDD3 and PDD5](https://thumb-eu.123doks.com/thumbv2/123doknet/13722857.435580/11.892.175.722.116.961/figure-pictures-dôme-slopes-looking-southwest-sample-points.webp)
![Figure 9: Pictures of the Puy de Dôme outcrops. [A] Fresh open fractures that are parallel to the magmatic foliation in the downslope-dipping breccia zone near sample site PDD5](https://thumb-eu.123doks.com/thumbv2/123doknet/13722857.435580/13.892.108.784.104.971/figure-pictures-outcrops-fractures-parallel-magmatic-foliation-downslope.webp)

![Figure 11: Orthogonal demagnetization diagrams representing the typical AF and TH demagnetization behavior [Zijderveld 1967]](https://thumb-eu.123doks.com/thumbv2/123doknet/13722857.435580/15.892.191.706.99.811/figure-orthogonal-demagnetization-diagrams-representing-demagnetization-behavior-zijderveld.webp)
