Aeroelastic Studies on a High Aspect Ratio Wing
by
Linda M. Mendenhall
B. S., Aeronautics and Astronautics B. S., Astronomy and Astrophysics,
The Pennsylvania State University, University Park, Pennsylvania (1997)
Submitted to the Department of Aeronautics and Astronautics in partial fulfillment of the requirements for the degree of
MASTER OF SCIENCE IN AERONAUTICS AND ASTRONAUTICS
at the
MASSACHUSETTS INSTITUTE OF TECHNOLOGY
February 2003
@ Massachusetts Institute of Technology 2003. All rights reserved.
Author
Department of Aeronautics and Astronautics January 31, 2003 Certified by
Carlos E. S. Cesnik Visiting Associate Professor of Aeronautics and Astronautics Thesis Supervisor
Accepted by /
Edward M. Greitzer H.N. Slater Professor of Aeronautics and Astronautics Chair, Committee on Graduate Students
MASSACHUSETTS INSTITUTE
Aeroelastic Studies on a High Aspect Ratio Wing
by
Linda M. Mendenhall
Submitted to the Department of Aeronautics and Astronautics on January 31, 2003, in partial fulfillment of the
requirements for the degree of
Master of Science in Aeronautics and Astronautics
Abstract
A high aspect ratio (10.56) composite wing was designed and fabricated in order to verify
a new analysis code developed to predict dynamic behavior of high-aspect-ratio wings. The chosen wing design was manufactured and tested (both bench-top and wind tunnel testing), and its dynamic behavior was characterized. Strain gauges and accelerometers were embed-ded within the wing at various distances along the span to record wing natural frequency information during bench-top 'tap' testing, and frequency changes as a function of wind speed and root angle of attack during wind tunnel testing. Bench-top natural frequencies
and mode shapes for the 1St and 2 nd Bending, 1st Chordwise Bending, and 1st Torsion modes are in good agreement with the analytical model. Mode shapes with frequencies exceeding 100 Hz were not considered. Within the tunnel, the wing was studies at 10, 20, and 50 root angles of attack. The 2' root angle of attack configuration was flown to the flutter point by observing of the wing behavior. This was within 99% of the predicted flutter speed.
Thesis Supervisor: Carlos E. S. Cesnik
Acknowledgments
The completion of this research required the assistance of many people and institutions. I
would first like to thank MIT Lincoln Laboratory for allowing me to go back to school to further my education. In particular, the Lincoln Scholars Commitee for the financial support
and time away from work necessary to complete such an endevor. Also my Group leaders, Bob Davis and Steve Forman, who were extremely understanding about my absence. A
special thank-you to my Lincoln Tor-mentor (I mean Mentor), John Sultana, who always provided something to laugh about! Also, thanks to all the people in my group and through
out the laboratory who have helped, especially Dennis Burianek, Vinny Cerrati, Charlie Nickerson, and Anne Vogel.
A giant thank you goes to my family for putting up with the neglect and all of my
moodiness. Especially my husband, Dr Jeffrey Mendenhall, who took over all the household and farm duties and still found time to pick me up at the train station. Special thanks to
Rajah, Angie, Jack, Ian, Betty, and Sierra, for providing the devotion and unconditional love
that every graduate student needs. To my parents, Charles and Marion Baker, for instilling in me the importance of education. Thanks to all my friends who allowed me to drop out of
existance for awhile!
I would also like to thank many people on MIT campus, who provided necessary assitance
along the way. John Kane, Dave Roberts, and Donald Weiner for providing invaluable assistance during the manufacturing process. Also Dick Perdichizzi for his assistance in the
tunnel. A special thanks to Professor John Dugundji for taking such an interest in my work and helping me through all of the difficult times. Thanks also to my advisor, Carlos Cesnik, for providing me with such an interesting topic.
Partial funding for this work was provided by NASA Langley Research Center, under
grant NAG-1-01102, and monitored by Dr. W. Keats Wilkie. Such support does not
consti-tute an endorsement by NASA of the views expressed herein.
F19628-00-C-" I know where the pieces fit F19628-00-C-"
Contents
Abstract Acknowledgments 1 Introduction 1.1 M otivation . . . . 1.2 O bjective . . . . 1.3 Background . . . . 1.3.1 Previous Work . . . . 1.3.2 Present Work . . . . 2 Design and Analysis of High Aspect Ratio Wing2.1 Design Criteria . . . . 2.2 Two-Layer Design . . . .
2.2.1 Basic Characteristics . . . . 2.2.2 Wing Non-linear Characteristics . . . .
2.3 Three-Layer Design . . . . 2.3.1 Basic Characteristics . . . .
2.3.2 Wing Nonlinear Characteristics . . . . 2.4 Nastran Comparison . . . .
2.4.1 Case 1 - Maximum Vertical Displacement . . . . .
2.4.2 Case 2 - Maximum Pitch Rotation . . . .
2 3 19 19 19 20 20 21 22 22 23 23 26 51 51 52 78 80 80
3 Experimental Procedure 3.1 Wing Manufacture ... 3.1.1 Foam Core ... 3.1.2 Instrumentation ... 3.1.3 Lay-Up . . . . 3.1.4 Post Cure . . . . 3.1.5 Clamp . . . .
3.2 Data Acquisition Equipment 3.3 Wind Tunnel Load Cell . . . 4 Experimental Studies
4.1 Bench-top Tests . . . .
4.1.1 Strain Gauge Calibration . . . . 4.1.2 Tap Tests for Dynamic Properties . . .
4.1.3 Shaker Tests for Dynamic Properties .
4.2 Re-work of Analytical Model . . . .
4.3 Wind Tunnel Tests . . . .
4.3.1 Wing Calibration in the Wind Tunnel.
4.3.2 Wind Tunnel Tests . . . .
5 Concluding Remarks
5.1 Summary . . . .
5.2 Conclusions . . . . 5.3 Recommendations for Future Work . . . . A Mathematical Formulation
A.1 Introduction ... A.2 Geometrical Lay-out ...
A.3 Structural Formulation . . . .
A.4 Aerodynamic Formulation . . . . .
A.5 Aeroelastic Formulation . . . .
88 . . . . 88 . . . . 88 . . . . 89 . . . . 93 . . . . 94 . . . . 94 . . . . 97 . . . . 97 99 99 99 104 108 109 136 136 146 180 180 181 181 185 185 185 186 187 188 . . . . . . . . . . . . . . . . . . . .
B Material Properties 190
C Active Wing Design 192
C .1 A ctive D esign . . . 192 C.1.1 Basic Static and Dynamic Properties ... 193 C.1.2 Wing Non-linear Characteristics ... 195
List of Figures
2-1 Cross section of two-layer wing (NACA 0012) . . . . 23
2-2 First six normal modes for two-layer wing (in vacuum) . . . . 25
2-3 Static tip deflection for increasing speed at different root angles of attack . . 26
2-4 Elastic tip twist for increasing speed at different root angles of attack . . . . 27
2-5 Frequency change due to root angle of attack change at U = 30 m/s . . . . . 28
2-6 Frequency change due to change in speed for 20 root angle of attack . . . . . 30
2-7 Frequency change due to change in speed for 50 root angle of attack . . . . . 31
2-8 Flutter speeds for two-layer design . . . . 32
2-9 Root locus plot for 0' root angle of attack . . . . 33
2-10 Mode shapes for two-layer design at 0' root angle of attack and its corre-sponding flutter speed of 55.8 m/s . . . . 34
2-11 Root locus plot for 10 root angle of attack . . . . 35
2-12 Magnification of root locus plot for 1 root angle of attack . . . . 36
2-13 Mode shapes for two-layer design at 10 root angle of attack and its corre-sponding flutter speed of 50.2 m/s . . . . 37
2-14 Nonlinear time simulation of the wing vertical tip displacement at 10% above its flutter speed (10 root angle of attack) for the two-layer design . . . . 38
2-15 Nonlinear time simulation of the wing tip twist at 10% above its flutter speed (10 root angle of attack) for the two-layer design . . . . 39
2-16 Nonlinear time simulation of the wing tip displacement motion at 10% above its flutter speed (1 root angle of attack) for the two-layer design . . . . 39
2-17 Maximum ply strain reached at 10% above flutter speed of 10 root angle of
attack for the two-layer design . . . . 40
2-18 Root locus plot for 20 root angle of attack . . . . 41
2-19 Mode shapes for two-layer design at 2' root angle of attack and at its
corre-sponding flutter speed of 47.5 m/s . . . . 42 2-20 Nonlinear time simulation of the wing vertical tip displacement at 10% above
its flutter speed (2' root angle of attack) for the two-layer design . . . . 43 2-21 Nonlinear time simulation of the wing tip twist at 10% above its flutter speed
(2' root angle of attack) for the two-layer design . . . . 44
2-22 Nonlinear time simulation of the wing tip motion at 10% above its flutter speed (2' root angle of attack) for the two-layer design . . . . 44
2-23 Maximum ply strain reached at 10% above flutter speed of 20 root angle of
attack for the two-layer design . . . . 45 2-24 Root locus plot for 5' root angle of attack . . . . 46
2-25 Mode shapes for two-layer design at 50 root angle of attack and at its
corre-sponding flutter speed of 38.8 m/s . . . . 47
2-26 Nonlinear time simulation of the wing vertical tip displacement at 10% above
its flutter speed (50 root angle of attack) for the two-layer design . . . . 48
2-27 Nonlinear time simulation of the wing tip twist at 10% above its flutter speed (50 root angle of attack) for the two-layer design . . . . 49
2-28 Nonlinear time simulation of the wing tip motion at 10% above its flutter
speed (50 root angle of attack) for the two-layer design . . . . 49
2-29 Maximum ply strain at reached at 10% above flutter speed of 50 root angle of
attack for the two-layer design . . . . 50 2-30 Cross section of three-layer wing (NACA 0012) . . . . 51 2-31 First six modes shapes for the three-layer wing (in vacuum) . . . . 53 2-32 Static tip deflection for increasing speed at different root angles of attack . . 54
2-36 Frequency change due to change in speed for 50 root angle of attack . . . . . 59 2-37 Flutter speeds for three-layer design . . . . 60 2-38 Root locus plot for 0' root angle of attack . . . . 61 2-39 Mode shapes for three-layer design at 00 root angle of attack and at its
corre-sponding flutter speed 64.6 m/s . . . . 62
2-40 Root locus plot for 10 root angle of attack . . . . 63
2-41 Mode shapes for three-layer design at 10 root angle of attack and at its corre-sponding flutter speed of 62.1 m/s . . . . 64 2-42 Nonlinear time simulation of the wing vertical tip displacement at 10% above
its flutter speed (10 root angle of attack) for the three-layer design . . . . 65
2-43 Nonlinear time simulation of the wing tip twist at 10% above its flutter speed
(10 root angle of attack) for the three-layer design . . . . 66
2-44 Nonlinear time simulation of the wing tip motion at 10% above its flutter speed (10 root angle of attack) for the three-layer design . . . . 66
2-45 Maximum ply strain reached at 10% above flutter speed of 10 root angle of attack for the three-layer design . . . . 67
2-46 Root locus plot for 20 root angle of attack . . . . 68
2-47 Mode shapes for three-layer design at 20 root angle of attack and at its corre-sponding flutter speed of 56.9 m/s . . . . 69
2-48 Nonlinear time simulation of the wing vertical tip displacement at 10% above its flutter speed (20 root angle of attack) for the three-layer design . . . . 70
2-49 Nonlinear time simulation of the wing tip twist at 10% above its flutter speed
(20 root angle of attack) for the three-layer design . . . . 71 2-50 Nonlinear time simulation of the wing tip motion at 10% above its flutter
speed (20 root angle of attack) for the three-layer design . . . . 71 2-51 Maximum ply strain reached at 10% above flutter speed of 20 root angle of
attack for the three-layer design . . . . 72 2-52 Root locus plot for 50 root angle of attack . . . . 73 2-53 Mode shapes for three-layer design at 5' root angle of attack and at its
2-54 Nonlinear time simulation of the wing vertical tip displacement at 10% above
its flutter speed (50 root angle of attack) for the three-layer design . . . . 75
2-55 Nonlinear time simulation of the wing tip twist at 10% above its flutter speed (50 root angle of attack) for the three-layer design . . . . 76
2-56 Nonlinear time simulation of the wing tip motion at 10% above its flutter speed (50 root angle of attack) for the three-layer design . . . . 76
2-57 Maximum ply strain reached at 10% above flutter speed of 50 root angle of attack ... .. ... 77
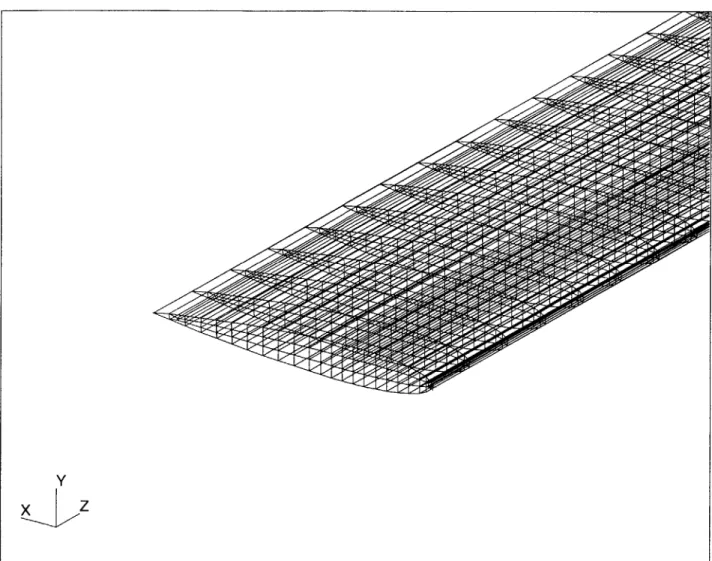
2-58 Finite element mesh of the three-layer design used in Nastran (5550 elements, 13617 degrees of freedom) . . . . 79
2-59 Nastran normal (chordwise) strain for 5' root angle of attack . . . . 81
2-60 Nastran normal (spanwise) strain for 5' root angle of attack . . . . 82
2-61 Nastran in-plane shear strain for 5' root angle of attack . . . . 83
2-62 Nastran normal (chordwise) strain for 5' root angle of attack . . . . 85
2-63 Nastran normal (spanwise) strain for 5' root angle of attack . . . . 86
2-64 Nastran in-plane shear strain for 50 root angle of attack . . . . 87
3-1 Four sections of the foam core pieced together in mold . . . . 89
3-2 Location of Sensors . . . . 90
3-3 General wiring diagram for Wheatstone bridges . . . . 91
3-4 Wiring diagram for Wheatstone bridges in bending . . . . 91
3-5 Wiring diagram for Wheatstone bridges in forward/aft bending . . . . 91
3-6 Wiring diagram for Wheatstone bridges in twist . . . . 91
3-7 Strain gauge at mid-span . . . . 92
3-8 Strain gauges wired at the root . . . . 92
3-9 Top of root clam p . . . . 95
3-10 Bottom of root clamp . . . . 96
3-11 Pin diagram for full bridges . . . . 97
4-2 Experimental instrumentation for bench-top tests . . . . 100
4-3 Time trace of data from bench-top bending calibration . . . . 101
4-4 Calibration of strain gauge voltage output for bending . . . . 102
4-5 Time trace of data from bench-top twist calibration . . . 103
4-6 Calibration of strain gauge voltage output for tip twist . . . . 104
4-7 Tap test for bending frequencies-root bending gauge . . . 105
4-8 Tap test for torsion frequencies-root torsion gauge . . . 106
4-9 Tap test for chordwise bending frequencies-forward/aft gauge . . . 107
4-10 Shaker at the wing leading edge for the natural frequency bench test . . . . 108
4-11 Fundamental mode shapes with adjusted weight and length . . . 110
4-12 Predicted fundamental mode shapes based on added stiffness corrections . . 112
4-13 Root locus plot for 10 root angle of attack based on modified wing stiffness properties . . . 113
4-14 Magnified root locus plot for 10 root angle of attack based on modified wing stiffness properties . . . 114
4-15 Root locus plot for 2' root angle of attack based on modified wing stiffness properties . . . 115
4-16 Magnified root locus plot for 20 root angle of attack based on modified wing stiffness properties . . . 116
4-17 Root locus plot for 50 root angle of attack based on modified wing stiffness properties . . . 117
4-18 Predicted flutter speeds for various root angles of attack based on modified wing stiffness properties . . . 118
4-19 Predicted mode shapes after final modifications of different wing properties . 120 4-20 Root locus plot for 00 root angle of attack based on final modifications of different wing properties . . . 121
4-21 Magnified root locus plot for 00 root angle of attack based on final modifica-tions of different wing properties . . . 122
4-22 V-g (frequency part) for 0' root angle of attack based on final modifications of different wing properties . . . 123
4-23 V-g (damping part) for 00 root angle of attack based on final modifications of
different wing properties . . . 124
4-24 Root locus plot for 10 root angle of attack based on final modifications of different wing properties . . . 125
4-25 Magnified root locus plot for 10 root angle of attack based on final modifica-tions of different wing properties . . . 126
4-26 V-g (frequency part) for 10 root angle of attack based on final modifications of different wing properties . . . . 127
4-27 V-g (damping part) for 10 root angle of attack based on final modifications of different wing properties . . . . 128
4-28 Root locus plot for 20 root angle of attack based on final modifications of different wing properties . . . . 129
4-29 Magnified root locus plot for 2' root angle of attack based on final modifica-tions of different wing properties . . . . 130
4-30 V-g plot (frequency part) for 20 root angle of attack based on final modifica-tions of different wing properties . . . . 131
4-31 V-g plot (damping part) for 20 root angle of Attack based on final modifica-tions of different wing properties . . . . 132
4-32 Root locus plot for 50 root angle of attack based on final modifications of different wing properties . . . . 133
4-33 V-g (frequency part) for 50 root angle of attack based on final modifications of different wing properties . . . . 134
4-34 V-g (damping part) for 50 root angle of attack based on final modifications of different wing properties . . . . 135
4-35 Predicted flutter speed for various root angles of attack . . . . 137
4-36 Wing set-up in the Wright Brothers wind tunnel . . . . 138
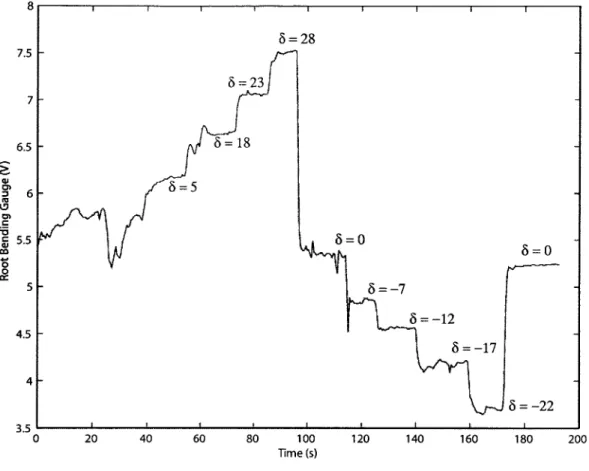
4-37 Set-up for hanging weights to calibrate strain gauges . . . . 139
4-41 Calibration of root bending gauge from both 50% and 90% chord load cases 143
4-42 Calibration of root torsion gauge from both 50% and 90% chord load cases 144 4-43 Calibration of other bending gauge (located at 35% span) from both 50% and
90% chord load cases . . . . 145
4-44 Other bending gauge readings from undisturbed wing mounted in tunnel . . 147
4-45 Root bending gauge readings from tap test-wing mounted in tunnel . . . . 148
4-46 Root torsion gauge readings from tap test-wing mounted in tunnel . . . 149 4-47 Forward/Aft bending gauge readings from tap test-wing mounted in tunnel 150 4-48 Lift curve for wing . . . 151
4-49 Frequency plot from root bending gauge at 20.1 m/s for 10 root angle of attack152 4-50 Frequency plot from root torsion gauge at 20.1 m/s for 10 root angle of attack 153
4-51 Frequency plot from forward/aft gauge at 20.1 m/s for 10 root angle of attack 154 4-52 Frequency plot from the other bending gauge at 20.1 m/s for 10 root angle of
attack ... ... 155
4-53 Frequency plot from root bending gauge at 36.7 m/s for 10 root angle of attack156
4-54 Frequency plot from root torsion gauge at 36.7 m/s for 1' root angle of attack 157
4-55 Frequency plot from forward/aft gauge at 36.7 m/s for 10 root angle of attack 158 4-56 Frequency plot from the other bending gauge at 36.7 m/s for 10 root angle of
attack . . .. ... ... ... 159
4-57 Time trace of data from root bending gauge at 20.1 m/s for 2' root angle of
attack ... ... 160
4-58 Frequency plot from root bending gauge at 20.1 m/s for 20 root angle of attack161 4-59 Frequency plot from root torsion gauge at 20.1 m/s for 20 root angle of attack 162 4-60 Frequency plot from forward/aft gauge at 20.1 m/s for 2' root angle of attack 163
4-61 Frequency plot from the other bending gauge at 20.1 m/s for 20 root angle of
attack . . ... ... .. ... ... .164
4-62 Time trace of data from root torsion gauge at 52.3 m/s for 2' root angle of
attack . . . ... ... ... ... 166
4-63 Time trace of data from root torsion gauge at 52.3 m/s for 20 root angle of
4-64 Frequency plot from root torsion gauge at 52.3 m/s for 20 root angle of attack 168
4-65 Frequency plot from forward/aft gauge at 52.3 m/s for 2' root angle of attack 169 4-66 Frequency plot from the other bending gauge at 52.3 m/s for 2' root angle of
attack ... ... 170
4-67 Frequency plot from root torsion gauge at 20.1 m/s for 50 root angle of attack 171 4-68 Frequency plot from forward/aft gauge at 20.1 m/s for 5' root angle of attack 172 4-69 Frequency plot from the other bending gauge at 20.1 m/s for 5' root angle of attack ... .... ... ... 173
4-70 Frequency plot from root torsion gauge at 33.5 m/s for 5' root angle of attack 174 4-71 Frequency plot from forward/aft gauge at 33.5 m/s for 5' root angle of attack 175 4-72 Frequency plot from the other bending gauge at 33.5 m/s for 5' root angle of attack .. ... ... ... 176
4-73 Root bending gauge readings from tap test-wing mounted in tunnel . . . . 177
4-74 Root torsion gauge readings from tap test-wing mounted in tunnel . . . . . 178
4-75 Average tip accelerometer readings from tap test-wing mounted in tunnel . 179 A-i Coordinate systems for the wing . . . . 186
A-2 Variables Defining Airfoil Motion . . . . 188
C-1 Cross section of active wing . . . . 192
C-2 First six normal modes for active wing design (in vacuum) . . . . 194
C-3 Static tip deflection for increasing speed at different root angles of attack . . 195
C-4 Elastic tip twist for increasing speed at different root angles of attack . . . . 196
C-5 Flutter speeds for active wing design . . . . 197
C-6 Root locus plot for 10 root angle of attack . . . . 198
C-7 Magnification of root locus plot for 10 root angle of attack . . . . 199
C-8 Mode Shapes for active wing design at 10 root angle of attack and its corre-sponding flutter speed of 79.3 m/s . . . 200
C-9 Nonlinear time simulation of the wing vertical tip displacement at 10% above its flutter speed (1 root angle of attack) for the active wing design . . . 201
C-10 Nonlinear time simulation of the wing tip twist at 10% above its flutter speed (10 root angle of attack) for the active wing design . . . 202 C-11 Nonlinear time simulation of the wing tip displacement motion at 10% above
its flutter speed (1' root angle of attack) for the active wing design . . . 202
C-12 Root locus plot for 20 root angle of attack . . . 203 C-13 Magnification of root locus plot for 2' root angle of attack . . . 204
C-14 Mode shapes for active wing design at 2' root angle of attack and its corre-sponding flutter speed of 77.3 m/s . . . 205
C-15 Nonlinear time simulation of the wing vertical tip displacement at 10% above
its flutter speed (2' root angle of attack) for the active wing design . . . 206
C-16 Nonlinear time simulation of the wing tip twist at 10% above its flutter speed
(20 root angle of attack) for the active wing design . . . 207
C-17 Nonlinear time simulation of the wing tip displacement motion at 10% above
its flutter speed (20 root angle of attack) for the active wing design . . . 207
C-18 Root locus plot for 5' root angle of attack . . . 208 C-19 Mode shapes for active wing design at 50 root angle of attack and its
corre-sponding flutter speed of 68 m/s . . . 209
C-20 Nonlinear time simulation of the wing vertical tip displacement at 10% above
its flutter speed (50 root angle of attack) for the active wing design . . . 210
C-21 Nonlinear time simulation of the wing tip twist at 10% above its flutter speed (50 root angle of attack) for the active wing design . . . 211 C-22 Nonlinear time simulation of the wing tip displacement motion at 10% above
List of Tables
2.1 Non-zero stiffness matrix terms for two-layer design . . . . 24
2.2 Non-zero inertial matrix terms for two-layer design . . . . 24
2.3 Natural frequencies of the two-layer design in vacuum . . . . 24
2.4 Dynamic properties at U = 30 m/s . . . . 29
2.5 Dynamic properties at angle of attack = 2 . . . .. 29
2.6 Dynamic properties at angle of attack = 5 . . . . . 32
2.7 Non-zero stiffness matrix terms for three-layer design . . . . 51
2.8 Non-zero inertial matrix terms for two-layer design . . . . 51
2.9 Natural frequencies of the three-layer design in vacuum . . . . 52
2.10 Dynamic properties at U = 30 m/s . . . . 56
2.11 Dynamic properties at root angle of attack = 20 . . . . 56
2.12 Dynamic properties at root angle of attack = 50 . . . . 60
2.13 Summary of Strain Analysis Results . . . . 78
2.14 Nastran Case 1: Displacements and Rotations . . . . 80
2.15 Nastran case 1: summary of results . . . . 80
2.16 Nastran case 2: displacements and rotations . . . . 81
2.17 Nastran case 2: summary of results . . . . 84
3.1 Accelerometers used in the wing model . . . . 93
3.2 Load cell used for the wing tunnel tests . . . . 98
4.3 Intermediate predicted natural frequencies based on added stiffness corrections 111
4.4 Intermediate predicted flutter speeds based on corrected structural properties 111
4.5 Final values of adjusted parameters . . . . 119
4.6 Final natural frequencies from wing analysis . . . . 120
4.7 Predicted flutter speeds with final model adjustments . . . 136
4.8 Frequencies detected from strain gauges at 20.1 m/s for 2' root angle of attack165 B.1 Properties of the materials used in this study . . . . 191
C. 1 Non-zero stiffness matrix terms for the active wing design . . . . 193
C.2 Non-zero inertial matrix terms for active wing design . . . . 193
Chapter 1
Introduction
1.1
Motivation
Many industries consider using High Altitude Long Endurance (HALE) aircraft to perform autonomous sensing (environmental, urban, and reconnaissance), or to assist in civilian or military communication as a relay [1]. The wings of these vehicles are typically of high
aspect ratio. Long slender wings result in large deflections during flight, especially when flown at high angles of attack. These large deflections cannot be ignored when analyzing the
wing's flight characteristics. The change in the wing's stiffness, due to nonlinear geometric behavior, requires new methods of modeling [2]. This change in stiffness results in changes to
the wing's dynamic behavior. There has been considerable research in this area by numerous
groups, resulting in new modeling techniques and codes which need to be validated through experimentation. One such computational modeling tool is being developed by Cesnik and
Brown [3]. This research is a follow-on of work performed by Cesnik and Ortega-Morales [4]. The ground work for this was set forth by Patil, Hodges, and Cesnik [1], [5], and [6].
1.2
Objective
data will then support the validation of the MATLAB computer code being developed by
Cesnik and Brown [3]. Originally this would encompass all portions of the code, including the ability to model active materials embedded within the layers of the composite wing.
However, due to reasons beyond the control of the author, no active structural tests are included in this study.
1.3
Background
As mentioned above, there has been substantial effort towards developing analytical models which accurately depict the behavior of high aspect ratio wings undergoing large deflections. This work is summarized in the next two sections.
1.3.1
Previous Work
In the late 1980s, Minguet and Dugundji studied the effects of deflection on dynamic behavior
of thin composite strips [7]. In their study, it was shown that deflection has significant effect on the torsion and chordwise bending frequencies. Their beam analysis obtained a set of
linearized equations about a deflected position. The experiments for this research utilized
flat composite beams of various composite orientations and thicknesses. This study showed that deflections of as little as 3% of the total length affected the torsional and chordwise
bending modes, while the normal bending modes remained relatively uneffected. They also showed that tip bending deflections between 5% and 10% of the total beam length resulted
in a mix between the 1st torsion and 1"t chordwise bending modes.
Patil, Hodges and Cesnik [8] have worked to improve modeling capabilities for high
aspect ratio wings, which include geometrical non-linearities for structural and aerodynamic analyses. Their research has shown that accurate modeling of geometric non-linearities is
necessary to fully understand the torsion/bending coupling observed during flutter of wings
with large deflections [8]. Their modeling of nonlinear aeroelasticity is based on a mixed variational formulation for the dynamics of beams in moving reference frames and
Tang and Dowell have studied various ways of modeling high aspect ratio wing aeroelastic behavior and correlated their work with wind tunnel tests. In the late 1990's, they built a 45-cm wing with an aspect ratio of 8.89
[9).
The wing was flown into the flutter domain to study limit cycle oscillation behavior. They also used this wing to study the modeling ofgust response [10].
Ortega-Morales and Cesnik created a framework for implementing active aeroelastic
tai-loring of high aspect ratio wings, as well as gust mitigation [4]. The active taitai-loring was
im-plemented through embedded piezoelectric actuators within the composite skin of the wing. This work implemented many of the analysis techniques studied in
[1], [8], [2],
[5],
and[6],
and consisted of an asymptotically correct active cross-section formulation, geometrically-exact mixed formulation for dynamics of moving beams, and finite-state unsteady aerodynamics.1.3.2
Present Work
Cesnik and Brown are continuing the work done in [4]. This work formulated the MATLAB
code used within this thesis, which employs a strain-based finite element representation of a nonlinear, large deflection beam model experiencing finite-state unsteady airloads [11]. This program has the capability to model active materials embedded within the composite lay-up of the wing and to take into account effects from the fuselage and tail [3]. The basic
formulation behind this modeling effort is summarized in Appendix A.
Two different wing designs were generated using the code from [11] and are presented in Chapter 2 of this thesis. These designs were chosen for their torsional flexibility and
interesting flutter characteristics. Chapter 3 discusses the manufacture and instrumentation of the wing. The benchtop and wind tunnel experiments, as well as the experimental results
are discussed in Chapter 4. Along with these results is a modified numerical model which replicates the results of the tests. Finally, conclusions and suggestions for further work
are presented in Chapter 5. This thesis contains three Appendices. Appendix A provides a summary of the mathematical formulation for the code, Appendix B contains relevant material properties, and Appendix C provides the preliminary studies for a future active
Chapter 2
Design and Analysis of High Aspect
Ratio Wing
This chapter describes the design and analysis of the static flexible wing that was built to validate the model of [3] for subsonic speeds. Some of the design parameters were set by the wind tunnel limitations and others by ease of fabrication.
2.1
Design Criteria
Since this study targets large deflection aeroelastic response, a high aspect ratio flexible wing was needed. To reduce the risk of damage to the wind tunnel during the dynamic portion of testing, the design flutter speed for this wing should be in the range of 40 m/s. This relatively low flutter speed reduces the amount of momentum the wing would have in case it becomes unstable and brakes away from the mounting fixture. As a result, a very flexible wing design, soft in torsion, is expected. Although the wing needed to be as long as possible to increase the aspect ratio, the span of the wing was also limited by the wind tunnel test section dimension. The minimum chord of the wing also has limitations. It could not be too small, as that would significantly increase the complexity of manufacturing. With these constraints in mind, the length of the wing was set to 1.13 meters (44.5 inches) and the chord length was set to 0.107 meters (4.22 inches). This yielded an aspect ratio of 10.56.
The airfoil shape chosen is the NACA 0012. Safety to the wing tunnel was a major concern, so the wing needed to possess margins of safety for strain within the E-glass/epoxy of at least
1. For added safety this requirement needed to be met when the wing was analyzed at 10%
above the predicted flutter speed. Also, the wing needed to exhibit limit cycle oscillation at
speeds up to 10% above the predicted flutter values.
After several preliminary layup considerations, two basics ones were selected for detailed studies: a so-called "two-layer" design and a "three-layer" design. They represent flexible designs, with flutter speeds within the appropriate range. They also demonstrate interesting flutter characteristics.
2.2
Two-Layer Design
2.2.1
Basic Characteristics
The two-layer design is composed of two-layers of E-glass/epoxy fabric oriented at 0' around an inner foam core. A table of the material properties is provided in Appendix B. There is no spar in this design. This design provides a very flexible wing while still maintaining closed cell properties. A cross-sectional representation is given in Figure 2-1.
[021
foam
Figure 2-1: Cross section of two-layer wing (NACA 0012)
The cross-sectional properties for the two-layer design are provided below. The stiffness matrix terms for this cross-section are given in Table 2.1. Detailed definition of the elements of this matrix are provided in Appendix A. The inertia matrix for this cross-section is provided in Table 2.2. The center of gravity for the cross-section is located 0.0182 m aft of the reference line (located at 30% chord). This places the center of gravity at 47% of the
Table 2.1: Non-zero stiffness matrix terms for two-layer design: 1 = Extension, 2 = Torsion, 3 = Flatwise Bending, 4 = Chordwise Bending
Kn1 9.55 * 105 N K14= K4 1 -1.68 * 104 N*m K2 2 14.24 N*m 2 K3 3 22.25 N*m 2 K4 4 1.18 * 10 3 N*m 2
Table 2.2: Non-zero inertial matrix terms for two-layer design
I, 0.10 * 10-3 m4 I22 0.22 * 10-5 m4 133 0.98 * 10-4 m4
The dynamic properties of the wing are important to its aeroelastic response. The first six natural frequencies of the wing are summarized in Table 2.3. The corresponding mode
shapes are provided in Figure 2-2.
Table 2.3: Natural frequencies of the two-layer design in vacuum
Mode Frequency Mode Shape
1 8 Hz 1st Bending 2 50 Hz 1st Chordwise Bending 3 52 Hz 2"d Bending 4 95 Hz 1" Torsion 5 153 Hz 3 rd Bending 6 292 Hz 2 nd Torsion
Speed = 0.00 m/s @ Freq = 7.97 Hz 0.8 Speed = 0.00 m/s @ Freq = 51.5 Hz Speed = 0.00 m/s @ Freq = 95.1 Hz 0.2 0.8 Speed = 0.00 m/s @ Freq = 153 Hz 0.6 0.4 Speed = 0.00 m/s @ Freq = 292 Hz 0.2 0.4 0.6 1 0.2 0.4 0.8
Figure 2-2: First six normal modes for two-layer wing (in vacuum) -0.1 -0.05 0 0.8 0.6 Speed = 0.00 m/s @ Freq = 49.9 Hz 0.1 1
2.2.2
Wing Non-linear Characteristics
Different root angles of attack of the wing result in different wing tip deflections once the wing is exposed to airloads. The change in tip deflection is graphed in Figure 2-3 for the
range of angles of attack of interest: 0' to 5'. The tip deflection increases with increased angle of attack. This is to be expected, since the aerodynamic load is directly proportional to the angle of attack.
0.6 0.5 0.4 0.3 0.2 0*0 -0.11 0 5 10 15 20 25 30 35 40 45 50 Speed (m/s)
Figure 2-3: Static tip deflection for increasing speed at different root angles of attack
The wing tip twist also changes with increased root angle of attack. This data is provided in Figure 2-4. To better illustrate this effect, the initial root angle of attack has been
subtracted from the total tip twist, yielding only the elastic angle change due to gravitational
E 0 a a) 0 ca.
and aero-loading. 0.9 0.8 0 .7 -.-.-. -A O 0 . . . ... . . . . . . . . . . . . . . . . . . . . . . . . . . ... . . . . . . . 0.63 0 5-0 5-0 5 30-5 40 45 5 F 0 .4 -. -. -. -. . . .. .. . .. . . . . . .. . .-.-0.13 -0 01
Speed (mis)
Figure 2-4: Elastic tip twist for increasing speed at different root angles of attack
The changes in tip deflection and twist result in a change in the dynamic behavior of
the wing, and ultimately a change in the wing stability. This is illustrated by the change in the mode shapes and their corresponding frequencies for the wing at different root angles of
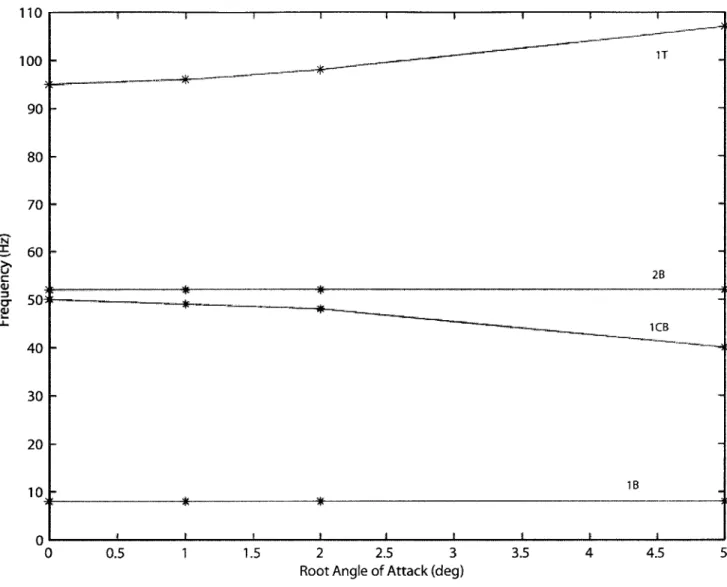
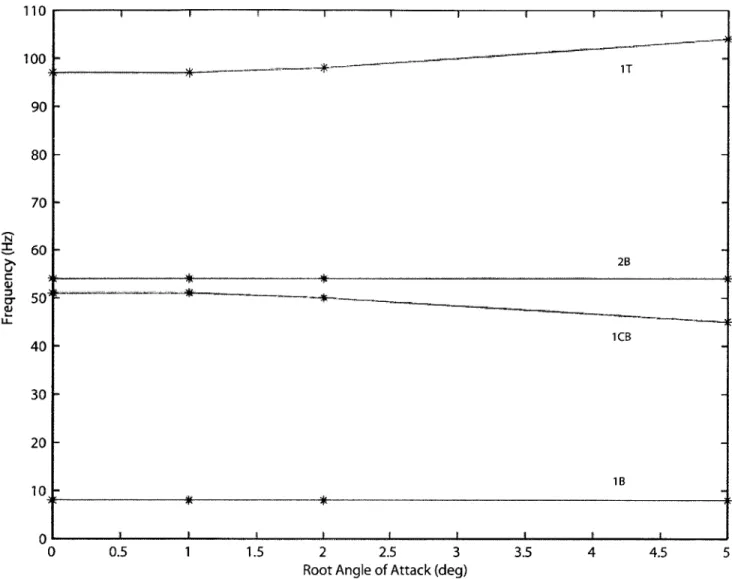
attack at 30 in/s. Table 2.4 gives the frequencies of the first six modes for 00, 1 , 2~ and 50. Figure 2-5 contains the first four modes graphically.
It is interesting to note that as the wing is bent upwards due to the force of air pressure,
0 0.5 1 1.5 2 2.5 3 3.5 4 4.5 5 Root Angle of Attack (deg)
Figure 2-5: Frequency change due to root angle of attack change at U = 30 m/s
110 100 Cr LL. 90 80 70 60 50 40 30 20 10 1T 2B 1CB 1B 0
Table 2.4: Dynamic properties at U = 30 m/s Angle of Attack 00 10 20 50 Tip Deflection -0.005 m 0.03 n 0.06 m 0.16 n 1" Bending 8 8 8 8 1" Chordwise Bending 50 49 48 40 Mode 2" Bending 52 52 52 52 Shapes 1st Torsional 95 96 98 107 3rd Bending 153 153 153 153 2"d Torsional 292 293 295 303
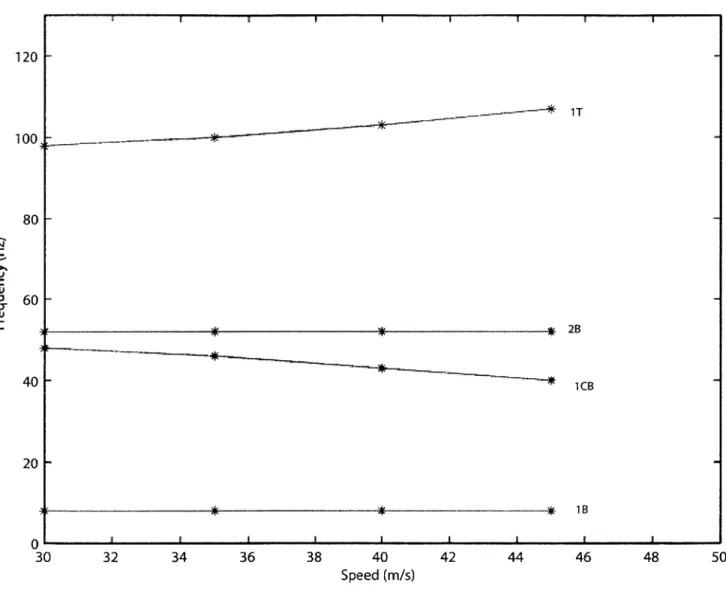
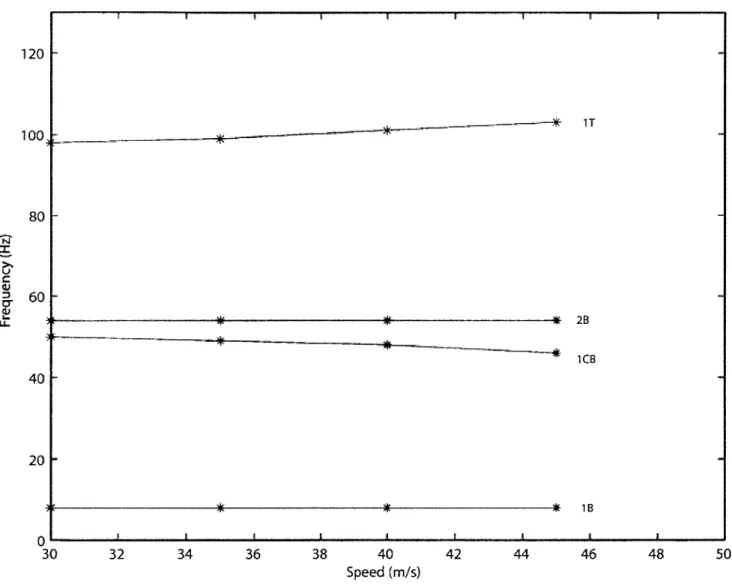
A similar behavior is also seen when the speed increases for a set angle of attack. This
behavior is illustrated in Table 2.5 and Table 2.6. The first four modes for each of these examples is presented graphically in Figure 2-6 and Figure 2-7, respectively.
Table 2.5: Dynamic properties at angle of attack = 20
Speed 30 m/s 35 m/s 40 m/s 45 m/s Tip Deflection 0.06 rn 0.09 m 0.12 rn 0.16 rn 1" Bending 8 8 8 8 1st Chordwise Bending 48 46 43 40 Mode 2" Bending 52 52 52 52 Shapes 1' Torsional 98 100 103 107 3rd Bending 153 153 153 153 2nd Torsional 295 297 300 303
This change in the dynamic behavior of the wing results in changes in its flutter speed. This is shown in Figures 2-9, 2-11, 2-18 and 2-24, which present the root locus plots for the
wing at root angles of attack of 0', 10, 20 and 5'. The flutter speeds as function of root angle
30 32 34 36 38 40 42 44 46 48 50 Speed (m/s)
Figure 2-6: Frequency change due to change in speed for 2' root angle of attack
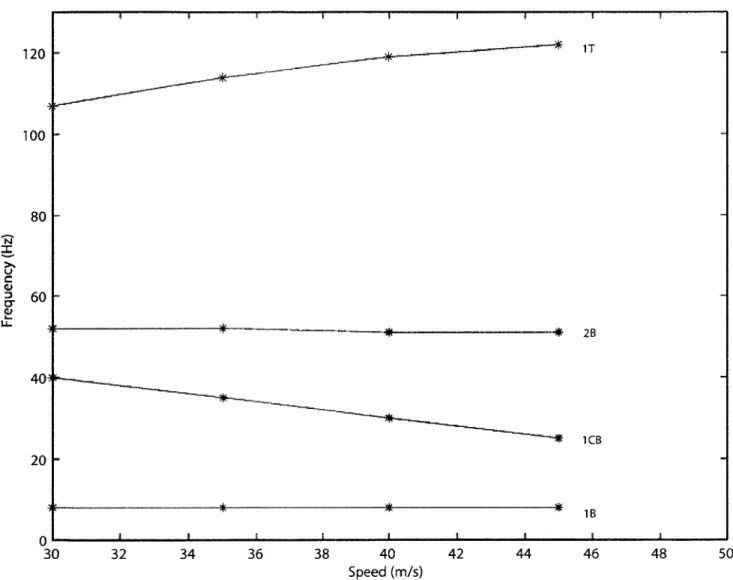
120 z U C 0) 0. U-40 20 0 1T 2B 1CB 1 B 80 60
32 34 36 38 40 42 44 46 48 50 Speed (m/s)
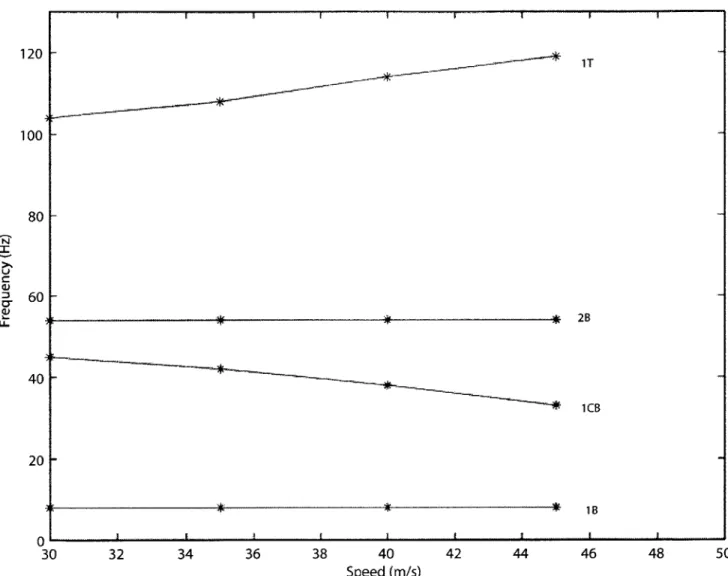
Figure 2-7: Frequency change due to change in speed for 50 root angle of attack 120 100 80 Cr 0~ UL-60 IT 2B 1CB 1B 40 20 0 30
Table 2.6: Dynamic properties at angle of attack = 50 Speed 30 m/s 35 m/s 40 m/s 45 m/s Tip Deflection 0.16 m 0.22 m 0.30 m 0.38 m 1" Bending 8 8 8 8 1st Chordwise Bending 40 35 30 25 Mode 2" Bending 52 52 51 51 Shapes 1" Torsional 107 114 119 122 3rd Bending 153 153 152 151 _ 2" Torsional 303 300 293 284 1 2 3 4 5 6 7
Root Angle of Attack (deg)
Figure 2-8: Flutter speeds for two-layer design
60 50 40 E a> . 30 C') a> i-20 10 O'L 0
Zero-Degree Root Angle of Attack
The flutter speed for zero degree root angle of attack is determined to be 55.8 m/s from the root locus plot, given in Figure 2-9. The unstable mode is the fourth mode, which is
primarily the first torsion mode. There is some chordwise bending present as well. The mode shapes for the wing at this speed are given in Figure 2-10.
Root locus for Root AOA = 0 *
200 180 140 120 100 r 80 60 40 20 0L 50 40 30 20 10 0 10 20
Real Part of Root
Figure 2-9: Root locus plot for 00 root angle of attack
I U 0~ 'I) LI~ - ---- --- ---- - - ---- - - - - - - -- - - --- - --- 3B 40 * 30 20 10 :0 ---- - - -- ---- --- --- --- - - --- - --- ----- - --- -T --- --- - - - --- --- --- - - - - - - ---- --- --- ---- - - -- - - -- - -- - - - ---- --- - -2B -931 1CB - ~- - - - -- - - --- - - - --- -- --- - - -- - - -- - - --- - - --- --- - - - - --~ 1B -20 1e 0
Speed = 55.80 m/s @ Freq = 7.97 Hz -0.6 -0.4 Speed = 55.80 m/s @ Freq = 51.5 Hz Speed = 55.80 m/s @ Freq = 95 Hz 1 Speed = 55.80 m/s @ Freq = 153 Hz 0.4 0.8 0.6 0.4 0.2 Speed = 55.80 m/s @ Freq = 292 Hz 0.2 0.8 0.6 1 0.4 0.2
Figure 2-10: Mode shapes for two-layer design at 0' root angle of attack and its corresponding flutter speed of 55.8 m/s -0.1 --0.05 0 1 0.6 0.8 Speed = 55.80 m/s @ Freq = 49.9 Hz
One-Degree Root Angle of Attack
The flutter speed for one-degree root angle of attack is determined to be 50.2 m/s, shown in Figure 2-11. The mode of instability is the second mode. A magnification of this mode is provided in Figure 2-12. This mode is primarily the first chordwise bending. However, the forces due to air pressure on the tilted wing result in some torsion being present as well. The first six mode shapes at this speed are given in Figure 2-13.
Root locus for Root AOA = 1 *
200 160 -140 Cr 4) LL 100 H-60 40 3B ifP] Af Af 1T !0 2B lCB 1B U 14A 20 H-40 30 20 10 0 10
Real Part of Root
Figure 2-11: Root locus plot for 10 root angle of attack 50 50 20 --- --- ---- --- --- --- --- --- --- --- --- --- ---
---Root locus for ---Root AOA = 1 55 5 0 - --- 2B - -- -- - -- -- I- - -- I- -- I- -400 - 8 1 C 4 5 - - - - -- - -- - - - ---- --- - - .. .- ..- - . ..-..-- --. ... . -cr2 LL- 1GB 04. .. .. . -- - - - -- - - -40 -- - - -- - - I -- - -10 8 6 4 2 0 2 4 6 8 10
Real Part of Root
Speed = 50.20 m/s @ Freq = 7.97 Hz Speed = 50.20 m/s @ Freq = 44.7 Hz -0.05 0. 0.05 0.1 1
Speed = 50.20 m/s @ Freq = 51.9 Hz Speed = 50.20 m/s @ Freq = 101 Hz
0.2 0.6 Speed = 50.20 m/s @ Freq = 153 Hz 0.4 Speed = 50.20 m/s @ Freq = 298 Hz 0.2 0.4 0.6 0.8 0.8 0.6 0.4 0.2
Figure 2-13: Mode shapes for two-layer design at 1' root angle of attack and its corresponding flutter speed of 50.2 m/s -0.1 -0.05 0 1 1 1
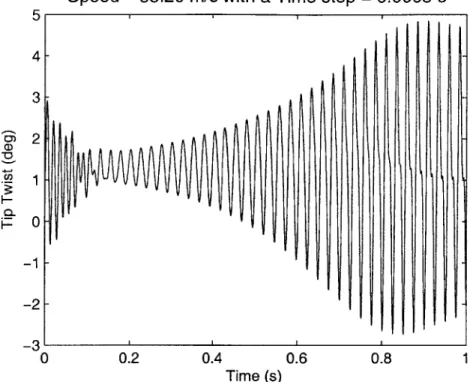
When the wing is flown at 10% above the flutter speed for a 10 root angle of attack, the wing enters into a Limit Cycle Oscillation (LCO). The tip deflections and the tip twist are
plotted for this case up to 1 second. These plots are given in Figure 2-14 thru Figure 2-16.
E 0) Ca) CI) F0 D_ Fr C.D 0.14 0.12 0.1 0.08 0.06 0.04 0.02 0 -0.02' 0
Speed = 55.20 m/s with a Time step = 0.0005 s
0.2 0.4 0.6 0.8
Time (s)
1
Figure 2-14: Nonlinear time simulation of the wing vertical tip displacement at 10% above its flutter speed (10 root angle of attack) for the two-layer design
Speed = 55.20 m/s with a Time step = 0.0005 s
0.2 0.4 0.6 0.8 1
Time (s)
Figure 2-15: Nonlinear time simulation of the wing tip twist at 10% above its flutter speed
(10 root angle of attack) for the two-layer design
Speed = 55.20 m/s with a Time step = 0.0005 s
-0.01 -0.005 0 0.005 0.01 0.015 Y Displacement (m) 5 4 3 2 1 0 0) 0-_0 1 23 -0 0.13 0.125 0.12 0.1 15 [ E U) 0 N 0. 0.11 105 F 0.1 '--0.015
A strain analysis was performed on the wing when it was at its maximum deflection.
This occurs during the initial rise shown in Figure 2-14. The maximum tensile strain is
2660 pm/m and the maximum shear strain is -769 pm/m. Both occur at the bottom of
the root of the wing in the outer ply. These results are summarized in Figure 2-17. From Appendix B, the maximum allowable strain for E-glass/epoxy is 10000 pm/m in tension and
15000 pum/m in shear. This results in a margin of safety (Equation 2.1) of 2.76 for tension
and 18.5 for shear.
Allowable
MS(%) = Actual - 1 (2.1)
Actual
eps1 (longitudinal fiber strain), ply 3 eglass 120: MAX = 0.0026595
eps2 (transverse fiber strain), ply 3 eglass 120: MAX = -0.00039362
eps3 (in plane shear strain), ply 3 eglass 120: MAX = -0.00076936
Figure 2-17: Maximum ply strain reached at 10% above flutter speed of 10 root angle of attack for the two-layer design
Two-Degree Root Angle of Attack
The flutter speed for two-degree root angle of attack is determined to be 47.5 m/s from the root locus plot shown in Figure 2-18. The instability mode is the same as for 10, except the
amount of torsion present has increased. Also, by the time the angle of attack is 2', the effects of the large deflections on the wing cause the natural frequency of the fourth mode to increase with increasing speed instead of decrease as it did in the 00 and 10 cases. The drop in the second natural frequency due to the increased upward bend also causes the second mode to turn over faster and amplifies the effects of flow over the wing. The first six modes at flutter speed are provided in Figure 2-19.
Root locus for Root AOA = 2*
120 V- .- .
100 --- ---
-80
---Figure 2-18: Root locus plot for 2' root angle of attack 200 180 160 140 N = U C ~1) LI~ 3B 40 30 2n 1 ---- - - - -- - - - --- - -_ --- - ---- --- ---T -0 - - - - - - -- - -- ---- - --- - - - - --- ------ ---2 B -' ~ -1CB --- ---0 -.- .- - -. -- .-*~ V B -- - - -- - - - - - - - - - - -- - -- --- - - - - - --- - - --- . . ..-.. ------- -_ 1B -20E 10 0)i 60 - -- . 4 4 140 40 20 50 40 30 20 10
Real Part of Root
0 10 20
-Speed = 47.50 m/s @ Freq = 7.98 Hz Speed = 47.50 m/s @ Freq = 51.8 Hz Speed = 47.50 m/s @ Freq = 153 Hz 1 Speed = 47.50 m/s @ Freq = 109 Hz Speed = 47.50 m/s @ Freq = 302 Hz 0.2 0.8 1 0.6 0.4 0.8 0.6 0.4 0.2
Figure 2-19: Mode shapes for two-layer design at 2' root angle of attack and at its corre-sponding flutter speed of 47.5 m/s
-..
For 2' angle of attack, the wing also enters a LCO when flown at 10% above its flutter speed. The tip deflections and the tip twist are plotted for this case up to 1 second. These
plots are given in Figure 2-20 thru Figure 2-22. Notice from Figure 2-22 that the LCO now has more than one frequency (no single ellipse on the plot), indicating potentially chaotic
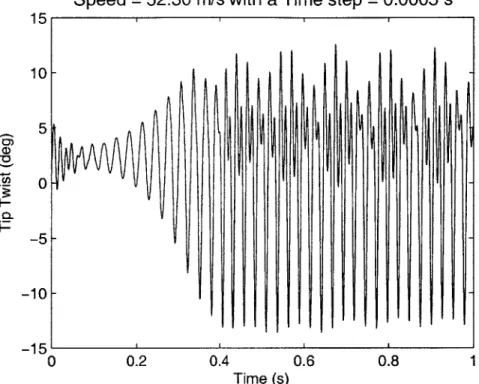
response. E a) 0 CO 0 0.3 0.25 0.2 0.15 0.1 0.05
Speed = 52.30 m/s with a Time step = 0.0005 s
0.2 0.4 0.6 0.8
Time (s)
1
Figure 2-20: Nonlinear time simulation of the wing vertical tip displacement at 10% above its flutter speed (20 root angle of attack) for the two-layer design
0
-0.05-0
15
10
5
0
-5
Speed = 52.30 m/s with a Time step = 0.0005 s
0.2 0.4 0.6 0.8
Time (s)
1
Figure 2-21: Nonlinear time simulation of the wing tip twist at 10% above its flutter speed (20 root angle of attack) for the two-layer design
Speed = 52.30 m/s with a Time step = 0.0005 s
-0.03 -0.02 -0.01 0 0.01
Y Displacement (m)
0.02 0.03 0.04
Figure 2-22: Nonlinear time simulation of the wing tip motion at 10% above its flutter speed (20 root angle of attack) for the two-layer design
0) U, V I-0. R 0.16 0.15 0.14 0.13 0.12 0.11 E U> E (D 0 CN 0 N 0.11-0.09 0.08' -0.04 10 15 -0
A strain analysis was performed on the wing when it was at its maximum deflection.
This occurs during the transient rise shown in Figure 2-20. The maximum tensile strain is
4484 pm/m and the maximum shear strain is -2726 pm/m. Both occur at the bottom of the root of the wing in the outer ply. These details are summarized in Figure 2-23. These
strains result in a margin of safety of 1.23 and 4.5, respectively.
eps1 (longitudinal fiber strain), ply 3 eglass 120: MAX = 0.0044837
eps2 (transverse fiber strain), ply 3 eglass 120: MAX = -0.00066361
eps3 (in plane shear strain), ply 3 eglass 120: MAX = -0.0027264
Figure 2-23: Maximum ply strain reached at 10% above flutter speed of 2' root angle of attack for the two-layer design
Five-Degree Root Angle of Attack
The flutter speed for five-degree root angle of attack is determined to be 38.8 m/s from the
root locus plot provided in Figure 2-24. As with the 1 and 2' cases, the mode of instability is the second mode, which is the 1" chordwise bending with some torsional effects. As was seen in the 20 case, the changes in the dynamic behavior due to the increased upward bend
mode to further curve upward. Although with the fourth mode, we see an interaction with the fifth mode (3rd bending) starting to cause the fourth mode to turn towards the instability
line as well. The first six mode shapes for this case are provided in Figure 2-25.
Root locus for Root AOA = 5 *
I Li ~LI LL 200 180 160 140 120 100 80 60 40 20 0 50 40 30 20 10 0 10 20
Real Part of Root
Figure 2-24: Root locus plot for 50 root angle of attack
- -- - - -- - - - - -- - - - - - -- --- - - -- -- - - -- - - - ----- 3B 024 4 4 30 --- 3 ---- 20 0 -- 13
0
--. . . . . . . . .- - - - - -1T 10 -- - - - -- - - ---- - -- - - - ---- -20- ---- -- - -- - ---2B -- - --- --- --- --- - -- - - 0- - - ----- - .--- - ---- - - 1 - -- - - --1B -20 10Speed = 38.80 m/s @ Freq = 7.99 Hz
Speed = 38.80 m/s @ Freq = 51.5 Hz
Speed = 38.80 m/s @ Freq = 152 Hz
Speed = 38.80 m/s @ Freq = 118 Hz
Speed = 38.80 m/s @ Freq = 294 Hz
Figure 2-25: Mode shapes for two-layer design at 5' sponding flutter speed of 38.8 m/s
0.1
-- --- -00.
00
0.8
root angle of attack and at its
For 5' root angle of attack, the wing also enters a LCO when flown at 10% above the flutter speed. The tip deflections and the tip twist are plotted for this case up to 1 second.
These plots are given in Figure 2-26 thru Figure 2-28.
Speed = 42.70 m/s with a Time step = 0.0005 s
E 0 CO CO, 0.4 0.35 0.3 0.25 0.2 0.15 0.1 0.05 0 -0.05 L 0 0.2 0.4 0.6 0.8 1 Time (s)
Figure 2-26: Nonlinear time simulation of the wing vertical tip displacement at 10% above
its flutter speed (50 root angle of attack) for the two-layer design
A strain analysis was performed on the wing when it was at its maximum deflection.
This occurs during the initial rise shown in Figure 2-26. The maximum tensile strain is
7405 pm/m and the maximum shear strain is -5018 pm/m. Both occur at the bottom of the root of the wing in the outer ply. These details are summarized in Figure 2-29. These
aO CL P, 20 15 10 5 0
Speed = 42.70 m/s with a Time step = 0.0005 s
0.2 0.4 0.6 0.8 1
Time (s)
Figure 2-27: Nonlinear time simulation of the wing tip twist at 10% above its flutter speed
(50 root angle of attack) for the two-layer design
Speed = 42.70 m/s with a Time step = 0.0005 s
-0.04 -0.03 -0.02 -0.01 Y Displacement (m) 0 0.01 0.02 0.3 0.28- 0.26- 0.24-C a) E C, C., .O 0 N 0 .22 F 0.2 F 0.18' -0.05 5 10 -0
eps1 (longitudinal fiber strain), ply 3 eglass 120: MAX = 0.0074051
eps2 (transverse fiber strain), ply 3 eglass 120: MAX = -0.001096
eps3 (in plane shear strain), ply 3 eglass 120: MAX = -0.0050181
. . . . . . .
Figure 2-29: Maximum ply strain at reached at 10% above flutter speed of 5' root angle of attack for the two-layer design
[IWI, MULL,,, IDIUWI lirnIT
2.3
Three-Layer Design
2.3.1
Basic Characteristics
The three-layer design resembles the previous one with the exception of an added layer of E-glass/epoxy fabric, also oriented at 00 (Figure 2-30.
[03]
Figure 2-30: Cross section of three-layer wing (NACA 0012)
The cross sectional stiffness properties for this design are provided in Table 2.7. A detailed definition of the terms for this matrix are provided in Appendix A. The inertia matrix for
Table 2.7: Non-zero stiffness matrix terms for three-layer design: 1 = Extension, 2 = Torsion, 3 = Flatwise Bending, 4 = Chordwise Bending
Ku1 1.39 *106 N K14= K41 -2.35 * 104 N*m K2 2 19.66 N*m 2 K33 33.19 N*m2 K4 4 1.63 * 103 N*m 2
this cross-section is provided in Table 2.8. The center of gravity for the cross-section is
Table 2.8: Non-zero inertial matrix terms for two-layer design
Ill 0.13 * 10-3 m4
I22 0.32 * 10- 5 m4
133 0.13 * 10-3 m4