Advancing Clinical Gait Analysis Through
Technology and Policy
by Junjay Tan
B.S., Mechanical Engineering and B.A., Plan II Liberal Arts The University of Texas at Austin, 2006
Submitted to the Engineering Systems Division and the Department of Mechanical Engineering in Partial Fulfillment of the Requirements for the Degrees of
MASTER OF SCIENCE IN TECHNOLOGY AND POLICY and MASTER OF SCIENCE IN MECHANICAL ENGINEERING
at the
MASSACHUSETTS INSTITUTE OF TECHNOLOGY June 2009
2009 Massachusetts Institute of Technology. All rights reserved. Signature of Author:
Engineering Systems Division and Dept. of Mechanical Engineering April 20, 2009 Certified by:
Dava J. Newman Professor of Aeronautics and Astronautics and Engineering Systems Thesis Supervisor Certified by:
C. Forbes Dewey, Jr. Professor of Mechanical Engineering and Biological Engineering Thesis Reader Accepted by:
Dava J. Newman Professor of Aeronautics and Astronautics and Engineering Systems Director, Technology and Policy Program Accepted by:
David E. Hardt Chairman, Committee on Graduate Students Department of Mechanical Engineering
Advancing Clinical Gait Analysis Through Technology and
Policy
by
Junjay Tan
Submitted to the Engineering Systems Division and the Department of Mechanical Engineering on April 20, 2009 in Partial Fulfillment of the Requirements for the Degree of Master of Science
in Technology and Policy and the Degree of Master of Science in Mechanical Engineering.
Abstract
Quantitatively analyzing human gait biomechanics will improve our ability to diagnose and treat disability and to measure the effectiveness of assistive devices. Gait analysis is one technology used to analyze walking, but technical as well as economic, social, and policy issues hinder its clinical adoption. This thesis is divided into two parts that address some of these issues.
Part I focuses on the role public policies have in advancing gait analysis. Through an analysis of gait analysis technologies, case studies of MRI and CT Angiography, and a high-level analysis of data standards used in gait analysis, it concludes that policies cannot directly create the institutional structures and the data standards required to advance gait analysis as a clinical diagnostic tool. Only through indirect means, such as research funding, can policies support the development of organizations to take ownership of gait analysis technologies. Part I also
concludes that policies should not fund development of gait technologies but instead should fund research units working on data standards and accurate human body models.
Part II focuses on a technical issue in gait analysis, namely, how to address uncertainties in joint moment calculations that occur from using different body segment inertial parameter estimation models. This is identified as a technical issue needing attention from our broader policy analysis in Part I. Using sensitivity studies of forward dynamics computer simulations coupled with an analysis of the dynamical equations of motion, Part II shows that joint moment variations resulting from different segment inertial parameters are significant at some parts of the gait cycle, particularly heel strike and leg swing. It provides recommendations about which segment inertial parameters one should estimate more accurately depending on which joints and phases of the gait cycle one is interested in analyzing.
Thesis Supervisor:
Dava J. Newman, Professor of Aeronautics and Astronautics and Engineering Systems Thesis Reader:
Acknowledgements
“Oh I get by with a little help from my friends/ I get high with a little help from my friends/
Oh I'm gonna try with a little help from my friends/” --The Beatles
First and foremost, thanks to my parents and my sister Lilian for their love, support, and confidence in my abilities through the years. I would not be where I am today without them.
Thanks to Dava for her creative spirit, generosity, support, and broad perspective on life. She has taught me much throughout my years at MIT. Thanks also to Forbes for his insights and advice in graduate school, as well as for introducing me to many aspects of bioengineering and biomedical informatics I had not known about before coming to MIT.
A big thanks to all my good friends at MIT who have kept me smiling through hard times, provided heart-to-heart talks, and reminded me of the beauty of life when things were down, especially Kyle (Mr. “Buddy Lee”), Tim, Rob (“Dr. Love”), Megan, Valerie, Shan, Decker, Monica, Zoe, Romain Levy, Travis, and Jesse. Also, thanks to other members of the MIT community who have taken time to mentor me in various ways, including Gari Clifford and Ken Zolot.
Thanks to all the other student, faculty, and staff members of the Man-Vehicle Lab who have made my graduate experience enjoyable—especially Thaddeus, Jessicas (both of them), Jaime, Chris, and Zakiya. I especially thank my officemate Roedolph for making our office the most fun office in the world, even if we didn’t have sunlight and had to battle roaches at times. Good thing we had our Nerf gun!
A special “thanks, mate” to James Waldie for his help and moral support. The lab could not ask for a better (and more fun) postdoc. Thanks also to Alan Natapoff for ideas and help with statistical analysis. Thanks to Sydney, Ed, and Sally for helping me with various administrative issues that have arisen (as well as great conversations).
I gratefully acknowledge the MIT-Portugal Program for funding much of this research. Thanks to Frank Field for his funding through a TA position in ESD.10, and to Profs. Pierre Lermusiaux, Evelyn Wang, and Alexander Mitsos for their funding through a TA position in 2.005, as well as Martin Segado, who was a great 2.005 co-TA. It was a great joy to work with you all!
Table of Contents
Abstract ...3 Acknowledgements ...5 Table of Contents ...7 List of Figures...11 List of Tables ...13 1 Introduction...15 1.1 Problem ...151.1.1 Health Technology Policy ...15
1.1.2 Gait Analysis Technical Issue ...16
1.2 Research Overview...16 1.2.1 Research Questions ...16 1.2.2 Hypotheses ...16 1.2.3 Methodology...17 1.2.4 Conclusions ...17 1.2.5 Contributions ...17
1.2.6 Limitations and Future Work ...17
1.3 Motivation ...18
1.4 Definitions ...19
1.5 Overview of the Following Chapters...20
PART I: Public Policies for Advancing Gait Analysis...21
Hypothesis ...21
Scope ...21
Methodology ...22
Overview of Proceeding Chapters in Part I ...22
2 Gait Analysis and Related Policies ...23
2.1 Health Technology Policy...23
2.1.1 Rationale for Government Intervention ...23
2.1.2 Regulation of Diagnostic Technologies ...23
2.1.3 Reimbursement ...24
2.1.4 Evidence-based medicine ...25
2.2 Gait Analysis Overview ...26
2.2.1 Diagnostic Potential ...26
2.2.2 History of Modern Gait Analysis...26
2.2.3 Gait Analysis Process...27
2.2.4 Coverage...28
2.2.5 Economics ...28
2.2.6 Criticisms of Gait Analysis ...29
3 Gait Analysis Technology Transferability...33
3.1 Gait Analysis Technologies ...33
3.1.1 Motion Capture Technologies ...34
3.1.2 Force Measurement Technologies ...36
3.1.3 Instrumented Treadmills ...37
3.1.5 Software ...38
3.2 Major Commercial Markets ...38
3.3 Technology Transferability Between Markets ...39
3.3.1 Market Overlaps ...39
3.3.2 Performance requirements...40
3.3.3 Regulatory Hurdles ...41
3.4 Conclusions ...41
4 MRI and CT Angiography Case Studies ...43
4.1 Methodology ...43
4.1.1 Justification for Case Study Method...43
4.1.2 Justification of Cases ...43
4.1.3 Propositions ...44
4.2 Case Study 1: MRI ...45
4.2.1 Technology ...45
4.2.2 Social, Political, and Economic history ...46
4.2.3 Effectiveness and Advantages ...47
4.2.4 Economics ...47
4.2.5 Work Practices...48
4.2.6 Analysis ...48
4.3 Case Study 2: CT Angiograms ...49
4.3.1 Technology ...49
4.3.2 History...50
4.3.3 Regulation ...51
4.3.4 Economics ...51
4.3.5 Controversies Regarding CTA ...51
4.3.6 Analysis ...52
4.4 Case Study Conclusions...53
5 Data Standards and Part I Conclusions ...55
5.1 Scope...55
5.2 Methodology ...55
5.3 Background on Technical Standards and Protocols ...55
5.4 Gait Analysis Data Standards...56
5.4.1 Motion Capture Standards...56
5.4.2 Recommended Formats: C3D and OpenSim ...58
5.5 DICOM ...58
5.5.1 Brief Overview of DICOM Standard...59
5.5.2 Brief History ...59
5.5.4 How It Works (a very high level view)...60
5.5.5 Lessons for Gait Analysis...62
5.6 Policy Recommendations...62
5.7 Part I Concluding Policy Recommendations ...63
5.7.1 Policy Recommendations ...63
5.8 Future Work ...64
PART II: Body Segment Inertial Parameter Effects on Joint Moment Results ...65
Problem...65
Methodology ...65
Conclusions...66
Overview of Proceeding Chapters ...66
6 Biomechanics of Human Locomotion………..67
6.1 Biomechanics of Walking ...67
6.2 Gait Analysis Concepts...70
6.2.1 Rigid Body Dynamics in Gait Analysis ...70
6.2.2 Uncertainties in Gait Analysis Results...70
6.2.3 Body Segment Inertial Parameters in Gait Analysis...71
6.3 Literature Review ...71
6.4 Summary ...74
7 Methodology for Part II………..75
7.1 Body Segment Inertial Parameter (BSIP) Estimation Models ...75
7.1.1 Definitions ...75
7.1.2 Descriptions of Body Segment Inertial Parameter (BSIP) Models ...75
7.1.3 Calculations from Models ...79
7.2 Human Body Model ...82
7.2.1 Actuator Set ...82
7.3 Gait Data ...83
7.4 Software ...84
7.5 Simulations...84
7.5.1 Scaling and Inverse Kinematics (IK) Algorithms ...84
7.5.2 Computed Muscle Control (CMC) Algorithm ...85
7.5.3 Simulation Inputs ...86
7.5.4 Summary ...87
7.6 Rigid Body Dynamics Analysis ...89
7.6.1 3D Analysis ...89
7.6.2 Flexion moment (2D analysis) equations...91
7.6.3 Moment Sensitivities to individual BSIPs ...93
7.7 Summary ...93
8 Results and Conclusions for Part II...95
8.1 3D OpenSim Simulation Results...95
8.2 2D Dynamics Analysis Results ...101
8.2.1 Comparison with 3D simulation results ...103
8.2.2 Discussion ...104
8.3 Conclusions and recommendations ...111
8.4 Future work ...113
Appendix A: Subject OpenSim Model Anthropometry...115
Appendix B: Body Segment Inertial Parameter Calculations ...117
Appendix C: Relevant OpenSim Files ...135
Appendix D: Rigid-Body Dynamics Derivations ...145
Appendix E: MATLAB script for 2D Dynamics analysis ...157
List of Figures
Figure 1: Percentage of adults with mobility difficulties by age (Iezzoni, 2003) ...18
Figure 2: Typical gait analysis setup (Medscape.com) ...33
Figure 3: Ascension Technology’s MotionStar magnetic motion capture system ...34
Figure 4: Meta Motion’s Gypsy mechanical motion capture system ...35
Figure 5: Markerless motion capture system (Organic Motion) ...36
Figure 6: Xsen’s Moven sensor-based motion capture suit ...36
Figure 7: Force Plate for Gait Analysis (Noraxon U.S.A. Inc., 2009)...37
Figure 8: image from Tekscan’s pressure mapping system ...37
Figure 9: Invasive (left) and noninvasive (right) EMG systems ...38
Figure 10: MRI scanner architecture (left) and magnetic coil design (right) (Coyne, 2009)...45
Figure 11: CT Technology (Brenner & Hall, 2007) ...50
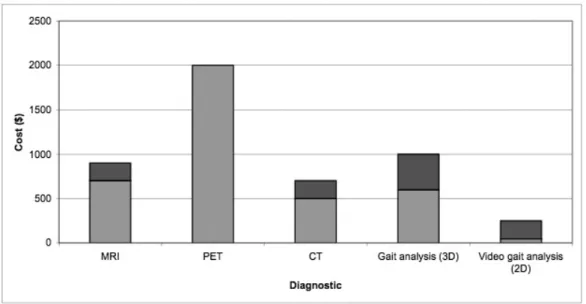
Figure 12: Average range of payment costs for several imaging and gait analysis procedures, not including insurance reimbursement (colors represent range of costs, with darker regions signifying the low to high range) ...54
Figure 13: Typical workflow for radiological data in a hospital (Pianykh, 2008) ...60
Figure 14: DICOM four level information hierarchy used to uniquely identify data (Pianykh, 2008)...61
Figure 15: From Patient to Patient Object in DICOM ...61
Figure 16: Example of knee flexion and extension (left) and hip flexion and extension (right) ..67
Figure 17: Phases in human walking (Inman et al., 1981)...68
Figure 18: Body Planes (training.seer.cancer.gov) ...69
Figure 19: Vertical sinusoidal oscillation of center of mass during walking from Fig 1.12 of (Inman et al., 1981) ...69
Figure 20: Side-to-side motion of center of mass during walking from Fig. 1.13 of (Inman et al., 1981)...69
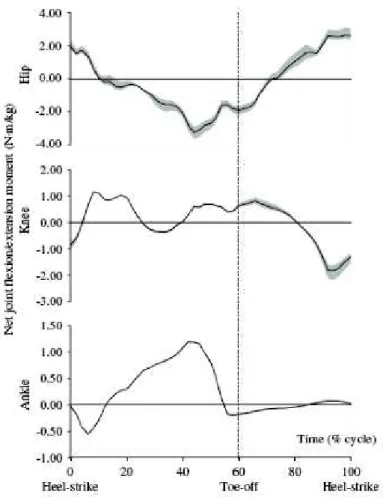
Figure 21: Mean (black line) and range of joint moments (grey) observed by Rao et al. using six different BSIP models to analyze walking gait analysis data. ...72
Figure 22: 3D, 23 degree-of-freedom human body model used in the analysis. (Anderson et al., 2006)...82
Figure 23: Gait Analysis System used (left) (Neuromuscular Biomechanics Lab, 2008) and gait data representation in OpenSim (right) ...84
Figure 24: Scaling the generic OpenSim model and determining joint angles to match experimental data ...85
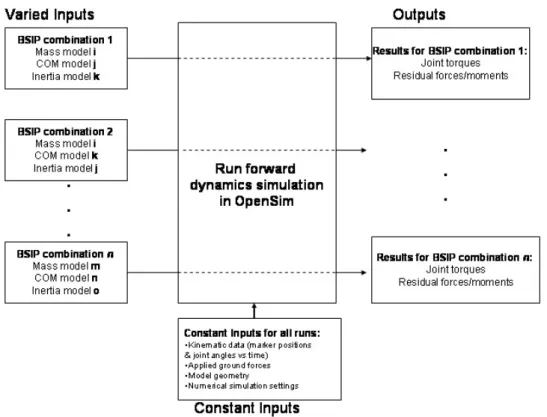
Figure 25: Summary of constant and varied inputs/outputs to simulations ...87
Figure 26: Mean +/- variance for RIGHT LEG HIP FLEXION moment normalized by subject’s body mass, where positive moments represent hip flexion, as shown in the drawing [3D simulations] (figure from Inman and weboflife.nasa.gov) ...96
Figure 27: Mean +/- variance for RIGHT LEG HIP ADDUCTION moment normalized by subject’s body mass [3D simulations]...96
Figure 28: Mean +/- variance for RIGHT LEG KNEE FLEXION moment normalized by subject’s body mass, where positive moments represent knee extension [3D simulations] (ovrt.nist.gov)...97
Figure 30: Variance and max difference in RIGHT LEG HIP FLEXION moment calculations
between the BSIP models used [3D simulations] ...98
Figure 31: Variance and max difference in RIGHT LEG HIP ADDUCTION moment calculations between the BSIP models used [3D simulations]...98
Figure 32: Variance and max difference in RIGHT LEG KNEE FLEXION moment calculations between the BSIP models used [3D simulations] ...99
Figure 33: Variance and max difference in RIGHT LEG ANKLE FLEXION moment calculations between the BSIP models used [3D simulations]...99
Figure 34: Total mean residual force magnitudes applied to body to maintain simulation model consistency with measurements [3D simulations] ...101
Figure 35: Comparison of 3D simulation variance and maximum difference between BSIP model results and 2D analysis for ANKLE FLEXION moment [3D simulations] [2D Dynamics] ...103
Figure 36: Comparison of 3D simulation variance and maximum difference between BSIP model results and 2D analysis for KNEE FLEXION moment [3D simulations] [2D Dynamics] .104 Figure 37: Comparison of 3D simulation variance and maximum difference between BSIP model results and 2D analysis for HIP FLEXION moment [3D simulations] [2D Dynamics] ...104
Figure 38: Sensitivity of normalized hip, knee, and ankle flexion moment variations to foot mass [2D Dynamics] ...108
Figure 39: Sensitivity of hip flexion normalized moment variations to foot, shank, and thigh mass [2D Dynamics] ...108
Figure 40: Sensitivity of normalized hip flexion moment to variations in foot, shank, and thigh center-of-mass locations [2D Dynamics] ...109
Figure 41: Sensitivity of normalized hip flexion moment variations to inertias [2D Dynamics]110 Figure 42: Plan of dismemberment for cadavers (Dempster, 1955)...117
Figure 43: Division of body segments in de Leva ...124
Figure 44: Schematic of 2D dynamic analysis body model ...145
Figure 45: Free body diagram of foot ...146
Figure 46: Free body diagram of lower leg ...148
Figure 47: Free body diagram of upper leg ...149
Figure 48: Free body diagram of HAT segment...150
Figure 49: Free body diagram of pelvis ...151
Figure 50: Definitions of body planes...152
List of Tables
Table 1: Adults Reporting Mobility Difficulty in 2001 (Iezzoni, 2003)...18
Table 2: Common Causes of Mobility Difficulties (Iezzoni, 2003) ...19
Table 3: Levels of Evidence in Evaluations of Diagnostic Technologies, with examples taken from the medical imaging field (Pearson et al., 2008) ...25
Table 4: Main criticisms of gait analysis...31
Table 5: Gait Analysis Technologies Used In Commercial Markets ...40
Table 6: Main criticisms of gait analysis (trimmed version of Table 4)...44
Table 7: Summary of the different estimation models used in this study ...78
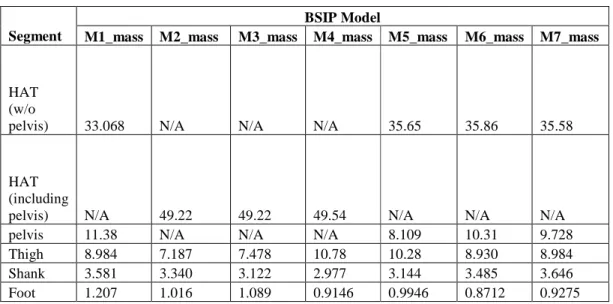
Table 8: Segment mass estimates in kg for each BSIP model (kg) ...79
Table 9: Segment center-of-mass location estimates for each BSIP model (m) ...80
Table 10: Segment inertia estimates for each BSIP model (kg-m2) ...81
Table 11: Simulations performed ...88
Table 12: Average sensitivity over one gait cycle of joint moment variations to changes in segment mass (N-m/kg^2) [2D dynamics] ...105
Table 13: Average sensitivity over one gait cycle of joint moment variations to changes in segment center-of-mass locations (N/kg) [2D dynamics] ...106
Table 14: Average sensitivity over one gait cycle of joint moment variations to changes in segment inertias (N/kg) [2D dynamics] ...106
Table 15: Maximum differences in BSIP estimations between models ...106
Table 16: Calculated variations in flexion joint moments averaged per gait cycle in experimental subject based on maximum difference in segment mass estimates (N-m) [2D Dynamics] 106 Table 17: Calculated variations in flexion joint moments averaged per gait cycle in experimental subject based on maximum difference in segment center-of-mass location estimates (N-m) [2D Dynamics] ...107
Table 18: Calculated variations in flexion joint moments averaged per gait cycle in experimental subject based on maximum difference in segment inertia estimates (N-m) [2D Dynamics] ...107
Table 19: Contributions of each BSIP to hip flexion moment uncertainty from 45-55% of gait cycle for our subject [2D analysis]...111
Table 20: Recommendations for BSIP estimations ...112
Table 21: Segment masses calculated using Dempster...118
Table 22: Center-of-mass locations according to Dempster translated to OpenSim model locations ...119
Table 23: Segment masses calculated using Clauser ...120
Table 24: Segment com locations calculated using Clauser ...120
Table 25: Segment masses calculated using Chandler’s regression equations ...121
Table 26: Segment center-of-mass locations using Chandler’s relations ...122
Table 27: Segment moments of inertia calculated using Chandler’s regression equations ...122
Table 28: Segment masses calculated using de Leva’s relations ...125
Table 29: Segment center-of-mass locations calculated using de Leva’s relations...126
Table 30: Conversion of de Leva’s radii of gyration relations to OpenSim model proportions .127 Table 31: Segment inertia values based on de Leva ...128
Table 33: Segment com locations calculated using Dumas ...130 Table 34: Segment radii of gyration calculated using Dumas...132 Table 35: Segment inertias calculated using Dumas ...133
1
Introduction
Upright movement permeates American aphorisms, connoting independence, autonomy,
perseverance, strength, achievement—‘standing on your own two feet,’ ‘walking tall,’ ‘standing up for yourself,’ ‘taking things in stride,’ ‘climbing the ladder of success,’ ‘one small step for a man, one giant leap for mankind.’
--Lisa Iezzoni, When Walking Fails
1.1 Problem
Quantitatively analyzing human gait biomechanics will improve our ability to diagnose and treat disability and to measure the effectiveness of assistive devices. Of the many types of human movement, this thesis focuses on walking, which is a fundamental movement associated with social independence and many health benefits. Gait analysis is one technology used to study walking, but technical as well as economic, social, and policy issues hinder its clinical adoption.
This thesis is divided into two parts, both of which focus on clinical gait analysis. The first part focuses on the role public policies have in advancing gait analysis. The second part focuses on a technical issue in gait analysis, namely, how to address uncertainties in joint moment calculations that occur from using different body segment inertial parameter estimation models. This is identified as a technical issue that needs attention based on our broader policy analysis. The specific health technology and technical problems are explained in greater detail below.
1.1.1 Health Technology Policy
Health technology policy faces a tension between a desire for stricter cost-effectiveness scrutiny and the fear that overly strict standards will prevent promising technologies from being used, after which their effectiveness are often discovered. The latter fear is cited to justify implementing public policies, such as Medicare reimbursement, to support the development or use of an untested medical technology.
This tension means that costly technologies with unclear benefits are sometimes
supported, while at other times promising technologies are stalled. Gait analysis fits in the latter category, though public policies to directly support its development and use may not be required because its technologies have non-medical applications as well. Technologies that have medical and non-medical applications may not require federal support if regulatory barriers to entry into medical markets are low.
At the same time, just because a technology is transferable from commercial to medical applications and has low regulatory barriers does not mean that its clinical promise can be fully realized without policies that create appropriate institutional structures and technology standards. Part I analyzes these issues to determine what role public policies have in advancing gait
1.1.2 Gait Analysis Technical Issue
An important output calculated from gait analysis is joint moments (or torques). Joint moments are important to know for two reasons. First, they can be correlated to poor
biomechanics that may lead to degenerative processes. Second, they can be used to compute other variables, such as joint powers and individual muscle and tendon forces (Challis & Kerwin, 1996). But difficulty arises because joint moments are not directly measured variables and must be calculated from experimental data based on additional assumptions, one of these being body segment inertial parameters (BSIPs). BSIPs consist of body segment masses, center-of-mass locations, and inertias. This technical issue limits the use of gait analysis in clinical decision-making. An analysis of uncertainties in joint moment calculations due to differing BSIP values is therefore important for understanding how joint moment calculations may vary for the same subject, which relates to gait analysis’s variability and accuracy.
Although we can take more accurate measurements of the entire body to try to achieve better BSIP estimates, this is an inefficient method. The research in Part II aims to provide guidelines regarding which specific body parts to measure more accurately depending on which cycle of the gait cycle one is interested in examining.
1.2 Research Overview
This section presents an overview of the research questions, hypotheses, methodology, conclusions, and limitations of this thesis.
1.2.1 Research Questions
To address the problems discussed in Section 1.1, this thesis is divided into two parts focusing on the following research questions:
• Part I: What public policies are appropriate for advancing clinical gait analysis?
• Part II: How can we better interpret joint moment results from gait analysis in light of large uncertainties in body segment inertial parameter estimates?
1.2.2 Hypotheses
In Part I, we hypothesized that the technologies required for gait analysis can be developed through commercial (non-medical) markets and that policies should focus on fostering the professional institutions and data standards required for clinical gait analysis to be a practical diagnostic tool.
In Part II, we hypothesized the following about joint moment results:
• Joint moment estimates will be significantly different during periods of high force impact, i.e., during heel strike, but similar at other periods of the gait cycle
• Joint moment variations will be different for different joints.
1.2.3 Methodology
The methodology used in Part I involves an analysis of gait analysis technologies, case studies of MRI and CT Angiography to draw lessons for advancing clinical gait analysis, and a high-level analysis of data standards used in gait analysis for improving data sharing.
The methodology used in Part II of this thesis involves sensitivity studies of forward dynamics computer simulations as well as analyses of the dynamical equations of motion. 3D forward dynamic simulations are physical simulations that track experimental gait data in order to capture data from instrumented “virtual humans.” It is an increasingly popular method for studying human locomotion.
1.2.4 Conclusions
Part I concludes that policies cannot directly create the professional institutional structures and the data standards required to advance gait analysis as a clinical diagnostic tool. Only through indirect means, such as research funding, can policies support the development of organizations to take ownership of gait analysis technologies and data standards. Part I also concludes that policies should not fund development of gait technologies, but instead should fund research units working on data standards and accurate human body models.
Part II of this thesis concludes that joint moment variations resulting from different segment inertial parameters are significant at some parts of the gait cycle, particularly heel strike and leg swing. It provides recommendations about which segment inertial parameters one should estimate more accurately depending on which joints and which phases of the gait cycle one is interested in analyzing.
1.2.5 Contributions
This thesis presents several contributions. First, it provides recommendations on how public policies can advance gait analysis as a clinical tool. Though much literature exists regarding public policies for other diagnostics, such as medical imaging, there is a dearth of literature regarding gait analysis. Second, this thesis analyzes how body segment inertial parameter (BSIP) values affect joint torque estimates in gait analysis and provides
recommendations on which BSIPs to measure more accurately depending on the joints and gait phases of interest.
1.2.6 Limitations and Future Work
Part I could analyze other related diagnostic modalities, both inside and outside the imaging field, as well as expand the standards analysis beyond data sharing to encompass clinical protocols. Also, Part I could analyze wearable sensor technologies, which hold promise as a technology for mobile gait analysis and for which regulations are still emerging.
The major limitations of Part II are that it analyzes one subject at one walking speed and analyzes only one body model.
1.3 Motivation
Physical disability is a significant national health problem that will only worsen as the population ages, a trend highlighted in Figure 1. In 2000, close to one fifth of community dwelling persons age five and older in the U.S. reported disabilities, while 41.9% of adults age 64 and older reported disabilities.
Figure 1: Percentage of adults with mobility difficulties by age (Iezzoni, 2003)
Further, the U.S. census bureau projects that the number of elderly will rise from 34.7 million in 2000 to 69.4 million in 2030. Of these elderly, 39.5 million reported sensory and physical disabilities in 2001. People with significant physical disabilities also live longer today due to advances in medicine, further compounding the costs of disability (Iezzoni & O'Day, 2006). Treating and diagnosing physical disability through improved medical technologies is therefore important. Table 1 highlights some disability statistics from 2001.
Table 1: Adults Reporting Mobility Difficulty in 2001 (Iezzoni, 2003)
Difficulty* Estimated Number (millions) Percentage
None 168.32 90 Minor 7.93 4 Moderate 5.23 3 Major 5.82 3 TOTAL REPORTING DIFFICULTY 18.98 10
*None = persons who report no difficulty with walking and climbing stairs and standing and use no mobility aid; minor = persons who report some difficulty with walking or climbing stairs or standing or who use a cane or crutches; moderate = persons who report a lot of difficulty with walking or climbing stairs or standing or who use a walker; major = persons who report being unable to perform walking or climbing stairs or standing or who use a manual or power wheelchair or scooter
Of the many types of physical disabilities, walking disability is one of the most crippling and is therefore the focus of this research. Walking disability can come about through a variety of causes, some of which are summarized in Table 2. A key issue in addressing walking
disability is how to best quantify and measure locomotion disability. This issue remains
unresolved, as no definitive theories of walking have been accepted. Further, technologies such as powered orthoses and functional electrical stimulators are being introduced to address
locomotion disability, yet these technologies are expensive and of unclear efficacy. The ability to assess, diagnose, and measure the effectiveness of new therapies to address walking disability is critical, both from a science perspective and from a health policy perspective.
Table 2: Common Causes of Mobility Difficulties (Iezzoni, 2003)
Mobility Difficulty (%)
Causes Minor Moderate Major
Arthritis and musculoskeletal problems 25 26 24 Intervertebral disk and other back problems and sciatica 14 16 8
Accidental falls 6 7 6
Ischemic heart disease and other heart conditions 5 5 6 Motor vehicle traffic accidents 4 5 4 Chronic bronchitis, emphysema, asthma, and other lung
conditions
4 4 4
Cerebrovascular disease, including stroke 1 2 5 Overexertion and strenuous movements 2 3 1
Unspecified accidents 2 2 1
Machinery, firearm, and other specified accidents 1 2 2 Osteoporosis and bone or cartilage disorders 1 1 2
Diabetes 1 1 1
Multiple sclerosis < 1 < 1 2
1.4 Definitions
This section defines the major terms used in this document.
1. Physical Disability: an impairment that prevents one from performing functions of daily living
that healthy people can perform.
This definition is based on the World Health Organization’s (WHO) International
Classification of Functioning, Disability, and Health (ICF), which defines disability as an “umbrella term for impairments, activity limitations or participation restrictions,”
categorizing “a person’s functioning and disability…as a dynamic interaction between health conditions (disease, disorders, injuries, traumas, etc.) and contextual factors.” (Iezzoni & O'Day, 2006).
2. Gait Analysis: a diagnostic method that records human body kinematics and dynamics during
some sort of gait movement, where gait implies that the body is supported on the legs. Kinematics refers to the motion of objects without consideration of the forces that cause that motion, while dynamics is concerned with forces as well as properties of the moving bodies, such as their masses and inertias. The focus is on whole-body movements, such as limbs, torso, and head, rather than smaller bodies such as cells or even fingers. Additionally, muscle EMG signals may be recorded as well.
This definition follows that of Rose (1983), who suggested that the term “gait
assessment” be applied to the whole process of examining a patient’s gait and suggesting treatment, while the term “gait analysis” be used for the technical side of gait assessment, which includes making objective measurements such as walking speed, joint angles, forces, and EMG muscle recordings (Whittle, 1996). This thesis focuses on gait analysis and its application to gait assessment as a clinical diagnostic.
3. Movement Analysis: measurement and analysis of the body as a whole. Thus, gait analysis is a
subset of motion analysis.
4. Forward Dynamic Simulations: computer models that simulate movement of physical objects
by numerically integrating dynamic equations of motion in time, subject to gravity, inertial and velocity-dependent forces, and muscle forces. In forward dynamic simulations, forces produce motions, whereas traditional analysis of gait data involves inverse dynamic analysis, where experimentally measured ground forces and torques are cascaded through rigid body linkages representing the body segments in order to estimate joint torques (Piazza, 2006).
5. Body Segment Inertial Parameters (BSIPs): the mass, center of mass location, and moments
of inertia of human body segments.
6. Gait Cycle: the time required for a leg to undergo both a stance and a swing phase. This is typically the time axis presented in gait analysis result plots.
1.5 Overview of the Following Chapters
Part I encompasses chapters 2 through 5. Chapter 2 presents background on gait analysis and health policies related to gait analysis. Chapter 3 presents our technology analysis to answer key question one. Chapter 4 presents the case studies of MRI and CT Angiography, while Chapter 5 analyzes data standards in gait analysis and presents policy conclusions.
Part II encompasses chapters 6 through 8. Chapter 6 reviews the biomechanics of human walking, while Chapter 7 presents our research methodology in detail. Finally, Chapter 8
PART I: Public Policies for Advancing Gait Analysis
As explained in Section 1.1.1, Part I addresses how public policies can advance gait analysis. Specifically, this part aims to answer the following three key questions:
• Is the technology required for clinical gait analysis different from that required for commercial applications of motion capture and analysis? If so, how, and what role do regulatory requirements play in effecting technology transfer into the medical field for gait analysis?
• How does gait analysis compare to imaging—a widely-used (and therefore, in our view, successful) clinical diagnostic—in terms of its political, economical, and social structure, and what lessons can be learned from examining the medical imaging field’s development?
• What is the state of data standards in gait analysis, and how might policies address the deficiencies?
These three questions cover a range of technology, social science, and standards issues central to the advancement of gait analysis as an accepted clinical diagnostic. After answering these
questions, we provide recommendations on whether and how public policies can advance clinical gait analysis. The hypothesis, scope, and methodology of Part I are summarized below in the next sections
Hypothesis
A key issue in health policy is whether appropriate medical technologies will be developed by industry alone. In other words, do appropriate incentives exist without additional federal encouragement, or must government create incentives for development of appropriate technologies through such means as university research? This question is significant for gait analysis because many of its technologies have applications in other markets such as
entertainment, engineering, and sports, and therefore the market may already pursue appropriate technological advancements without public funding.
For gait analysis, we hypothesize that the desired technologies can be developed through commercial markets without significant publicly funded development of these technologies and that policies should instead focus on fostering the professional institutions and data standards required for clinical gait analysis to become a practical diagnostic tool.
Scope
This research focuses only on public policies for the U.S. healthcare environment. By public policies, we mean policies enacted at the federal level, such as Medicare reimbursement decisions, statutes, and research funding initiatives. In other countries—especially those with national healthcare systems— medical regulations and reimbursement policies are different,
which means our analysis and recommendations may not be applicable. Further, we focus only on lab-based gait analysis as a diagnostic tool. Some research has focused on using wearable sensors for mobile gait analysis (e.g., (Bonato, 2005)), but these technologies are still developing and policies regarding mobile health devices are still emerging, even for standard measurements such as blood pressure (Olson, 2008). We believe that general acceptance of gait analysis as a lab-based tool must emerge prior to its use in mobile or home-based diagnostic devices, and therefore focus only on the former. Finally, although this study focuses on gait analysis, our conclusions will likely be generalizable to advancing clinical movement analysis as a whole.
Methodology
The methodologies used to answer the three questions are as follows. The first question is answered through an analysis of the technologies used in gait analysis and related applications. The second question is answered through case studies of medical imaging—which, like gait analysis, is a multidimensional diagnostic that relies heavily on operator interpretation of results— to glean insights into relevant policy issues for gait analysis. Specifically, we analyze the cases of MRI and CT Angiography, for reasons to be detailed in Chapter 4. The third question is answered by performing a high-level analysis of standards used to store and
communicate gait analysis data and comparing them to DICOM, the standard used for medical images.
Conclusions
Part I concludes that policies cannot directly create the professional institutional structures and the data standards required to advance gait analysis as a clinical diagnostic tool. Only through indirect means, such as research funding, can policies support the development of organizations to take ownership of gait analysis and its data standards. Part I also concludes that policies should not fund development of gait technologies, but rather should fund research units working on data standards and accurate human body models.
Overview of Proceeding Chapters in Part I
Chapter 2 presents background on gait analysis and health policies related to gait analysis. Chapter 3 presents our technology analysis to answer key question one. Chapter 4 presents the case studies of MRI and CT Angiography, while Chapter 5 analyzes data standards in gait analysis and concludes with overall policy recommendations.
2
Gait Analysis and Related Policies
This chapter is divided into two sections. Section 1 presents an overview of the
regulatory, reimbursement, and policy issues relevant to clinical diagnostic technologies. Section 2 then presents a brief history of modern gait analysis and explains its medical potential.
2.1 Health Technology Policy
This section provides an overview of why government intervention is often required to promote and develop medical technologies, the U.S. regulatory environment for diagnostics, how reimbursement decisions for diagnostics are made, and the evidence-based medicine approach.
2.1.1 Rationale for Government Intervention
It may first be helpful to define why public policies are needed regarding medical technologies. One reason is because the medical industry differs from most other industries in two ways: (1) providers rather than purchasers or beneficiaries generally determine the services provided, and (2) health providers are generally reimbursed for services by third parties rather than beneficiaries. The health care market therefore does not fulfill the criteria of efficient markets, which means we may require government intervention to protect the public welfare and to promote effective use of healthcare and related technologies (Hillman, 1986).
2.1.2 Regulation of Diagnostic Technologies
Any device advertised for use in medical applications must be approved by the U.S. Food and Drug Administration (FDA), which regulates medical devices according to the Food, Drug and Cosmetic Act (FD&C). Specifically, gait analysis systems to be used for diagnostic purposes are considered medical devices according to section 201(h) of the FD&C, which defines a medical device as any device “intended for the use in the diagnosis of disease or other conditions, or in the cure, mitigation, treatment, or prevention of disease, in man or other animals” (21 U.S.C. § 321 (2004)).
Medical devices are classified into three classes that determine regulatory scrutiny. Section 513 (21 U.S.C. § 360c (2004)) of the FD&C Act divides them as follows:
• Class I devices: these devices do not require pre-market approval or clearance and are considered the safest. They therefore have the least controls, i.e., the FDA’s “general controls.” Ground force plates are considered Class I devices (21CFR890.1575 (2007)).
• Class II devices: These devices require “special controls,” such as performance standards, post-market surveillance, and dissemination of guidelines. Many diagnostic tests are considered class II devices. These devices are cleared using the 510K process, which is discussed below.
• Class III devices: These devices require pre-market approval because general and special controls are not satisfactory to ensure their safety or effectiveness. They include devices used to support human life, such as pacemakers.
Further, section 510(k) of the FD&C Act requires device manufacturers to notify the FDA at least 90 days in advance of their intent to market a medical device (21 U.S.C. § 360 (2004)). This allows the FDA to determine whether the device is equivalent to a device it has already classified. 510(k) is known as the “pre-market notification,” and is meant to ensure that the device to be marketed is “at least as safe and effective” as a “legally marketed device” (U.S. Food and Drug Administration, 2006). Devices cleared through the 510(k) process are not considered approved by the FDA but are considered “cleared” devices and can be marketed in the U.S.
2.1.3 Reimbursement
After the FDA approves a medical technology, insurers such as Medicare decide on coverage. Private insurers make their own coverage decisions but often follow the lead of Medicare.
Medicare is a social insurance program for people age 65 and over administered by the Centers for Medicare and Medicaid Services (CMS). It is grounded in the Social Security Act. Section 1862(a)(1)(A) of the Social Security Act states that Medicare explicitly covers only diagnostics that are “reasonable and necessary for the prevention of illness” (42 U.S.C. § 1395y (2008)). However, no statutory definition of this phrase is provided, leading to vigorous debates about specific technologies (Redberg, 2007).
Private insurers decide what to insure in two stages: (1) what services are covered by particular plans, and (2) case-by-case decisions about the “medical necessity” of covered
services. Coverage generally follows the precedents set by Medicare, making Medicare coverage the key step in gaining private insurance coverage.
There are no established protocols for deciding coverage, both at the Medicare and at the private insurance level. Although Medicare espouses evidence-based approaches (discussed in the next section) for making coverage decisions, it does not always follow them. Berensen and Abelson write that “inadequate study is especially serious for medical devices and imaging equipment,” and that once a procedure gains FDA approval, “Medicare rarely demands evidence that it benefits patients before agreeing to pay for it” (Berenson & Abelson, 2008). Iezzoni & Day emphasize that coverage standards are subjective, and the lack of data supporting
effectiveness of many procedures allows insurers and Medicare to deny coverage easily (Iezzoni & O'Day, 2005). And unlike pharmaceuticals, which undergo periodic review by the FDA after approval, few systematic criteria are applied to ensure patient benefit in the case of medical devices after formal requirements for FDA approval and insurance coverage are met (Redberg, 2007)
2.1.4 Evidence-based medicine
Rising costs in medicine have prompted policymakers, insurers, and some physicians to advocate evidence-based medicine. The most common definition from Sackett states that EBM is "the conscientious, explicit and judicious use of current best evidence in making decisions about the care of the individual patient. It means integrating individual clinical expertise with the best available external clinical evidence from systematic research." (Sackett, 1996).
The movement towards evidence-based medicine became widely accepted in the 1990s. Areas of EBM include coverage policies, performance measures, disease management, quality improvement, regulations, and public policies. All these areas share four common features: (1) analysis of evidence and development of guidelines and policies is done by small groups of experts, (2) they all use explicit, rigorous review processes, (3) the product is generic, meaning the guidelines are intended to apply to a class or group of patients defined by some clinical criteria, rather than to an individual patient, and (4) their effects on care are indirect, i.e., they are intended to enable, guide, motivate, or sometimes force physicians and other providers to deliver certain types of care to people, but they do not directly determine the care provided to a
particular patient (Eddy, 2005).
Associated with the movement toward evidence-based medicine is the movement to evaluate cost-effectiveness of medical procedures by bodies such as Medicare.
Cost-effectiveness analysis aims to evaluate health outcomes and costs of different procedures relative to one another so that decision makers can select the “best” alternative. However, it neglects many factors that may be equally or more important in making funding and reimbursement policy decisions, such as justice, equity, and costs and benefits outside the health care system (Gazelle et al., 2005).
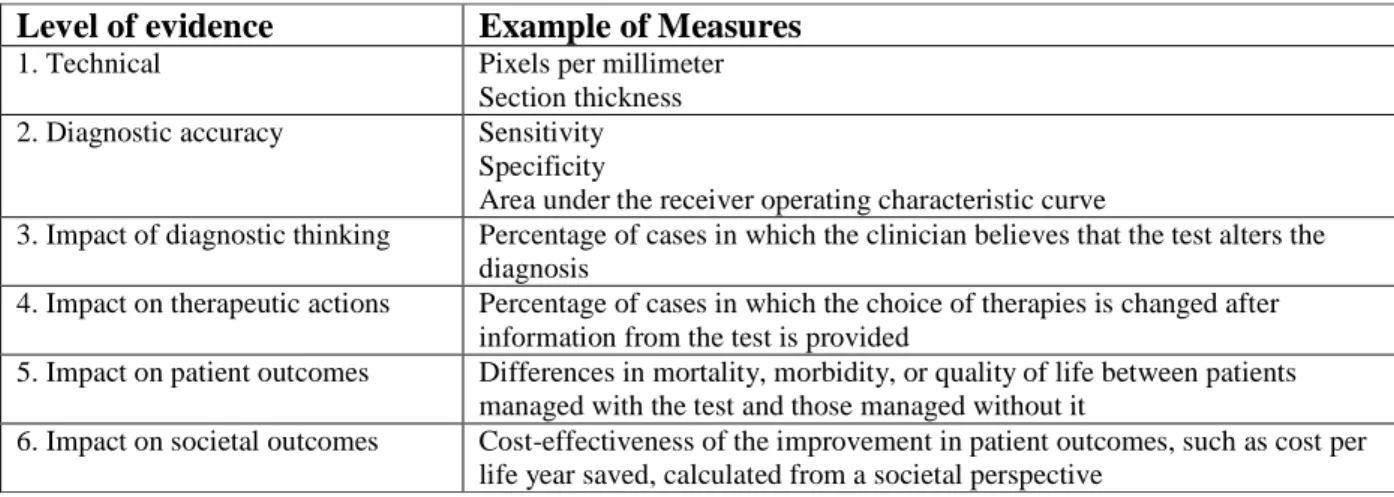
Evidence-based medicine involves analysis of many levels of effectiveness, from technical accuracy to impact on societal health outcomes. An example of the many levels of evidence for medical imaging diagnostics and specific metrics by which each may be measured is presented in Table 3.
Table 3: Levels of Evidence in Evaluations of Diagnostic Technologies, with examples taken from the medical imaging field (Pearson et al., 2008)
Level of evidence Example of Measures
1. Technical Pixels per millimeter Section thickness 2. Diagnostic accuracy Sensitivity
Specificity
Area under the receiver operating characteristic curve
3. Impact of diagnostic thinking Percentage of cases in which the clinician believes that the test alters the diagnosis
4. Impact on therapeutic actions Percentage of cases in which the choice of therapies is changed after information from the test is provided
5. Impact on patient outcomes Differences in mortality, morbidity, or quality of life between patients managed with the test and those managed without it
6. Impact on societal outcomes Cost-effectiveness of the improvement in patient outcomes, such as cost per life year saved, calculated from a societal perspective
2.2 Gait Analysis Overview
This section summarizes the potential of gait analysis as a diagnostic tool for
musculoskeletal disorders, the modern history of gait analysis, and the process and economics of gait analysis.
2.2.1 Diagnostic Potential
Technologies for gait analysis measure the dynamics (forces) and kinematics (motion) of movement, providing a quantitative basis by which to analyze and diagnose movement disorders. Advantages of gait analysis over unaided clinical observation include identifying problems at multiple levels, identifying dynamic movement patterns not evident otherwise, and comparing range of motion curves of normal ranges to tested subjects (Finch, 2001).
Gait analysis has potential as a diagnostic tool for assessing the severity of pathology, predicting better treatments, and assessing the effects of interventions. It has been used and studied most extensively on altering treatment procedures in cerebral palsy (CP) patients. Accordingly, many (but not all) insurers cover its application to CP. Gait analysis supplemented with EMG recordings is particularly useful for determining which muscles are activated during poor gait, which can inform surgical procedures. Research also suggests that gait analysis holds potential for diagnosing multiple joint diseases such as osteoarthritis, anterior cruciate ligament (ACL) rupture in the knee, hemiplegia, and muscular dystrophy (Whittle, 2002).
2.2.2 History of Modern Gait Analysis
The history of modern gait analysis systems can be traced to the late 1970s and early 1980s. During the late 1970s, gait analysis was introduced into clinical settings largely due to the efforts of four orthopedic surgeons: Jaquelin Perry, David Sutherland, and Jim Gage in the U.S., and Gordon Rose, in the UK (Whittle, 1996).
Sutherland provides a published personal account of the historical development of and applications of gait analysis technologies, which we briefly summarize below. More detailed information about each technology is presented in Chapter 3.
2.2.2.1 Motion Capture
Much work in the 1950s focused on recording joint angles using electrogoniometers because such systems could collect information quickly and analog graphs of motion could be displayed without extensive data processing. These were important features since powerful computers were unavailable. The introduction of the Vanguard Motion Analyzer in the 1960s brought forth film-based techniques using passive marker systems. This system used high-speed cameras to track markers in space, but manual calculations were needed to convert image data into coordinate data. Research work during the 1960s and 1970s focused on automating this process of acquiring marker coordinates from images. During the late 1970s, a technical director at Oxford Medical Systems—a company focusing mainly on cardiology products—thought that a commercial market for an automatic 3D gait analysis system existed. Oxford Medical Systems therefore licensed technologies from the Universities of Strathclyde and Dundee and spent two
years developing a system called VICON, whose name was derived from “video-converter.” The first VICON system was shipped in 1980.
Although the VICON system was effective for extracting 2D coordinate data, its software could not calculate 3D coordinates. Michael Whittle, who had worked with NASA to make 3D measurements of astronaut body forms in a Skylab experiment, became the director of the Oxford University Motion Laboratory after its former director left to found Oxford Metrics, a spin-off of Oxford Medical Systems focusing on the VICON system. To fulfill his research needs, Whittle likely wrote the 3D motion capture software. After Oxford Metrics, Motion Analysis Corporation was the next major motion-capture company to emerge. After Motion Analysis came Bioengineering Technology Systems (BTS), which was founded in Milan, Italy, in 1986. BTS developed the ELITE motion capture system (Sutherland, 2002).
The advent of MEMS (microelectromechanical systems) sensors in the late 1990s reduced the price, size, and power consumption of traditional sensors while improving their accuracy. This led to increased attention on using wearable sensors for motion capture applications. Several companies have emerged marketing such motion capture suits.
Additionally, Organic Motion presented the first commercial markerless motion capture system in 2007, although the accuracy is still inadequate for biomechanical applications (Bonato, 2009). 2.2.2.2 Kinesiological EMG
EMG (electromyography) systems measure the electrical activity of muscles to provide information about muscle excitations. These can involve surface (non-invasive) EMG, or fine-wire (invasive) EMG. Most of the developments in EMG technology and application occurred prior to the 1980s. (Sutherland, 2001).
2.2.2.3 Ground Force Measurement
In the mid-1960s, Sutherland requested the development of a force plate for the Shriners Hospital San Francisco Gait Laboratory because no commercial force places existed. The lab hired engineers to produce a clinically useful force plate, which appeared in 1975. Similarly, other gait labs contracted to have custom force plates built as well. Several years later, the Kistler Corporation, a respected Swiss company, produced a commercial model. This was followed by those of other companies, such as Advanced Mechanical Technology, Inc. (AMTI) and Bertec, ushering in the market a variety of reliable, commercially available force plates (Sutherland, 2005).
2.2.3 Gait Analysis Process
Gait analysis consists of three main steps: taking a patient’s history, performing a physical examination, and performing “special investigations,” such as X-rays or oxygen
consumption analysis. A gait analysis team generally consists of a physician, a physical therapist, and a biomedical engineer, though different centers may have different team sizes and team members with different skills (Simon, 2004; Whittle, 1996). Only the physical therapist and engineer are required to conduct the study, with the physician performing the initial clinical examination and assisting in interpreting results (Bonato, 2009).
Referrals to gait labs are often made by patients’ physicians, though physical therapists might do so in some cases as well. These physicians are generally orthopedic surgeons. The
patient stays at the gait lab for 2-3 hours, and her stay there consists of the physician taking a patient history, then performing various gait analysis tests (Whittle, 1996).
Specifically, taking the history and performing the clinical exam of a patient requires 20-30 minutes, placing markers on the subject and calibrating devices for motion detection and muscle activity monitoring takes 30-60 minutes, and testing itself lasts 5-30min depending on the number of conditions examined. Post-processing the data then takes additional time. While gait analysis results can be processed and returned quickly by computers, they must still be read and interpreted by humans. Gait reports can number in the hundreds of pages, and in contrast to medical images, they are not presented as appealing 3D images. Instead, reports are a jumble of plots and figures that require much technical expertise to understand. Simon and many others propose that computer assisted gait data analysis and report generation can address this issue, though such methods still have not been developed (Simon, 2004).
As a point of comparison, the Motion Analysis Laboratory at Spaulding Rehabilitation Hospital in Boston takes about 2 hours to perform a gait study and can test up to three child subjects a day (Bonato, 2009).
2.2.4 Coverage
Controversy over gait analysis’s clinical relevance is reflected in most U.S. private insurance policies, such as those of Blue Cross & Blue Shield and Aetna, which regard it as “research” and therefore not reimbursable (Aetna, 2008; Blue Cross & Blue Shield of
Mississippi, 2008). This suggests that more efficacy studies are needed before gait analysis will be covered as a normal diagnostic procedure.
However, gait analysis is sometimes covered for cerebral palsy applications. Children with cerebral palsy are treated with a variety of medications, physical therapy sessions, bracing, assistive devices, and orthopedic or neurosurgical procedures to prevent deformity and improve mobility. While in the past many orthopedic procedures were performed at separate times, today physicians attempt to perform multiple procedures in one surgical session. Gait analysis provides greater confidence over clinical examination that proper surgical procedures will be chosen, has been shown in various research studies (Simon, 2004).
2.2.5 Economics
3D gait analysis typically ranges from $600 to $1000, although it can cost up to $2,000. The average reimbursement is $500 or less. (Roan, 2007; Simon, 2004; Stanford School of Medicine Human Performance Lab, 2008). Despite these costs to patients, Simon (2004) writes that in the U.S. it is rare for a gait lab to have revenue balance expenses. He cites the main reason being the time and expense of performing gait studies. Specifically, establishing a gait lab
requires purchasing equipment that averages around $300,000, excluding facility renovations and rental cost of the lab space. Maintenance contracts for hardware and software add another
$30,000 to $50,000 a year. Full-time lab personnel consist of a bioengineer, a physical therapist, and a secretary receptionist, for whom salary and benefits add up to about $250,000 annually. To balance expenses, a gait lab would have to perform at least 15 studies a week for 50 weeks at $500 per study, or $375,000 in revenue. Since, as mentioned earlier, each test takes about three to four hours, few labs are capable of testing 600 subjects per year (Simon, 2004).
2.2.6 Criticisms of Gait Analysis
This section highlights the main criticisms directed at gait analysis regarding why gait analysis is not widely used by clinicians or eligible for reimbursement. These are the issues we will focus on when performing analyses.
Little literature exists that attempts to analyze the non-technical issues hindering clinical gait-analysis. Simon (2004) analyzed some institutional issues that have hampered gait analysis’s advancement in the clinic. However, he proposes largely technological or organizational fixes to the problems, without delving into whether or how public policies can address these. For
example, to speed up gait analysis testing time, he proposes replacing skilled the professionals who currently perform the tests (i.e., biomedical engineers and physical therapists) with technicians such as those used in radiology. He also suggests that markerless motion analysis systems can reduce patient preparation time. Regarding the complex reports, he suggests using machine learning algorithms to analyze the data and provide recommendations—a situation that still appears far in the future, as such techniques are rare even in medical imaging. Finally, he also suggests creating integrated databases and networks to link gait labs with referring clinicians.
In 1995, the National Center for Medical Rehabilitation Research (NCMRR) within the National Institutes of Health (NIH) sponsored a workshop to develop and prioritize a set of recommendations regarding the role of gait analysis in enhancing the function of people with locomotor disabilities. The workshop resulted in 37 prioritized recommendations. However, little was done in the proceeding decade. From 2004-2008, the research committee of the Gait & Clinical Movement Analysis Society (GCMAS), a professional organization interested in human movement, convened to revise the recommendations in light of new developments. The members reevaluated and prioritized the eight main objectives to be achieved. Based on Simon (2004) and the NIH/GCMAS recommendations, this research synthesizes the main criticisms of gait
analysis.
The first major criticism involves proving the diagnostic effectiveness of gait. Specifically, interpretation of data varies from clinician to clinician and from institution to institution (Simon, 2004). This is exacerbated by many physicians’ and therapists’ lack of understanding about gait analysis’ capabilities, benefits, and limitations. Lack of efficacy data showing that functional outcomes are improved due to gait analysis contributes to this. Also, the act of processing raw data and transforming it into data valuable to the gait analyst may lead to errors, since few studies analyze these artifacts. Finally, because of these issues, the
cost-effectiveness of gait analysis as a clinical tool cannot be established (Gait & Clinical Movement Analysis Society, 2008).
The next criticism focuses on gait analysis economics. Gait labs are economically inefficient, largely due to their personnel costs and the time it takes to perform a gait study (Simon, 2004). This is exacerbated by the fact that gait labs may lack the business structures needed to promote and sustain the field (Gait & Clinical Movement Analysis Society, 2008).
Related to cost and effectiveness, another criticism is that gait analysis provides
insufficient advantages over simpler methods to justify the costs. Physicians must be convinced that it offers significant advantages over questionnaires, observation of gait with the naked eye, and 2D video recordings. Historically, most orthopedic surgeons and rehabilitation specialists relied on static examinations and observational gait analysis, with questionnaires being added in recent years. Cultural and institutional barriers therefore exist in converting these professionals to accept clinical gait analysis (Gait & Clinical Movement Analysis Society, 2008).
Others also criticize gait analysis as not being representative of real-world conditions, since it is limited to testing in controlled lab environments, such as walking through an empty room or moving on a treadmill. Such critics are often researchers working on mobile gait analysis systems (Bonato, 2005)
Also, gait analysis data are difficult to share. This is due to differences in methods used by different labs, and little work has focused on developing procedures for sharing (Gait & Clinical Movement Analysis Society, 2008). Related to this problem is the lack of standards for testing inter-laboratory reliability, which means there are no processes to certify that a gait lab meets some accepted standard for accuracy (Sutherland, 2002).
Finally, there is a lack of cohesion within the field. This makes it hard to advance its standing “within business markets and political arenas.” (Gait & Clinical Movement Analysis Society, 2008).
These criticisms are summarized in Table 4, along with the method we use to analyze the issues regarding each of them.
Table 4: Main criticisms of gait analysis
Criticism Specific issues Method used to gain insight into issues
Clinical effectiveness
• Interpretation of data varies from lab to lab and clinician to clinician
• Physicians and therapists don’t understand the capabilities, benefits, and limitations of gait analysis
• Lack of efficacy data showing that functional outcomes are improved directly due to gait analysis
• Processing and transforming raw data to data valuable to gait analyst may lead to errors
Case study of MRI/CTA
Cost-effectiveness • Gait labs are economically inefficient
• Gait labs lack business structures needed to promote and sustain the field
Case study of MRI/CTA
Provides few advantages over simpler methods
• Gait analysis must offer significant advantages over questionnaires or observational gait analysis, which historical bias causes physicians to stick to
Case study of MRI/CTA
Complex results are hard to interpret
• Gait reports consist of “too many pages of text, graphs, and figures in a format not easily understood or useful to the average
clinician.”
Case study of MRI/CTA
Lab conditions are not representative of real-world conditions
• Gait tests may not accurately represent how clinical
interventions affect patients’ lives
Not addressed in this research
Heterogeneous data standards
• Gait/motion analysis data are difficult to share
• Different labs use different protocols, systems, and data processing methods
Analysis of Protocols and Standards in gait analysis and DICOM
Lack of cohesion within the field
• Lack of professional cohesion within the field.
Case study of MRI/CTA
The next chapter analyzes the technologies used in gait analysis to determine whether and how commercial markets address the technology advancements needed for clinical gait analysis.
3
Gait Analysis Technology Transferability
As mentioned in Chapter 2, one reason that advancement of gait analysis into clinical applications is stalled might be because appropriate technologies are not being developed by private industry without policies to drive their development for clinical applications. Therefore, one question we aim to answer is whether and how the technology required for clinical gait analysis differs from that desired in related commercial applications. This would determine whether public policies are required to develop such technologies specifically for clinical gait use.
To answer this question, this chapter analyzes the technologies used in clinical gait analysis and that used in other similar applications. Many of the companies that produce gait analysis systems also produce motion capture systems for other commercial markets (sports, entertainment, etc.), and much of the technology is similar. This chapter then analyzes how directly transferable the commercial technology is to the medical field and whether high regulatory barriers exist.
3.1 Gait Analysis Technologies
As mentioned in Chapter 2, gait analysis involves acquiring quantitative measurements of human body kinematics and dynamics during gait movement. Two separate measurement
devices are used for this: a motion capture device for measuring kinematics, and a force measurement device for measuring dynamics. EMG sensors are also sometimes used to record muscle activity.
The most widely used gait analysis system combines an optical (camera-based) marker system with force plates (Figure 2), which is interfaced to a computer for data processing. However, a variety of other setups are used as well.
3.1.1 Motion Capture Technologies
A variety of motion capture technologies exist for use in recording movement kinematics. These include magnetic systems, mechanical systems, optical systems, and sensor-based
systems.
3.1.1.1 Magnetic Systems
These systems locate position and orientation of sensors in space using a magnetic field, offering good accuracy and update rates. Each sensor contains three orthogonal sets of coils, which allows the sensor to be located when the transmitter produces an electromagnetic field of three frequencies inside the test space. A downside of magnetic motion capture systems is their sensitivity to magnetic objects inside the tracking space. One example of such systems is Ascension Technology’s MotionStar, shown in Figure 3. Magnetic systems range in cost from about $5,000 to $150,000 (Ruiz, 2002).
Figure 3: Ascension Technology’s MotionStar magnetic motion capture system (Ascension Technology, 2009)
3.1.1.2 Mechanical Systems
Mechanical motion capture systems are comprised of electrogoniometers, which are hinges strapped at joints that record joint angles. A potentiometer or some other transducer transforms joint rotations into electrical signals. Although the hardware used in mechanical systems are cheaper than in other systems, mechanical systems are often heavy and restrictive. Potentiometers also degrade in performance with age. Mechanical systems generally cost between $5,000 and $10,000. An example of such a system is Meta Motion’s Gypsy exoskeleton-based system, shown in Figure 4.
Figure 4: Meta Motion’s Gypsy mechanical motion capture system
3.1.1.3 Image-based systems
Optical systems include those that track passive or active (e.g., LED-lit) markers in video frames, as well as markerless systems.
Marker-based systems
Marker-based systems were developed to automate motion capture. Such systems track passive reflective markers or active light-emitting diodes (LEDs) on the body and determine the 3D marker locations using triangulation methods from multiple cameras (generally 4 to 32) around the subject. They are favored in the computer animation and film industries because of their high accuracy and fast update rates (Vlasic et al., 2007); however, they are also expensive, typically costing between $100,000 and $250,000 (Ruiz, 2002). Additionally, they can run into problems if the markers are occluded from view.
The location of markers in world coordinates is generally determined by finding the centroid of each marker in each camera frame. From these 2D locations, the positions of the cameras are then factored in to triangulate each marker’s location in 3D space. Major manufacturers of such systems include Vicon and Motion Analysis Corporation.
Markerless systems
Markerless systems have been the holy grail of optical motion capture technology since marker-based systems were introduced. This is due to the time-intensive nature of marker-based systems as well as their accuracy problems in locating joints due to skin marker movement. The first commercial system by Organic Motion was introduced at SIGGRAPH in 2007, which featured real-time rapid calibration and extraction (Figure 5). Although technical specifications and reviews have not been provided of the technology, a clear restriction available from publicity videos is that a specialized curtained stage must be used to ensure clear contrast between subject and background. Organic Motion’s system costs $80,000. The Motion Analysis Lab at Spaulding Rehabilitation Hospital has been working with Organic Motion on gait analysis applications of the system, but it is still not accurate enough for biomechanical applications (Bonato, 2009).
Figure 5: Markerless motion capture system (Organic Motion)
3.1.1.4 Inertial Motion Capture Systems
Such systems were sparked by the rise of MEMS sensors and involve placing accelerometers or gyroscopes on body suits to measure joint angle rotation. Although such systems are very portable and relatively cheap—on the order of $25,000 to $80,000—they do not measure positions and distances directly and measurements drift significantly over several minutes because the noisy measurements must be integrated twice to provide position data (Vlasic et al., 2007). These systems perform especially poor for fast, high acceleration movements. An example of such a system is Xsen’s Moven suit, shown in Figure 6.
Figure 6: Xsen’s Moven sensor-based motion capture suit
3.1.1.5 Hybrid Sensor Systems
Such systems use two motion capture systems in tandem to address shortcomings of using each system alone. An example is Hy-BIRD by Ascension Technology, which combines optical and inertial technologies to handle conditions when the image is blocked from view.
3.1.2 Force Measurement Technologies
The two main types of force measurement technologies used are force plates and pressure mapping systems.


![Figure 27: Mean +/- variance for RIGHT LEG HIP ADDUCTION moment normalized by subject’s body mass [3D simulations]](https://thumb-eu.123doks.com/thumbv2/123doknet/13889884.447317/96.892.148.754.668.1022/figure-variance-right-adduction-moment-normalized-subject-simulations.webp)
![Figure 28: Mean +/- variance for RIGHT LEG KNEE FLEXION moment normalized by subject’s body mass, where positive moments represent knee extension [3D simulations] (ovrt.nist.gov)](https://thumb-eu.123doks.com/thumbv2/123doknet/13889884.447317/97.892.144.750.158.488/figure-variance-flexion-normalized-positive-represent-extension-simulations.webp)
