Microstructure Evolution and Optimization of the Tempering
Heat Treatment of a Medium-Carbon Low-Alloy Steel
by
Seyyed Hesamodin TALEBI
MANUSCRIPT-BASED THESIS PRESENTED TO
ÉCOLE DE TECHNOLOGIE SUPÉRIEURE IN PARTIAL FULFILLMENT
FOR A MASTER’S DEGREE WITH THESIS IN MECHANICAL
ENGINEERING
M.A.Sc.
MONTREAL, August 20, 2018
ÉCOLE DE TECHNOLOGIE SUPÉRIEURE UNIVERSITÉ DU QUÉBEC
This Creative Commons licence allows readers to download this work and share it with others as long as the author is credited. The content of this work can’t be modified in any way or used commercially.
BOARD OF EXAMINERS
THIS THESIS HAS BEEN EVALUATED BY THE FOLLOWING BOARD OF EXAMINERS
Prof. Mohammad Jahazi, Thesis Supervisor
Mechanical Engineering Department at École de technologie supérieure
Prof. Vladimir Brailovski, President of the Board of Examiners
Mechanical Engineering Department at École de technologie supérieure
Prof. Vincent Demers, Member of the jury
Mechanical Engineering Department at École de technologie supérieure
THIS THESIS WAS PRESENTED AND DEFENDED
IN THE PRESENCE OF A BOARD OF EXAMINERS AND PUBLIC IN AUGUST 15, 2018
ACKNOWLEDGMENT
The author would like to thank his supervisor, Professor Mohammad Jahazi, for his guidance, support and expertise during the degree, without which none of this would have been possible. It was an excellent opportunity for working with him during this master journey.
Grateful thanks are given to our Industrial Partner, Finkl Steel, for their help in sample preparation, accessing Sorel Forge data base, and their collaboration in this project.
Gratitude is also expressed for all CM2P members for their cooperation during the entire diploma.
ÉVALUATION DE LA MICROSTRUCTURE ET OPTIMISATION DU TRAITEMENT DE REVENU DES ACIERS FAIBLEMENT ALLIÉS
Seyyed HesamodinTalebi
RESUME
Dans ce travail de recherche, l’influence des différents paramètres sur les phénomènes qui se produisent durant le revenu des aciers faiblement alliés, ont été investiguées. Grâce à un dilatomètre à haute résolution, les échantillons ont été refroidis suivant les trois vitesses de refroidissement suivantes 4.8, 18 et 180 °C/min afin de former respectivement la martensite, la matensite-bainite et la bainite. Ces microstructures correspondent à des zones spécifiques dans un lingot forgé de grande taille après trempe.
Par la suite, des cycles de revenus non-isothermes jusqu'à 600 °C ont été réalisés avec différents vitesses de chauffe pour étudier les différents stades du revenu ainsi que les transformations de phases qui y interviennent, notamment la bainite.
Les résultats ont indiqué que le comportement durant du revenu varie de manière remarquable depuis la microstructure primaire, et à travers tous les stades du revenue. En particulier, il a été observé que la décomposition de l'austénite résiduelle et la précipitation des carbures se produit durant le revenu d'une microstructure bainitique.
Ensuite, des revenus isothermes à 350, 550 and 600 °C et différents temps de maintien ont été réalisés afin d’étudier la décomposition de l’austénite résiduelle et l’évolution des carbures durant le revenu d’échantillons bainitiques. Les résultats ont montré que la décomposition complète de l'austénite résiduelle se produit seulement à 600 °C. Même, après 16 h de revenu à 600 °C, les carbures ont tendance à être riche en chrome, les carbures Cr7C3
et Cr23C6 ont surtout été identifié. Une augmentation de la dureté a été observée lors de la
précipitation des carbures, suivi d’une diminution qui indique le début de la croissance des carbures.
Mots clés: Revenu, Bainite, Transformation de phase, Dilatométrie, Austénite résiduelle, Carbures.
Microstructure Evolution and Optimization of the Tempering Heat Treatment of a Medium-Carbon Low-Alloy Steel
Seyyed Hesamodin TALEBI
ABSTRACT
In this research, the effects of processing parameters on different phenomena occurring during tempering of a medium-carbon low-alloy steel were investigated. Conducting high-resolution dilatometry machine, samples were cooled with three cooling rates of 4.8, 18 and 180 °C/min, to produce martensite, martensite mixed with bainite and bainite, respectively. These microstructures correspond to different locations of a large-size forged ingot after quenching.
Subsequently, non-isothermal tempering up to 600 °C with different heating rates was carried out to study various tempering stages and phase transformations occurring during tempering especially for bainite. Results indicated that tempering behaviour differed remarkably with the primary microstructure, and among all the tempering stages, only retained austenite decomposition and carbide precipitation have occurred during tempering of a bainitic microstructure.
Furthermore, isothermal tempering for three temperatures of 350, 550 and 600 °C with different holding times up to 16 h was performed to study retained austenite decomposition and carbides evolution during tempering of a bainitic specimen containing retained austenite. Results showed that full decomposition of retained austenite occurred only at 600 °C. Also, after 16 h of tempering at 600 °C, carbides tend to be rich in chromium and mostly Cr7C3 and
Cr23C6 carbides were identified. Hardness increase was observed during carbides
precipitation, while it decreased when carbide coarsening started.
Keywords: Tempering, Bainite, Phase transformation, Dilatometry, Retained austenite, Carbides.
TABLE OF CONTENTS
Page
INTRODUCTION ...1
CHAPTER 1 LITERATURE REVIEW ...3
1.1 Medium-Carbon Low-Alloy Steels ...3
1.1.1 AISI P20... 3
1.2 Phase transformations ...4
1.2.1 Austenite to Pearlite ... 4
1.2.2 Austenite to Martensite ... 6
1.2.3 Austenite to Bainite... 6
1.3 Effect of Alloying Elements ...6
1.3.1 Effect of Alloying Elements on Phase Transformation ... 7
1.3.2 Effect of Alloying Elements on Mechanical Properties ... 8
1.4 Bainitic Transformation ...10
1.4.1 Mechanisms of Bainite Formation ... 11
1.4.2 Definition of T0 Curve... 13
1.4.3 Morphology of Bainite ... 15
1.4.4 Effects of Alloying Elements on Bainite Start Temperature ... 17
1.5 Tempering of Bainite ...18
1.5.1 Hollomon – Jaffe Parameter ... 20
1.5.2 Precipitation of Transition Carbides ... 21
1.5.3 Retained Austenite Decomposition During Tempering ... 22
1.5.4 Double Tempering of Steels ... 23
1.5.5 Precipitation of Carbides During Tempering ... 23
1.5.5.1 Tempering of Bainite Containing Vanadium ... 24
1.5.5.2 Tempering of Bainite Containing Chromium ... 24
1.5.5.3 Tempering of Bainite Containing Molybdenum ... 25
1.5.7 Secondary Hardening ... 27
1.5.8 Effects of Tempering on Mechanical Properties ... 28
1.6 Summary ...29
CHAPTER 2 INFLUENCE OF STARTING MICROSTRUCTURE ON DILATATION BEHAVIOR DURING TEMPERING OF A HIGH STRENGTH STEEL ...31
2.1 Introduction ...32
2.2 Materials and methods ...33
2.3 Results and Discussion ...33
2.3.1 Cooling dilatometric curves ... 33
2.3.2 Tempering dilatometric curves ... 35
2.3.3 Length changes during tempering ... 36
2.3.4 Microstructure evolution ... 37
2.4 Summary ...40
CHAPTER 3 IN SITU STUDY OF PHASE TRANSFORMATION DURING NON-ISOTHERMAL TEMPERING OF BAINITIC AND MARTENSITIC MICROSTRUCTURES ...41
3.1 Introduction ...42
3.2 Materials and Methods ...44
3.3 Results and Discussion ...47
3.3.1 Segregation and Clustering of Carbon Atoms ... 50
3.3.2 Precipitation of the ε/η Transition Carbides ... 52
3.3.3 Retained Austenite Decomposition ... 53
3.3.4 Cementite Precipitation ... 55
3.3.5 Microstructural Evolution during Tempering ... 58
3.4 Conclusions ...61
CHAPTER 4 RETAINED AUSTENITE DECOMPOSITION AND CARBIDES IDENTIFICATION DURING ISOTHERMAL TEMPERING OF A MEDIUM-CARBON LOW-ALLOY BAINITIC STEEL ...63
4.2 Materials and Methods ...65
4.3 Results and Discussion ...67
4.3.1 Retained austenite decomposition... 67
4.3.2 Product of retained austenite decomposition ... 71
4.3.3 Carbides precipitation and hardness evolution ... 72
4.3.4 Characterization and identification of carbides ... 74
4.4 Conclusions ...79
CHAPTER 5 Optimization of Industrial Tempering Heat Treatment Process ...81
5.1 Introduction ...81
5.2 Tempering temperature ...82
5.3 Tempering time ...82
5.3.1 Non-isothermal tempering time of a large-size slab ... 83
5.3.2 Isothermal tempering time of a large-size slab ... 84
5.4 Proposed tempering cycle ...85
CONCLUSIONS ...87
RECOMMENDATIONS ...89
LIST OF TABLES
Page Table 1-1 Chemical Composition of AISI P20 (wt.%) (A.M. Bayer, 1990) ...4 Table 1-2 Alloying elements impact on steel phase transformation. ...8 Table 1-3 Different tempering stages and their temperatures in martensite based
on 1-hour treatment (Dhua, Ray, & Sarma, 2001) ...18 Table 2-1 Total length change during tempering from 25 °C to 600 °C and
specific length change due to tempering phenomena ...37 Table 3-1 Lattice parameters and carbon contents of the as-received
microstructure, bainitic ferrite, and martensite, before and after non-isothermal tempering with a heating rate of 5 °C/min, determined using
X-ray diffraction. ...51 Table 3-2 Temperature interval of retained austenite decomposition and
percentage of relative length change for maximum and minimum
heating rates in both investigated microstructure. ...55 Table 4-1 Chemical composition of the investigated steel (wt.%). ...65 Table 4-2 Crystal structure, morphology and size of identified carbides in the
tempered medium-carbon low-alloy bainite. ...79 Table 5-1 Hardness changes during isothermal tempering with different holding
LIST OF FIGURES
Page Figure 1-1 Part of Fe-C phase diagram associated with steel phase
transformations, up to 2.0 wt.% of C (Smallman & Ngan, 2011). ...5 Figure 1-2 Influence of different manganese contents on the A1 and A3 lines
(Roberts et al., 1998). ...7 Figure 1-3 Effect of chromium percentage on the γ-field phase in a steel
containing chromium (Roberts et al., 1998). ...8 Figure 1-4 Jominy curves of effect of different amount (a) manganese, and (b)
nickel on the hardness of steel (Hashmi, 2014; George E Totten et al.,
2004). ...9 Figure 1-5 Image taken by atomic force microscope showing the displacements as
a result of formation of bainite on a polished surface of austenite
(Swallow & Bhadeshia, 1996). ...12 Figure 1-6 Schematic evolution of free energy as a function of carbon
concentration showing the T0 curve (H. Bhadeshia, 2001). ...13 Figure 1-7 Schematic of an incomplete bainitic transformation. After diffusionless
formation of bainite plate, the excess carbon escape into the retained austenite and oncoming plate forms from carbon enriched austenite. The phenomenon stops at T0 curve because thermodynamically, diffusionless transformation cannot occur when austenite composition
reaches T0 line (H. Bhadeshia, 2001). ...14 Figure 1-8 Schematic illustration of transformation of austenite to lower and upper
bainite (Takahashi & Bhadeshia, 1990). ...15 Figure 1-9 Upper bainite in Fe–0.095C–1.63Si–2Mn–2Cr wt.% steel transformed
isothermally at 400 °C (H. Bhadeshia & Honeycombe, 2011). ...16 Figure 1-10 lower bainite microstructure of Fe–0.3C–4Cr (H. Bhadeshia &
Honeycombe, 2011). ...17 Figure 1-11 Hardness changes for two bainitic steels consisting different
percentages of carbon, as a function of Hollomon-Jaffe parameter
Figure 1-12 (a) lath type and blocky retained austenite in as-quenched sample, (b) martensite formation after 5 hours of tempering at 230 °C (Yan et al.,
2017). ...22 Figure 1-13 (a) retained austenite in as-quenched sample, (b) lower bainite after 1
hour of tempering at 400 °C (Yan et al., 2017). ...23 Figure 1-14 Influence of various amounts of chromium on hardness during
tempering of a steel containing 0.35 wt.% carbon (Bain & Paxton,
1966). ...25 Figure 1-15 Size variation of cementite versus tempering time at 700 °C for a
Fe-0.45C-0.22Si-0.62Mn wt.% steel. The upper bound on each shaded region is for average size of cementite located at the lath boundaries
and the lower bound is for lntra-lath cementite (Nam, 1999). ...27 Figure 1-16 Secondary hardening peak for a bainitic steel containing 0.3 wt.%
vanadium (Irvine & Pickering, 1957). ...28 Figure 1-17 Change in different mechanical properties during 1 h tempering as a
function of tempering temperature for 1.5Ni-1Cr-0.25Mo-0.4C wt.%
steel (Thelning, 1975) ...29 Figure 2-1(a) Dilatometric cooling curves of studied steel. Derivatives of relative
length changes during cooling at cooling rates of (b) 0.08 °C/s, (c) 0.3
°C/s, and (d) 3 °C/s. ...34 Figure 2-2. (a) Relative length changes, and (b) derivatives of relative length
changes during non-isothermal tempering of bainitic, martensitic and
mixture specimens with a heating rate of 10 °C/min. ...35 Figure 2-3. Microstructure of different samples: (a) bainite plus retained austenite
(RA) after cooling rate of 0.08 °C/s (b) tempered bainite, (c) bainite plus martensite after cooling rate of 0.3 °C/s (d) sheaves of tempered bainite and carbides between them, (e) plate of tempered martensite with carbides inside, (f) full martensite after cooling rate of 3 °C/s,
and (g) tempered martensite. ...39 Figure 3-1 SEM image illustrating as-received microstructure composed of bainite
and retained austenite (RA)...45 Figure 3-2 As-cooled microstructures obtained for different cooling rates: (a)
Martensitic microstructure, 180 °C/min and (b) bainitic
microstructure, 4.8 °C/min. ...46 Figure 3-3(a) Relative length change diagram during non-isothermal tempering of
the first derivative curve of the relative length change corresponding
to these heating rates. ...48 Figure 3-4 (a) Relative length change diagram during non-isothermal tempering of
the martensitic specimen at the heating rates of 5 °C/min and 30 °C/min, and (b) the first derivative curve of relative length change
corresponding to these heating rates. ...49 Figure 3-5 Two XRD (X-ray diffraction) peaks of bainite and martensite: (a)
(110) peak and (b) (200) peak. ...51 Figure 3-6 Relative length variations near the inflection point. ...54 Figure 3-7 XRD spectra of bainite and non-isothermal tempered bainite at heating
rate of 5 °C/min. ...56 Figure 3-8 XRD spectra of martensite and non-isothermal tempered martensite at
heating rate of 5 °C/min. ...56 Figure 3-9 Relative length change and its derivation during the cooling cycle
(from 600 °C to ambient temperature at a cooling rate of 600 °C/min) after tempering of: (a) The bainitic specimen non-isothermally
tempered at a heating rate of 5 °C/min; (b) the bainitic specimen non-isothermally tempered at a heating rate of 30 °C/min; (c) the
martensitic specimen non-isothermally tempered at a heating rate of 5 °C/min and (d) the martensitic specimen non-isothermally tempered at
a heating rate of 30 °C/min. ...58 Figure 3-10 SEM images of microstructure evolution in the bainitic sample during
non-isothermal tempering at heating rate of 5 °C/min: (a) The microstructure after tempering; (b) blocks of retained austenite (RA) prior to tempering and (c) blocks of decomposed retained austenite
after tempering. ...60 Figure 3-11 SEM images after non-isothermal tempering at heating rate of 30
°C/min: (a) Plates of tempered martensite with fine needle-like carbides within the plate and (b) tempered bainite with coarser
rod-shape carbides. ...61 Figure 4-1 Primary microstructure of bainite with retained austenite before
tempering. ...66 Figure 4-2 Dilatometry curves during isothermal tempering for 16 h at (a) 350 °C,
(b) 550 °C, and (c) 600 °C. ...68 Figure 4-3 dilatometry curves of cooling cycle with cooling rate of 600 °C/min
Figure 4-4 XRD (110) peak of retained austenite. ...70 Figure 4-5 Change in carbon content of retained austenite during tempering at
550 °C. ...71 Figure 4-6 SEM images of (a) blocks of partially decomposed retained austenite
after 16 h of tempering at 350 °C, (b) fresh martensite formed during cooling after 16 h of tempering at 550 °C, and (c) fully decomposed retained austenite and tempered microstructure blocks after 16 h of
tempering at 600 °C. ...72 Figure 4-7 Bainite hardness as a function of tempering time for tempering
temperatures of 350 °C, 550 °C and 600 °C. ...74 Figure 4-8 SEM images bainitic specimens after tempering for 16 h at (a) 350 °C,
(b) 550 °C, and (c) 600 °C. ...75 Figure 4-9 Bright-field TEM image and corresponding selected area electron
diffraction (SAED) pattern of (a) Fe3C carbide after 1 h of tempering
at 550 °C, (b) Cr7C3 carbide after 16 h of tempering at 600 °C, (c) and
(d) Cr23C6 carbides after 16 h of tempering at 600 °C. ...77
Figure 5-1 Schematic of double tempering process for a medium-carbon low-alloy
steel. ...81 Figure 5-2 Real temperature versus time curve during non-isothermal tempering
of a large-size slab...84 Figure 5-3 Proposed tempering cycle for a large-size slab. ...86
LIST OF ABBREVIATIONS
B: Bainite
bct: Body Centered Tetragonal Bf: Bainite finish temperature
Bs: Bainite start temperature
CCT: Continuous Cooling Transformation FCC: Face Centered Cubic
HRC: Hardness Rockwell C
ICDD: International Centre for Diffraction Data M: Martensite
Mf: Martensite finish temperature
Ms: Martensite start temperature
PDF: Powder Diffraction Files RA: Retained Austenite
SAED: Selected Area Electron Diffraction SEM: Scanning Electron Microscopy TEM: Transmission Electron microscope TM: Tempered Martensite
TTT: Time Temperature Transformation diagrams XRD: X-Ray Diffraction
LIST OF SYMBOLS °C: Degree Celsius μm: Micrometer α: Ferrite γ: Austenite η: Transition carbide ∆l: Length change L0: Initial length K: Kelvin wt.%: Weight percent
INTRODUCTION
Tempering is a thermal treatment process in steels often carried out after the quench. The aim of the tempering operation is to modify the microstructure and achieve the desired mechanical properties such as hardness and toughness. Different phenomena occur during tempering of steels, including segregation of carbides, precipitation of transition carbides, retained austenite decomposition, carbide precipitation and carbide coarsening. Depending on chemical composition of steel, primary microstructure and heating rate, each phenomenon occurs during a specific temperature interval and time. Therefore, appropriate tempering holding time and temperature need to be determined based on the above mentioned tempering phenomena.
Nevertheless, tempering of large-size slabs has been always a controversial process. Since in real conditions, a large-size slab contains different microstructures, from martensite on the surface to bainite and retained austenite in the center of slab, therefore, the response of each location of the slab during tempering is different.
Choosing the proper tempering temperature and holding time has always been an open question because it is completely dependable on the size of the slab. In the industry, tempering holding time is considered 1 or 2 hours for every inch of thickness, but in the case of large-size slabs, sometimes tempering takes 4-5 days at 500 to 600 °C and usually more than one tempering is applied. Therefore, there is a clear need for a more fundamental understanding of the metallurgical phenomena occurring during the tempering process. The present project has been defined with the view to increase the existing knowledge of the tempering process, specifically for bainitic and martensitic microstructures which are the dominant phase in large-size ingots.
In order to achieve this objective, the following topics have been studied in this research by experimentally simulating the industrial heat treatment conditions using dilatometry machine:
- Influence of primary microstructure on tempering behaviour of medium-carbon low-alloy steel.
- Detailed phase transformation study during non-isothermal tempering of martensite and bainite.
- Investigate phase transformations during isothermal tempering of bainite.
Chapter 1 of this thesis starts with a literature review about bainitic transformation and tempering of bainite. Then, different phase transformations during tempering and effect of alloying elements on the carbide precipitation during tempering are described.
In chapter 2, three different cooling rates (from 0.08 to 3 °C/s) representative of different regions from the surface to the core of the slab were experimentally simulated, and then non-isothermal tempering was carried out for each starting microstructure to determine the effect of non-isothermal tempering on microstructure evolution in large-size slabs
In chapter 3, different tempering stages and phase transformations during non-isothermal tempering of bainitic and martensitic microstructures obtained after quenching of a medium-carbon low-alloy steel was studied.
In chapter 4, the effect of isothermal tempering on different tempering stages such as retained austenite decomposition and carbide precipitation is investigated for a bainitic steel
In chapter 5, based on the findings of this research, tempering process of a large-size slab is studied and an optimized tempering cycle based on the industrial requirements is proposed.
CHAPTER 1
LITERATURE REVIEW
1.1 Medium-Carbon Low-Alloy Steels
Medium-Carbon steels contain 0.30 to 0.60 wt.% of carbon and 0.60 to 1.65 wt.% of manganese. Increasing the carbon content to almost 0.5%, with an increase in manganese, permit medium-carbon steels to improve their mechanical properties by quenching and tempering treatment. Applications of this category of steels is wide and include shafts, couplings, crankshafts, axles, gears, and forgings (Davis, 1994; Philip & Mccaffrey, 1990).
On the other hand, low-alloy steels include a group of ferrous materials consisting of alloying elements such as nickel, chromium, vanadium, manganese and molybdenum, leading to higher mechanical properties than plain carbon steels. The total proportion of alloying ellements can range from 2.07 wt.% until that of stainless steels, which contain a minimum of 10 wt.% of chromium. The main role of alloying elements in low-alloy steels is to improve hardenability and toughness after heat treatment. The mechanisms that improve mechanical properties for this type of steel include: (i) solid solution strengthening, (ii) carbide forming elements which cause the austenite boundaries to be pinned by second-phase particles, (iii) grain refinement hardening and (iv) phase transformation hardening during heat treatment and deformation (Demeri, 2001; Handbook, 1990).
In the following sections, AISI P20, which is a Medium-carbon low-alloy steel, is discussed. 1.1.1 AISI P20
AISI P20moldsteelis a medium-carbon low-alloy toolsteelthat is characterized by its good toughness at moderate strength levels. This steel is commonly used for low-temperature applications such as plastic injection molds, casting dies and also for die casting of alloys with melting temperatures lower than 200 °C (R.A. Mesquita, 2014).
Table 1-1 shows the alloying elements of AISI P20. It can be seen that this steel contains 0.6-1.0 wt.% of manganese, 1.4-2.0 wt.% of chromium, 0.30-0.55 wt.% of molybdenum and 0.2-0.8 wt.% of silicon with negligible amount of phosphorus and sulphur (A.M. Bayer, 1990).
AISI P20 is normally heat-treated to achieve the hardness range of 30 to 36 HRC; this hardness makes it desirable to be machined into large, complicated dies and molds. When P20 is used for plastic injection molding or die casting of low-melting alloys, usually it is used in prehardened condition. However, when used for compression molds, after machining, it is subjected to carburizing and hardening treatment to increase the surface hardness to the required amount depending on the materials (R.A. Mesquita, 2014).
Table 1-1 Chemical Composition of AISI P20 (wt.%) (A.M. Bayer, 1990)
Carbon Manganese Phosphorus Sulphur Silicon Chromium Molybdenum Min Max Min Max Max Max Min Max Min Max Min Max 0.28 0.40 0.60 1.00 0.030 0.030 0.20 0.80 1.40 2.00 0.30 0.55
1.2 Phase Transformations
Heat-treated medium-carbon steel comprises different phases such as martensite, bainite and retained austenite. In this section, a brief introduction will be provided to different phase transformations of austenite including pearlite, martensite and bainite. In the present research, the focus has been placed on bainite, therefore, in section 1.4, bainitic transformation will be comprehensively discussed.
1.2.1 Austenite to Pearlite
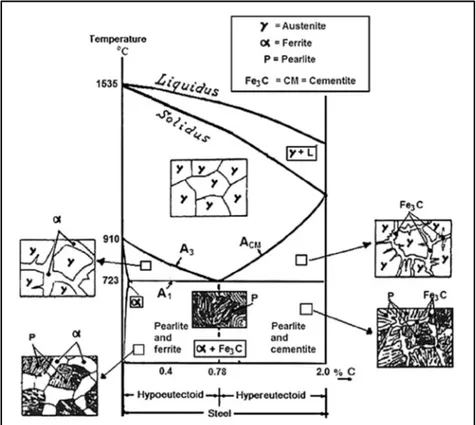
Austenite (γ-iron) in comparison with ferrite (α-iron) has much higher carbon solubility with a maximum value of around 2 wt.% at 1147 °C. However, the α-iron maximum solubility of
carbon is 0.02 wt.% at 723 °C (Figure 1-1). Pearlite reaction starts due to the significant difference in carbon solubility in austenite and ferrite which causes carbon rejection and formation of carbides at the boundaries of austenite. During the cooling of austenite containing 0.78 wt.% of carbon between 720 °C and 550 °C, transformation of austenite to pearlite occurs by an eutectoid reaction. By cooling of austenite with less than 0.78 wt.% of carbon, hypo-eutectoid ferrite forms at A3 line before the eutectoid reaction which occurs at
A1 line. In the higher amount of carbon, first, cementite forms at Acm line to reduce the
carbon amount of austenite to 0.78 wt.%, and then eutectoid reaction occurs. In homogeneous austenite, the nucleation of pearlite due to regions of high energy occurs at grain boundaries. (Porter & Easterling, 1992; Smallman & Ngan, 2011).
Figure 1-1 Part of Fe-C phase diagram associated with steel phase transformations, up to 2.0 wt.% of C (Smallman & Ngan, 2011).
1.2.2 Austenite to Martensite
Solid solution of austenite by rapid cooling to temperatures below about 200 °C forms a supersaturated solid solution called martensite (ά). Martensite is the hardest constituent in quenched steel. Rapid cooling or quenching of steels to the ambient temperature causes carbon atoms of austenite trap in the octahedral sites of the face centered cubic (FCC) austenite during martensite formation and then lead to the formation of a tetragonal (bct) structure. The morphology of martensite, depending on the carbon content of austenite, can be plate or lath or mixed (Krauss, 1999).
In contrast to ferrite or pearlite, martensitic transformation is diffusionless and occurs with deformation of austenite’s lattice. Martensitic transformation occurs athermally and starts when the temperature drops below the martensite start (Ms) temperature and finishes at
martensite finish (Mf) temperature. By adding more carbon to steel, Ms and Mf decrease. (H.
Bhadeshia & Honeycombe, 2011). 1.2.3 Austenite to Bainite
The bainitic transformation has many similarities to martensite and pearlite reaction. The martensitic transformation occurs with structural change without diffusion and pearlite forms by redistribution and diffusion of carbon atoms. However, the bainite transformation starts with a structure change followed by diffusion of carbon atoms which precipitate as carbides in the matrix. In section 1.4, bainitic phase transformation will be discussed with detail. 1.3 Effect of Alloying Elements
Steel chemical composition plays a significant role in the final microstructures and mechanical properties achieved after the heat treatment process. The effects of alloying elements can be discussed from two points of view: (i) their effects on phase transformation; and (ii) their effects on mechanical properties.
1.3.1 Effect of Alloying Elements on Phase Transformation
Alloying elements can influence phase transformations in steels in the two following ways: Austenite Stabilizer
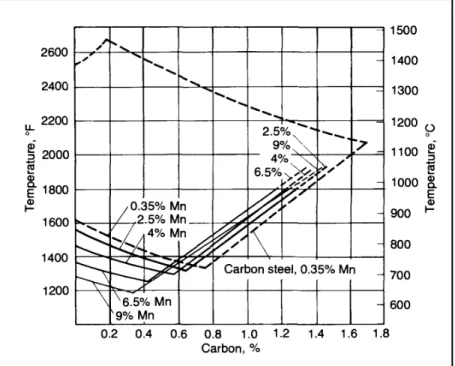
Elements such as nickel, cobalt and manganese stabilize the austenite phase by expanding the γ-field. Figure 1-2 shows changes in the γ-field by adding manganese as an austenite stabilizer element (H. Bhadeshia & Honeycombe, 2011; Roberts, Kennedy, & Krauss, 1998).
Figure 1-2 Influence of different manganese contents on the A1 and A3 lines (Roberts et al., 1998).
Ferrite Stabilizers
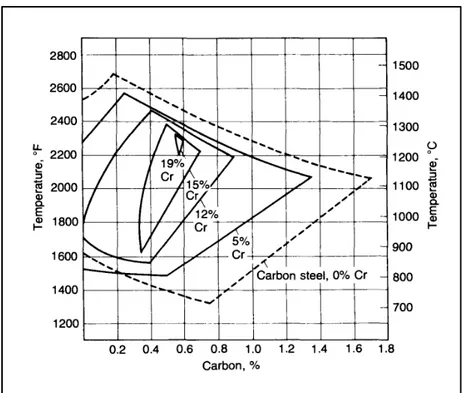
Ferrite stabilizers (α-stabilizers) contract the γ-field and boost ferrite formation over wider temperature range. Figure 1-3 illustrates how increasing the percentage of chromium affects the γ-field; it can be seen that by raising the chromium content up to 19%, the austenite phase tends to disappear (H. Bhadeshia & Honeycombe, 2011). Table 1-2 shows the alloying elements in two groups of austenite or ferrite stabilizers.
Figure 1-3 Effect of chromium percentage on the γ-field phase in a steel containing chromium (Roberts et al., 1998).
Table 1-2 Alloying elements impact on steel phase transformation. Elements
Austenite stabilizer Mn, Ni, Co, Cu, Zn, C, N
Ferrite stabilizer Cr, Si, Mo, V, Ti, Al, Sn, W, P, Nb, B, S, Ta, Zr
1.3.2 Effect of Alloying Elements on Mechanical Properties
Besides the effect of alloying elements on austenite and ferrite, their impact on mechanical properties is the primary reason for industries to include them in steels. In the following, the alloying elements that exist in the studied steel with their exclusive effects on mechanical properties are discussed.
Manganese (Mn): Manganese has been added to steel to help the deoxidation by forming MnO. Manganese refines the grain size, therefore decreases the ductile to brittle transition temperature, increases the tensile and yield strength. Manganese remarkably increases the hardness and hardenability in comparison with nickel (Figure 1-4). It interacts with carbon and forms Mn7C3 carbides. However, Mn decreases the transformation temperature range.
Typical range of manganese in steels is from 0.3 to 2 wt.% (Hashmi, 2014; George E Totten, Funatani, & Xie, 2004).
Figure 1-4 Jominy curves of effect of different amount (a) manganese, and (b) nickel on the hardness of steel (Hashmi, 2014; George E Totten et al., 2004).
Nickel (Ni): Nickel is added to steels to enhance the toughness, tensile and yield strength. Nickel increases the hardness of steel but not as much as manganese (Figure 1-4). Nickel lowers the austenite to ferrite transformation temperature range, retards the austenite decomposition and improves fatigue resistance. Typical range of nickel in steels is from 0.3 to 5 wt.% (Hashmi, 2014; George E Totten et al., 2004).
Chromium (Cr): Chromium improves strength, hardness, hardenability, hot strength and forms wear resistant carbides. Chromium enhances remarkably the austenite to ferrite transformation temperature when the percentage exceeds 12 wt.%. Typical range of
chromium in steels is between 0.3 and 12 wt.% (Hashmi, 2014; George E Totten et al., 2004).
Molybdenum (Mo): Molybdenum increases creep and corrosion resistance, high-temperature strength and hardenability by refining the grains. Also, reduces susceptibility to temper embrittlement. The typical range of molybdenum for low-alloy steels is between 0.1 to 0.5 wt.%, and in stainless steels is from 2 to 4 wt.% (Hashmi, 2014; George E Totten et al., 2004).
Vanadium (V): Adding vanadium causes grain refinement. Hence, increases the hardenability and allows the production of prehardened blocks with a cross section larger than the same alloy without vanadium. Vanadium is a strong carbide forming element; increases wear and temper resistance in steels. Addition of vanadium also increases the impact toughness up to 120%, raises the yield strength up to 17% and improves hardness after tempering by 24%. The typical range for low-alloy steel is between 0.1 and 0.3 wt.% and for tool steels is around 2 wt.%. (Hashmi, 2014; George E Totten et al., 2004)
Copper (Cu): Copper provides strength without endangering toughness during tempering heat treatment and raises atmospheric corrosion resistance. Typical range of copper in steels is from 0.2 to 0.5 wt.% (Hashmi, 2014; George E Totten et al., 2004).
Silicon (Si): Silicon picks up hardenability and reduces toughness, throughout the tempering heat treatment process, enhances the transformation temperature from epsilon carbide (Fe2.4C) to cementite (Fe3C). Silicon also strengthens ferrite and raises the transformation
temperatures. Typical range of silicon in steels is between 0.2 and 2.5 wt.% (Hashmi, 2014; George E Totten et al., 2004).
1.4 Bainitic Transformation
In 1930, bainite was discovered by Davenport and Bain, when they did isothermal transformation of austenite at temperatures just above martensitic transformation (Davenport,
Bain, Paxton, & Westbrook, 1930). Generally, bainite is made of fine aggregates of ferrite plates with cementite particles. Bainitic transformation occurs during cooling from austenite to the temperatures below pearlite formation, but higher than martensite start temperature. Bainite can be produced either by isothermal transformation or continuous cooling with cooling rates which are neither fast to form martensite nor slow to form pearlite (H. Bhadeshia, 2001; Davenport et al., 1930).
1.4.1 Mechanisms of Bainite Formation
Extensive research has been performed on the mechanisms of bainite formation. Some researchers believe that this transformation is displacive and diffusionless, whereas others hold the view that the transformation is controlled by diffusion. According to Bhadeshia, bainitic transformation leads to a deformation with a shear component of 0.26 and dilatation strain of 0.03 which is compatible with displacive transformation mechanism. This deformation occurs at higher temperatures in comparison with martensitic transformation and causes plastic deformation, as shown in Figure 1-5. However, the transformation is diffusionless, but carbon escapes from bainitic ferrite to the retained austenite or precipitates as carbide, after formation of bainite sheaves (HKDH Bhadeshia, 1981; Sandvik, 1982).
Figure 1-5 Image taken by atomic force microscope showing the displacements as a result of formation of bainite on a polished surface
of austenite (Swallow & Bhadeshia, 1996).
Substitutional alloying elements do not partition during bainitic transformation. Their principal influence is on stabilizing austenite and ferrite phases. The ratio of iron to substitutional atoms stay constant during transformation which supports the view on diffusionless nature of bainite and small diffusivity of substitutional atoms at the temperatures related to bainitic transformation (Podder, 2011).
In contrast to substitutional elements, interstitial alloying elements such as C and N can partition into the austenite. In comparison with martensite, carbon has the ability to escape into another plate after formation of bainitic ferrite since bainite forms at higher temperatures (Podder, 2011).
1.4.2 Definition of T0 Curve
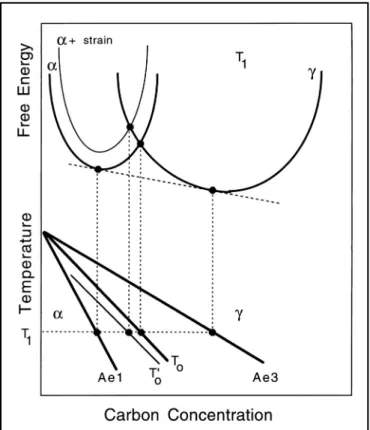
Thermodynamically, diffusionless transformation can only occur at temperatures below a critical temperature, T0, where bainite has lower free energy than austenite with the same
composition (Figure 1-6). The T0 curve is obtained from T0 temperatures for different carbon
concentrations. Figure 1-6 is an example of T0 curve plotted for Fe-C phase diagram. For
example, in Figure 1-6, at T1, if the carbon concentration of austenite is less than the amount
specified by T0 curve, diffusionless transformation of austenite to bainite can occur (H.
Bhadeshia, 2001).
Figure 1-6 Schematic evolution of free energy as a function of carbon concentration showing the
T0 curve (H. Bhadeshia, 2001).
Considering diffusionless transformation of bainite, after formation of bainite plate (sheave), the surplus amount of carbon is rejected into the retained austenite. Hence, the subsequent plate of bainite has to form from a carbon enriched austenite (Figure 1-7). This process
continues until the amount of carbon in austenite meets the T0 curve because at higher
amount of carbon than the amount specified by T0 curve, diffusionless transformation of
austenite to bainite cannot occur. Experimental investigations also show that austenite to bainite transformation process comes to an end when the amount of carbon in austenite reaches the T0 curve instead of equilibrium A3 curve. Therefore, the reaction is incomplete
because the austenite has not reached the equilibrium composition. Since the bainitic transformation is an “incomplete-reaction phenomenon”, a bainite finish temperature Bf does
not have any fundamental definition (H. Bhadeshia, 2001).
Figure 1-7 Schematic of an incomplete bainitic transformation. After diffusionless formation of bainite plate, the excess carbon escape into the retained austenite and oncoming plate forms from carbon enriched austenite. The phenomenon stops at T0 curve because thermodynamically, diffusionless transformation cannot occur when
austenite composition reaches T0 line (H. Bhadeshia, 2001).
By decreasing the temperature, bainite has the ability to form from austenite with higher amount of supersaturated carbon, therefore, as the temperature drops, more bainite forms and less amount of retained austenite remains.
1.4.3 Morphology of Bainite
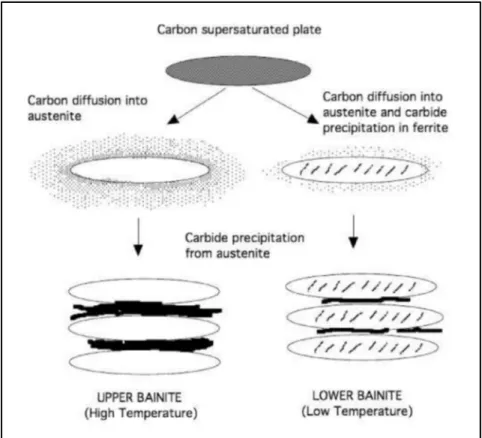
Bainite includes aggregates of fine ferritic plates which are detached by regions of remaining phases. These regions can be retained austenite or carbides. The fine plates of ferrite are about 0.2μm thick and 10μm long and their combination is called sheave. The thickness of the plates decreases by reducing the transformation temperature, therefore the density of plates inside the sheaves increases. Bainite structure changes with temperature and two types of bainite can be formed depending on the temperature at which bainite forms and have been classified as: (i) upper bainite, and (ii) lower bainite (Figure 1-8) (H. Bhadeshia, 2001).
Figure 1-8 Schematic illustration of transformation of austenite to lower and upper bainite (Takahashi & Bhadeshia, 1990).
Upper Bainite: Figure 1-8 schematically shows the upper bainite formation, which is comprised of fine plates of ferrite (with thickness of 0.2μm) and carbides precipitation from austenite among the ferritic plates. Formation of upper bainite occurs in the temperature
range between 400 °C and 550 °C. Ferrite in upper bainite is free from precipitations of carbide (Figure 1-9) (H. Bhadeshia, 2001).
Figure 1-9 Upper bainite in Fe–0.095C–1.63Si– 2Mn–2Cr wt.% steel transformed isothermally at 400 °C (H. Bhadeshia & Honeycombe, 2011).
Lower Bainite: Lower bainite forms at temperatures higher than Ms, approximately from
250 °C to 400 °C. The microstructure is similar to upper bainite, but carbides also precipitate inside the plates. In lower bainite, there are two types of cementite precipitations, one type forms from carbon enriched austenite and precipitate between the plates of ferrite, and the second type, which forms from supersaturated plates of ferrite, and precipitate inside the plates (Figure 1-10) (H. Bhadeshia & Honeycombe, 2011).
Figure 1-10 lower bainite microstructure of Fe– 0.3C–4Cr (H. Bhadeshia & Honeycombe, 2011).
1.4.4 Effects of Alloying Elements on Bainite Start Temperature
Carbon has a significant role in the formation of bainite. The effect of carbon on the start temperature of bainite is shown in the Equation 1.1. As indicated in this equation, other elements such as manganese, nickel, chromium and molybdenum can postpone the bainite formation to lower temperatures (H. Bhadeshia & Honeycombe, 2011).
(° ) = 830 − 270 − 90 − 37 − 70 − 83 (1.1)
1.5 Tempering of Bainite
Medium-carbon low-alloy steels (Cr-Mo-Ni-V) have wide applications in pressure vessels, automotive applications and plastic dies. Ductility is a limiting factor for application of these steels since the quenched steel is hard and brittle. Tempering is a heat treatment of as-quenched martensite and bainite to modify the microstructure and obtain the desired mechanical properties such as toughness, ductility and dimensional stability by holding the steel below the lower critical temperature (A1) which austenite begins to form.
Tempering in martensitic and bainitic steels comprises different phenomena which occur during tempering. Different tempering phenomena in martensite can be classified as shown in the Table 1-3.
Table 3 Different tempering stages and their temperatures in martensite based on 1-hour treatment (Dhua, Ray, & Sarma, 2001)
Stage Temperature
range ( °C) Phenomenon
I 25 to 80 Diffusion of carbon, segregation and carbon clustering II 100 to 200 Precipitation of transition carbides
III 200 to 350 Decomposition of retained austenite
IV 250 to 450 Dissolution of transition carbides and precipitation of cementite V 500 to 650 Recovery of dislocations
VI 500 to 700 Precipitation of alloying elements VII 600 to 700 Carbide coarsening
Generally, the change in microstructures and properties during tempering depends on the primary microstructure; therefore, the bainite reaction during tempering is different from that of martensite (Fonstein, 2015).
In contrast with martensite, bainite has lower carbon in solid solution. Since carbon has a significant solid solution effect, during the tempering of martensite, mechanical properties drop remarkably as carbon diffuses out of the bct lattice and forms carbides. On the other hand, tempering has much milder effect on bainite because carbides have already been formed during the formation of bainite; therefore, mostly carbide coarsening occurs during the tempering, which decreases the strength (Woodhead & Quarrell, 1965).
The tempering stages of Table 1-3 are idealized and many of them may not occur during the formation of martensite and bainite, particularly when the Ms is high. Bainitic transformation
occurs at higher temperatures in comparison with martensite. It means that many stages of tempering occur during the formation of bainite. Hence, carbon diffusion, carbon clustering and precipitation of transition carbides occur during bainitic transformation due to a phenomenon called autotempering. Autotempering is inevitable for bainite and its influence is greater in bainite than martensite.
In comparison with martensite, bainite forms at higher temperatures and the microstructure also experiences some extent of recovery during bainite formation. Hardness and strength of lower bainite throughout tempering declines more than upper bainite. This reduction is also more considerable for high strength steels (Irvine & Pickering, 1957).
Microstructure evolution during bainite tempering could be summarized as following: (H. Bhadeshia & Honeycombe, 2011):
I. Considerable changes in strength during the coarsening of bainite plate and recrystallization into equiaxed ferrite grains.
II. Insignificant changes in strength during cementite particle coarsening and recovery of the dislocations in the substructure.
1.5.1 Hollomon – Jaffe Parameter
Tempering temperature and time are both the controlling parameters during tempering heat treatment. Both variables were combined in a parameter named Hollomon-Jaffe to describe the changes in hardness of steel during tempering (George E Totten et al., 2004). The Hollomon-Jaffe parameter can be calculated according to Equation 1.2 (Janjusevic, Gulisija, Mihailovic, & Pataric, 2009):
= ( + ( )) (1.2)
Where P is the Hollomon-Jaffe parameter, C is the Hollomon-Jaffe constant, T is temperature in Kelvin (K), and t is time in hour (h).
At the beginning, Hollomon-Jaffe constant (C) of 20 was considered appropriate for all kind of steels. Later, Sinha’s works showed that the constant C depends on carbon content of the steel (Sinha, 1989). Therefore, Hollomon-Jaffe constant can be calculated according to Equation 1.3 (George E Totten et al., 2004):
= 21.3 − (5.8 × % ) (1.3)
Figure 1-11 depicts the relation between Hollomon-Jaffe parameter and hardness during tempering of two bainitic steels with different amounts of carbon. It can be seen in Figure 1-11 that minor changes in the amount of carbon (0.06-0.14 wt.%) in bainitic steels causes small effect on the hardness.
Figure 1-11 Hardness changes for two bainitic steels consisting different percentages of carbon, as a function of Hollomon-Jaffe parameter (Irvine, Pickering, Met, &
Heselwood, 1957)
1.5.2 Precipitation of Transition Carbides
Transition carbides form during first stages of tempering as the precursor for the formation of cementite. During tempering of bainite, precipitation of transition carbides is unlikely because of the nature of bainite, which already consists of cementite and also due to the autotempering effect during formation of bainite. However, in general for steels, at tempering temperatures of 100 °C to 200 °C, the first carbide that precipitate in the matrix of low-carbon steels is orthorhombic η-carbide (Fe2C). Hexagonal ε-carbide (Fe2C) precipitates in
steels with more than 0.2 wt.% of carbon. In steels with higher amounts of carbon, another transition carbide with stoichiometric composition of Fe5C2 forms before cementite and is
called Hägg carbide (H. Bhadeshia, 2001; Morra, Böttger, & Mittemeijer, 2001; Naraghi, Selleby, & Ågren, 2014).
1.5.3 Retained Austenite Decomposition During Tempering
Residual austenite decomposition occurs during the third stage of tempering. The decomposition starts at about 200 °C and ends at about 350 °C. The behaviour of retained austenite decomposition throughout tempering differs as a function of chemical composition of steel. The decomposition product generally is a mixture of ferrite and cementite. However, formation of martensite has also been reported by Podder et al. and Yan et al. during the decomposition of retained austenite (Figure 1-12). In addition, Yan et al. investigations have shown the transformation of retained austenite to lower bainite, as well (Figure 1-13) (Saha Podder & Bhadeshia, 2010; Yan, Han, Li, Luo, & Gu, 2017)
Figure 1-12 (a) lath type and blocky retained austenite in as-quenched sample, (b) martensite formation after 5 hours of tempering at 230 °C (Yan et al., 2017).
Figure 1-13 (a) retained austenite in as-quenched sample, (b) lower bainite after 1 hour of tempering at 400 °C (Yan et al., 2017).
1.5.4 Double Tempering of Steels
During tempering, retained austenite transforms over the temperature range of 200-350 °C. Alloying elements such as chromium and silicon hinder this transformation and postpone it to higher temperatures. Retained austenite decomposition during tempering of alloy steels is mostly not completed at the end of tempering. For example, in high-alloy steels containing 10 wt.% of chromium, even a long holding time cannot decompose the retained austenite. By tempering between 500 °C and 550 °C, part of this retained austenite transforms to martensite during cooling cycle after tempering and produces fresh martensite. Therefore, to acquire a full transformation of retained austenite as well as tempering the fresh martensite, double tempering is often applied for alloyed steels (G.E. Totten & Howes, 1997).
1.5.5 Precipitation of Carbides During Tempering
In bainitic steels, understanding the carbides precipitation and carbides evolution throughout tempering is important. Thermodynamically, Mo, Cr, Ti, V and W carbides are more stable than cementite and can form carbides in steels. Therefore, it is anticipated that if the amounts of alloying elements are sufficiently high in steels, these carbides can form prior to
cementite. Nevertheless, because these substitutional elements cannot diffuse sufficiently at lower temperatures, alloy carbides do not form until about 500 °C (H. Bhadeshia & Honeycombe, 2011).
Five types of carbides, M3C, M7C3, M2C, M23C6 and M6C, can be found during tempering
which vary as a function of tempering time and temperature. However, three types of carbides, M3C, M7C3 and M23C6 have been widely reported among researchers. The type and
size of carbides are very important because they affect the mechanical properties of the steel (Inoue & Masumoto, 1980).
During tempering, stable M3C carbide is the first one that forms in the matrix followed by
M7C3 which is a metastable carbide. Further tempering causes replacement of metastable
carbides with M23C6 which is an equilibrium carbide (Dépinoy et al., 2017).
1.5.5.1 Tempering of Bainite Containing Vanadium
Vanadium is among the elements with strong carbide formation tendency. Even in steels with 0.1 wt.% of vanadium, VC carbide with FCC structure can form. V4C3 is another type of
vanadium carbide that can form alongside with VC. VC or V4C3 can be replaced with
cementite at higher temperatures during tempering (Honeycombe & Mehl, 1976). 1.5.5.2 Tempering of Bainite Containing Chromium
In comparison to vanadium, chromium carbides are less stable. In bainitic steels, two types of chromium carbides, Cr7C3 and Cr23C6, frequently form during tempering. The common
sequence of formation for these chromium carbides is (H. Bhadeshia & Honeycombe, 2011):
At least 1.0 wt.% of chromium and 0.2 wt.% of carbon in the steel should exist for the formation of Cr7C3. Diffusion of chromium is faster than other substitutional atoms,
therefore, Cr7C3 carbides can form at lower temperatures of approximately 500 °C. Also,
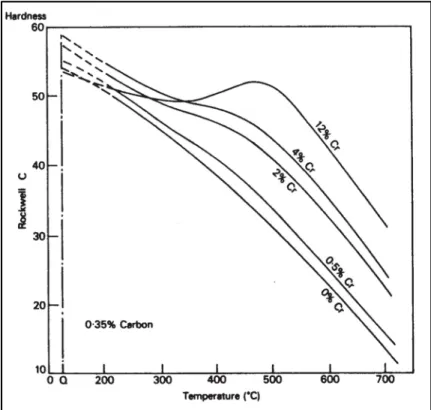
chromium carbides coarsen faster than vanadium carbides. Figure 1-14 depicts the impact of chromium percentage on hardness. It is evident that, secondary hardening effect during tempering occurs in steels with chromium amounts higher than 12 wt.% (Honeycombe & Mehl, 1976).
Figure 1-14 Influence of various amounts of chromium on hardness during tempering of a steel containing 0.35 wt.%
carbon (Bain & Paxton, 1966).
1.5.5.3 Tempering of Bainite Containing Molybdenum
Molybdenum is another carbide forming element during tempering. Two types of carbides, Mo2C and Mo6C, are observed after tempering. For molybdenum contents between 4 to 6
C → → , (1.5)
Between these two types of carbides, hexagonal Mo2C is the carbide responsible for
secondary hardening during tempering. Secondary hardening related to Mo2C precipitation
generally occurs after 25 h of tempering at 550 °C (H. Bhadeshia & Honeycombe, 2011).
Mo2C carbides nucleate at primary austenite grain boundaries and ferrite lath boundaries. For
steels containing vanadium, Mo2C carbides nucleate at cementite-ferrite interface and on
dislocation in the ferrite (H. Bhadeshia & Honeycombe, 2011). 1.5.6 Effect of Tempering on Cementite Coarsening
Coarsening of cementite results in lowering the interface energy between the cementite and matrix that has been stored in the specimen. Cementite particles in the tempered martensite and bainite microstructure are generally located at the lath boundaries or distributed inside the laths. However, cementite exists only at lath boundaries of upper bainite (Greenwood, 1956).
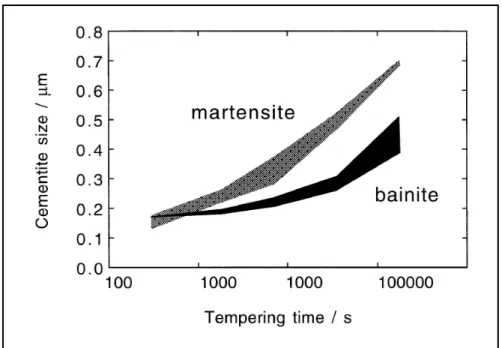
Cementite coarsening during the tempering of a medium-carbon steel is shown in Figure 1-15. The upper line of each region illustrates the lath boundary cementite and the lower line shows the intra-lath cementite. In the beginning, cementite in bainite is coarser than martensite because cementite already exists in bainite and also because of the autotempering effect during the bainitic transformation. While bainite shows high degree of stability to tempering, martensite experiences higher rate of coarsening. Therefore, bainitic microstructures remains finer than martensite over a longer time of tempering (Nam, 1999).
Figure 1-15 Size variation of cementite versus tempering time at 700 °C for a Fe-0.45C-0.22Si-0.62Mn wt.% steel. The upper bound
on each shaded region is for average size of cementite located at the lath boundaries and the lower bound is for lntra-lath cementite
(Nam, 1999).
1.5.7 Secondary Hardening
Secondary hardening occurs during tempering in martensitic and bainitic steels containing strong carbide formers such as Cr, V, Mo and Nb. The alloying carbide precipitation with these elements require diffusion of substitutional atoms; therefore, their precipitation is slow and can only occur at higher temperatures (>500 °C). At the beginning of tempering (mainly in martensite), the hardness decreases as cementite precipitation takes place and replaces the carbon in solid solution. Hardness begins to rise again when the alloy carbides form (Baker & Nutting, 1959; Irvine & Pickering, 1957).
The secondary hardening effect in bainite is less than martensite because the cementite in bainite is coarser. Figure 1-16 shows secondary hardening peak in bainitic steel containing vanadium. Huang et al. works on the effect of molybdenum in low carbon bainitic steels has shown that by adding 0.3 wt.% molybdenum, the steel gains dramatic benefits from
secondary hardening. Saha et al. found that secondary hardening took place during tempering at 500 °C due to the formation of M4C3 and M2C carbides (Huang et al., 2014; Saha, Nayak,
Biro, Gerlich, & Zhou, 2014).
Figure 1-16 Secondary hardening peak for a bainitic steel containing 0.3 wt.% vanadium (Irvine & Pickering, 1957).
1.5.8 Effects of Tempering on Mechanical Properties
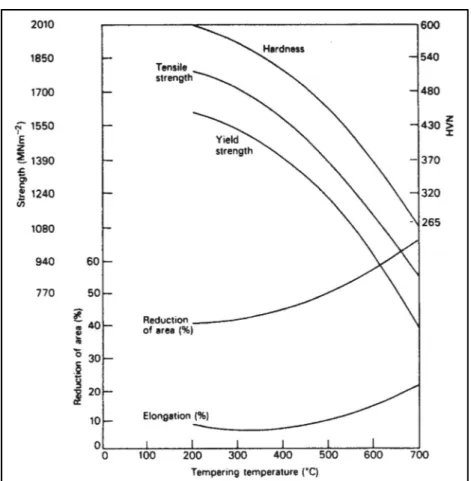
An extensive range of mechanical properties can be obtained during tempering of alloyed steel from 200 °C to 700 °C. In Figure 1-17 Changes in different mechanical properties during 1 h tempering as a function of tempering temperature for 1.5Ni-1Cr-0.25Mo-0.4C wt.% steel is shown. Specifically, tensile strength changes from 1800 to 900 MN m-2, when
the tempering temperature is increased from 200 °C to 700 °C. In the case of ductility, it increases as the tensile strength falls by increasing the tempering temperature; however, there is a minimum ductility around 300 °C which corresponds to retained austenite decomposition and formation of cementite films at the boundaries (H. Bhadeshia & Honeycombe, 2011).
Figure 1-17 Change in different mechanical properties during 1 h tempering as a function of tempering temperature for
1.5Ni-1Cr-0.25Mo-0.4C wt.% steel (Thelning, 1975)
1.6 Summary
In this chapter, bainite formation and effect of tempering on bainite were discussed. In the field of bainite tempering, there is a lack of study for medium-carbon low-alloy steels, especially concerning phase transformations and tempering parameters regarding industrial tempering of large-size slabs. In addition, tempering cycle, chemical composition, and sample size vary from one research to another, which make tempering process difficult to be analysed. For instance, the tempering temperature in which full retained austenite decomposition occurs is not clear for the studied steel. In this research, by methodical design of experiments, tempering parameters are investigated to fill this gap and strengthen the knowledge of tempering.
CHAPTER 2
INFLUENCE OF STARTING MICROSTRUCTURE ON DILATATION BEHAVIOR DURING TEMPERING OF A HIGH STRENGTH STEEL
S. Hesamodin Talebi1, Hadi Ghasemi Nanesa1, Mohammad Jahazi1 and Haikouhi
Melkonyan2
1 École de Technologie Supériere, Département de Génie Mécanique, Montréal, Québec,
Canada.
2 Finkl Steel Inc., 100 McCarthy, Saint-Joseph-de-Sorel, QC J3R 3M8, Canada.
This article has been accepted for presentation in the conference of THERMEC2018. This article has been also selected to be published in the Journal of Materials Science Forum
(Accepted: 19 November 2017)
Abstract
The aim of this study was to determine the effect of non-isothermal tempering on microstructure evolution in large-size slabs. Using high-resolution dilatometry, three different cooling rates (from 0.08 to 3 °C/s) representative of different regions from the surface to the core of the slab were experimentally simulated, and then tempering was carried out for each starting microstructure. A combination of light and electron microscopy and X-ray diffraction analyses were employed to accurately analyze different phenomena occurring during the tempering process, specially, the identification of different microstructures (bainite, martensite and retained austenite), and the determination of the percentage of retained austenite for each experimental condition were considered. Experimental results revealed that the microstructure after the cooling rate of 0.08 °C/s consisted of bainite and some retained austenite. For the cooling rate of 0.3 °C/s, martensite plus bainite was detected, and when the cooling rate was increased to 3 °C/s, a martensitic microstructure was obtained. Analysis of dilatometry curves indicated that tempering behavior varied significantly with the starting microstructure. Martensite tempering was accompanied with a length decrease due to the decomposition of medium-carbon martensite to low-carbon
martensite plus carbides. Tempering of bainite and retained austenite resulted in a remarkable length increase.
2.1 Introduction
Large-size high strength steels with chromium and nickel are used as dies to form automotive components due to their excellent mechanical properties and good machinability. The manufacturing process of these steels consists of ingot casting, followed by open die forging. The slabs are then quenched and tempered to achieve the desired mechanical properties (Chentouf et al., 2014; Liu et al., 1998; Wu et al., 2017).
The mechanical properties after quenching are strictly depending on the transformation of austenite to different phases including martensite and bainite. Afterwards, tempering of the produced microstructure leads to a more ductile material (Chentouf et al., 2014; Speich et Leslie, 1972). Changes during tempering of martensite and bainite can be classified into four stages. 1) Segregation of carbon atoms and clustering into solid solution which occur below 80 °C; 2) Precipitation of transition carbides in the matrix between 100 °C and 200 °C; 3) Decomposition of retained austenite from 200 °C to 350 °C. Retained austenite decomposes to ferrite/cementite, martensite or bainite depending on steel composition, and 4) conversion of formed transition carbides to more stable cementite in the tempering range of 250 °C to 450 °C. It is worth noting that stages three and four could overlap over a vast range of temperatures (Cheng et al., 1988; Miller, Beaven et Smith, 1981; Morra, Böttger et Mittemeijer, 2001; Nagakura et al., 1983; Primig et Leitner, 2011; Yan et al., 2017).
Large-size slab cools with different cooling rates, and therefore various microstructures form in each region of the slab. The purpose of the present work is to investigate the influence of the starting microstructure and its evolution during tempering.
2.2 Materials and methods
The chemical composition of the high strength steel studied in this study was (wt.%) C 0.35– V 0.15–Mn 0.99–Si 0.41–Ni 0.5–Cr 1.86–Mo 0.53–Cu 0.16. Cylindrical samples 10 mm in length and 4 mm diameter were cut from a large-size forged slab. The primary microstructure of the studied sample consisted of bainite and retained austenite.
Cooling and tempering were simulated using a high-resolution TA DIL 805A/D dilatometer (TA instruments, New Castle, DE, USA). To reach a fully austenitic microstructure, first, the specimens were heated up to 870 °C and hold at this temperature for 10 min before cooling at rates of 0.08, 0.3 and 3 °C/s in order to produce a fully bainitic, a mixed microstructure of bainite and martensite, and a fully martensitic one. Then, non-isothermal tempering with a heating rate of 10 °C/min was performed to investigate different phase transformations as a function of the starting microstructure.
Phase identifications after cooling were made using X-ray diffraction (XRD). The details of the XRD analysis and obtained results have already been reported in a previous publication and will not be reported here (Talebi et al., 2017). Volume fraction of martensite and bainite were calculated using optical micrographs and MIP image analysis software.
2.3 Results and Discussion
2.3.1 Cooling dilatometric curves
Figure 2-1(a) illustrates the dilatation curve versus temperature for the cooling section from austenitization temperature to room temperature for the three investigated cooling rates of 0.08 °C/s, 0.3 °C/s and 3 °C/s. ∆L and L0 represent length change and initial length of the
samples, respectively. The influence of cooling rate on transformation points is also illustrated in Figure 2-1(b), (c), and (d), where the derivatives of relative length changes are presented. For example, in Figure 2-1(c) a clear transition around 295 °C is observed for the cooling rate of 0.3 °C/s. Similarly, as can be seen in Figure 2-1(d) this transition is near the
martensite start temperature, therefore indicating the formation of martensite with this cooling rate. The results clearly show that three different transformations have taken place.
Figure 2-1(a) Dilatometric cooling curves of studied steel. Derivatives of relative length changes during cooling at cooling rates of (b) 0.08 °C/s, (c) 0.3 °C/s, and (d) 3 °C/s.
In Figure 2-1(a), for the cooling rate of 0.08 °C/s, the specimen contains 23% (phase fraction) of retained austenite and the rest is bainite. Using Figure 2-1(b), the bainite start (BS) and the bainite finish (Bf) temperatures were calculated to be 472 °C and 283 °C,
respectively. For the cooling rate of 3 °C/s, martensitic transformation starts (Ms) at 316 °C
and finishes (Mf) at 122 °C. This specimen is considered to be fully martensitic as no
retained austenite was detected in the XRD analysis (Talebi et al., 2017). In the case of mixed microstructure, the transformation starts with bainite formation at 468 °C and ends with martensite at 116 °C. The microstructure at this cooling rate contains 77% of bainite, 11% of martensite and 12% of retained austenite.
2.3.2 Tempering dilatometric curves
Non-isothermal tempering of the quenched samples was carried out with a heating rate of 10 °C/min until 600 °C for all starting microstructures. Different behaviors were observed in the dilatation curves depending on the starting microstructure as shown in Figure 2-2(a) and (b).
Figure 2-2. (a) Relative length changes, and (b) derivatives of relative length changes during non-isothermal tempering of bainitic, martensitic and mixture specimens with a heating rate
of 10 °C/min.
Carbon segregation, formation of transition carbides and precipitation of cementite were not identified with high-resolution dilatometry for tempered bainite. This is probably due to the small carbon content of bainite (0.19 wt.%) and auto-tempering effect of the microstructure during non-isothermal tempering (Talebi et al., 2017). The only revealed peak in the bainitic specimen is related to the retained austenite decomposition at 303 °C (stage 3 of the tempering process).
The pattern is reversed when it comes to the martensitic case. Since martensite contains 0.29 wt.% of carbon (Talebi et al., 2017), all the four stages of tempering mentioned in Introduction are normally expected to take place. Specifically, minor contraction due to carbon segregation, followed by another decrease due to precipitation of transition carbides ending below 215 °C were observed. Subsequently, a wide peak for cementite precipitation
was observed in the temperature range 240 °C to 450 °C. Finally, a small peak at 327 °C was observed in the cementite precipitation zone which probably corresponds to retained austenite decomposition.
In the specimen with mixed bainite and martensite microstructure, a linear behavior was observed between 215 °C and 325 °C. This length stability is assumed to be due to addition of two phenomena: (1) Contraction due to cementite formation in martensite, and (2) Expansion due to the decomposition of retained austenite which in this study is blocky shape and exists at the bainitic ferrite boundaries (Figure 2-3 (a)). Further temperature increase caused a length decrease from 326 °C. At this temperature, retained austenite decomposition is not finished yet; therefore, cementite precipitation (in the martensite) is probably the dominant phase transformation mechanism.
2.3.3 Length changes during tempering
As shown in Figure 2-2(a), independently of the heating rate employed, as the temperature increases a positive length change is observed. However, the length increase is not linear, and its amount varies with the starting microstructure. Table 2-1 summarizes the different length changes as a function of the starting microstructure. For example, it can be seen that during tempering of the bainitic specimen, specimen’s length increased by 12.4%. This increase is in fact the sum of thermal expansion of the material, due to temperature increase and decomposition of retained austenite during tempering. Considering that retained austenite decomposition is the only phenomenon occurring for bainitic specimens; if one assumes that all the retained austenite is decomposed during tempering, then its decomposition has resulted in +3.7% increase in total length. Further detailed analysis is required to confirm the above findings.
On the other hand, the tempering effect on martensitic specimen, which is the precipitation of carbides, has reduced the length by 6.5%. Adding this reduction to thermal expansion, total length increase of martensitic microstructure during non-isothermal tempering is 3.8%.
In the case of mixed microstructure, excluding the thermal expansion, the reduction of tempered martensite has overcome the increase of retained austenite (12%) decomposition, which finally leads to a length reduction of 3.1% that could be associated to the tempering process. The above findings are further confirmed by the analysis presented in Figure 2-2(b), where a clear slope change can be seen after 326 °C, due to cementite precipitation.
Table 2-1 Total length change during tempering from 25 °C to 600 °C and specific length change due to tempering phenomena
Specimen Total length change from 25 °C to 600 °C (%) tempering phenomena (%) Length change due to Bainitic (B=77%, RA=23%) +12.4 +3.7 Bainite/Martensite (B=74%, M=14%, RA=12%) +7.1 -3.1 Martensitic
(less than 5% RA) +3.8 -6.5
2.3.4 Microstructure evolution
The different microstructures obtained before and after non-isothermal tempering are depicted in Figure 2-3 which confirm the observations made on dilatometric curves. Figures 2-3 (a), (c), and (f) show that the microstructures obtained after applying cooling rates of 0.08 °C/s, 0.3 °C/s and 3 °C/s are bainite, mixed bainite/martensite, and full martensite, respectively. The retained austenite at the grain boundaries of the bainitic ferrite shown in Figure 2-3(a), decomposes to fresh bainite during non-isothermal tempering, as shown in Figure 2-3(b); thereby confirming that the peak observed in Figure 2-2(b) corresponds to austenite decomposition in a bainitic structure. This finding is also in agreement with those reported by Morra (Morra, Böttger et Mittemeijer, 2001). With an increase of the cooling rate to 0.3 °C/s, martensite forms alongside the bainite as shown in Figure 2-3(c).
After tempering of the mixed microstructure, carbides were observed in the martensitic region while bainitic sheaves became wider. In order to better illustrate the microstructural changes, SEM analysis was carried out at higher magnifications and examples are shown in Figure 2-3(d) for the bainitic zones and Figure 2-3(e) for the martensitic zones. It is interesting to note that, while dilatometric curve of tempered bainite did not show precipitation of carbides, they are clearly present in the tempered condition. One possibility could be that carbide coarsening has occurred during non-isothermal tempering. However, in order to confirm this finding, further work is required that is out of the scope of the present investigation.
Finally, SEM micrographs of Figure 2-3 (f) and (g) confirm that by increasing the cooling rate to 3 °C/s, martensite is the only phase present in the misconstrue. Upon heating up to 600 °C martensite plates grow and carbides are formed within them. The above behavior was also detected in the dilatometric curves and is in agreement with observations in the literature (Liu et al., 2016; Morra, Böttger et Mittemeijer, 2001).