ACTIVE CONTROL OF SEPARATION INDUCED DISTORTION
IN A SCALED TACTICAL AIRCRAFT INLET
by
ZACHARY WARFIELD
B.S. Mechanical Engineering University of Notre Dame, 1998
Submitted to the Department of Aeronautics and Astronautics in partial fulfillment of the requirements for the degree of
MASTER OF SCIENCE IN AERONAUTICS AND ASTRONAUTICS
at the
MASSACHUSETTS INSTITUTE OF TECHNOLOGY
September 2001
© Zachary Warfield, 2001. All rights reserved.
The author hereby grants to MIT the permission to reproduce and to distribute publicly paper and electronic copies of this thesis document in whole or in part
Author:
Zachary Warfield Department of Aeronautics and Astronautics
A July 24, 2001 Certified by: Dr. James Paduano Principal Researcher Thesis Supervisor Accepted by:
Wallace E. Vander Velde Professor of Aeronautics and Astronautics
Chair, Committee on Graduate Students
MASSACHUSET1S'INSTTUTE
OF TECHNOLOGY
-ACTIVE CONTROL OF SEPARATION INDUCED DISTORTION
IN A SCALED TACTICAL AIRCRAFT INLET
by
Zachary Warfield
Submitted to the Department of Aeronautics and Astronautics
on July 24, 2001 in Partial Fulfillment of the
Requirements for the Degree of Master of Science in Aeronautics and Astronautics
ABSTRACT
A one-sixth-scale tactical aircraft inlet was outfitted with actuators and sensors to study active control
of inlet separation. The inlet duct was serpentine shaped, which introduces adverse pressure gradients that cause separation. The separated flow induces distortion (non-axisymmetric total pressure profiles) with significant steady and unsteady components. Actuation consisted of four injector-valve assemblies, located downstream of the inlet, capable of modulating airflow in a 50-500 Hz bandwidth. Sensing consisted of steady and unsteady total pressure transducers at the aerodynamic interface plane (AIP) and hot-film heat flux sensors at the separation point in the inlet.
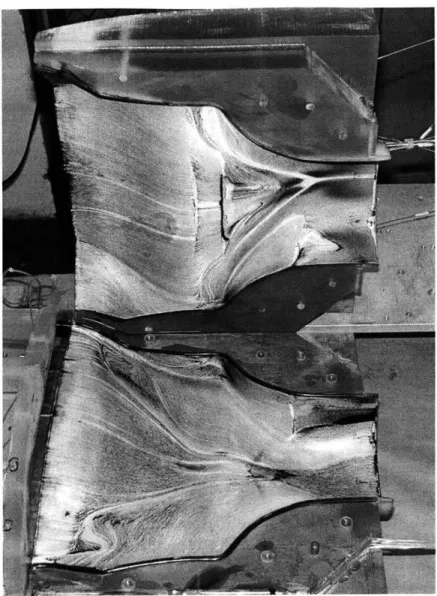
The first set of experiments focused on characterizing the flow within the inlet. The experiments included tests to visualize the steady component of inlet flow using oil-film surface visualization techniques, test to determine the steady-state pressure recovery profile at the AlP, and tests to correlate unsteady measurements between the separation point and AIP. Flow visualization results illustrate that the separated region in the inlet behaves like a textbook "owl-face" separation. An adverse pressure gradient causes flow reversal and subsequently vortices shed from the separation point. Pressure recovery data indicates that a large total pressure deficit exists in the upper quadrant of the AIP. This deficit is associated with losses in the separated flow. Correlation analyses between the separation point and the AIP sensors indicate a strong coherence between unsteadiness at these locations. Based on the results of these analyses, it appears that the separation point vortices shed in an alternating (left-right) pattern and are the source of AIP distortion.
To reduce flow unsteadiness at the separation point and the AIP, a series of narrow-bandwidth feedback control experiments were performed. These experiments involved measuring unsteady quantities at the separation point and AIP, passing these signals through a resonator filter to generate a command signal for the actuators, and applying actuation to the system via the downstream injectors. The results of these experiments indicate that feedback control is successful at locally canceling the measured quantity via superposition of acoustic waves at the feedback sensor location. It is also of interest to study the effect of feedback control on vortex shedding unsteadiness, and on the propagation of these vortices through the inlet. However, results to date have not shown that narrow band feedback couples to these dynamics in a beneficial way.
Thesis Supervisor: Dr. James Paduano Title: Principle Researcher
ACKNOWLEDGEMENTS
This project is supported by AFSOR contract #F49620-00-C-0035, as part of the DARPA Micro-Adaptive Flow Control Program. This financial support is gratefully acknowledged. Steve Walker is the technical monitor for the project and Rich Wlezien is the program manager.
First and foremost, I would like to acknowledge Dr. Jim Paduano for giving me the opportunity to participate in this research project. Aside from offering his technical expertise, I am in debt to Dr. Paduano for helping me focus on my research, thus making the timely completion of this thesis possible. I am also thankful to Prof. Ian Waitz for giving me much needed guidance during my first months at MIT. I am very thankful to Northrop Grumman and NASA Glenn for providing the UCAV inlet, instrumentation, and actuators necessary to perform my series of experiments.
Thanks to my family (my Mom and Paul, my Dad and Cindy, Grandma, Justin, Hannah, Aunt Pat and Uncle Harry, Aunt Cookie and Uncle Eddie, Sean and Heather, Duffy and Nissa, Eric and Susan, Kyle and Bridget, Harry, Sarah, Kylea, Khloe and Andrew) for always supporting me. I wish I could have made it home to Frederick more often, but MIT was a time consuming endeavor.
Many thanks to Dr. Gerald Guenette for sharing his technical and experimental experience by answering every question that came to my mind. Thanks to Michael Brear for lending his expertise to our research and for convincing me to take a few weeks off when (if) I graduate. Thanks to Jimmy Letendre and Jack Costa for teaching me how to weld, solder, plumb, and every other skill that was needed to get our rig running. Thanks to Victor Dubrowski for sharing his insightful philosophies along with his machining tips. Thanks to Prof. Epstein and Bill Ames for letting us run the De-Laval, even though it disturbed everyone in the building. Thanks to Lori Martinez for always letting me know when there were leftovers, and for not yelling at me when I kept asking for keys.
Thanks to all my peers at the GTL for making the work/research environment so enjoyable. I wish I could stick around to finish the summer softball season with Shuler, Dan ("Captain"), Spad, CP, Raff-dog, and the rest, but I am sure they will pick up a better player in free agency. Special thanks to the BDT team of Bret, Jameel, and Will for lending me tools and advice during the months we co-existed in the BDT experiment area. Thanks to my officemates Taek, Simon and Laurent for sharing in the thesis writing pains during our waning months together. Thanks to Steve Braddom for building the heat flux sensors, understanding the data acquisition system, and explaining to me how the military really works. Thank you Jeremy and Dave for showing me the ropes at MIT and for not laughing when I went on my philosophical/political rants. I would also like to thank my future wife for not meeting me at MIT... I don't think I would have graduated on time if you did.
Thanks to the good people at Nick's Roast Beef in Davis Square for supplying at least 50% of my diet in the form of their cheeseburger subs. Thanks also to Kateri Lafond for baking me cookies and providing me with invaluable fashion tips. Lastly, I must thank my roommates Jon Steele, Timm Fair and Alex Bruni (A-Rod) for convincing me to move to Boston and giving me a place to live. It may not have been like it was at ND, but I enjoyed every minute of my time at 72 Baystate Av., Apt. #2. Hey Timm, you know what...?
TABLE OF CONTENTS
A bstract...3
Acknowledgem ents...- . ---...5 Table of Contents... ...- 7 List of Tables...- . . ---... 11 List of Figures...-... . ---... 13 Nom enclature...--- ...--- ... - 17 1 Introduction...---... 211.1 Background and M otivation ... 21
1.2 Prior Research in Active Flow Control... 22
1.3 Research Objectives ... 23
1.4 Thesis Overview ... 24
2 Experim ental Setup ... 25
2.1 U CAV D iffuser ... 28
2.2 Instrum entation... 29
2.2.1 Unsteady Instrum entation... 30
2.2.1.1 Sensor Ring ... 30
2.2.1.2 U nsteady Instrum ent Can... 32
2.2.1.3 H ot-film Sensors ... 36
2.2.2 Steady Instrum entation ... 38
2.3 D ata Acquisition ... 38
2.3.1 Steady D ata Acquisition ... 39
2.3.1.1 H ardw are ... 39
2.3.1.2 Software ... 39
2.3.2 Unsteady D ata Acquisition ... 40
2.3.2.1 H ardware ... 40
2.3.2.2 Softw are ... 40
2.3.3 Spectrum Analyzer and Oscilloscope ... 41
2.4 Actuation System ... 41
2.4.1 Actuator D uct Design... 44
2.6 System Calibration...47
2.6.1 Throttle Plug Mass Flow Calibration ... ... 47
2.6.1.1 Calculating Mass Flow Through the Plug... 48
2.6.2 Bellm outh M ass Flow Calibration... 50
2.6.3 Unsteady Transducer Calibration ... 54
3 1-D Acoustic Model of Inlet...55
3.1 M odel M otivations and Lim itations ... 55
3.2 Modeling Techniques...56
3.3 Acoustic Model of Experimental Setup...58
3.3.1 AIP Injection to Pressure Transfer Function ... 59
3.4 C om pressor E m ulation ... 62
3.4.1 Im pedance of the Experim ental Setup... 63
3.4.2 Compressor Impedance without Injection... 64
3.4.3 Compressor Impedance with Injection... 66
3.4.4 Transfer Function for Compressor Emulation... 67
4 Inlet Flow Characterization... 69
4 .1 F low V isualization ... 69
4.2 Exam ination of Inlet Pressure Recovery ... 73
4.2.1 The Effects of Constant Actuation on Pressure Recovery ... 76
4.3 C haracterization of U nsteadiness ... 78
4.4 D evelopm ent of Bulk Param eters... 82
4 .5 T ransfer F unctions ... 85
4.5.1 Transfer Function from Actuators to Bulk Parameters... 86
4.5.2 Transfer Function from Hot-Film to Actuators ... 89
4.6 Time Delay Analysis...90
4.6.1 Time Delays Associated with Acoustic Wave Speed... 91
5 Active Flow Control... 93
5.1 Single Frequency Feedback Control... 95
5.1.1 R esonator Filter D esign ... 95
5.1.2 Results of Experim ental Control ... 97
5.1.3 T heoretical C ontrol M odel ... 106
5.2 Broadband Frequency Feedback Control ... 110
5.2.1 L Q G C om pensator D esign ... 111
5.2.2 T heoretical C ontrol M odel ... 114
5.2.3 L Q G E xperim ental R esults... 115
5.3 Feed-forw ard Controller D esign... 116
6 Conclusions... 119
6.2 A ctive Control of Flow Unsteadiness... 120
6.3 Future W ork and Recom m endations... 121
A ppendix A O perational Procedures... 125
A ppendix B Fabrication D raw ings... 133
A ppendic C Linearized Bulk Param eters... 137
A ppendix D M atlab Codes...143
LIST OF TABLES
Table 2.1 -Experiment Phase Description and Timeline... 27
Table 2.2 - Instrumentation to Data Acquisition Mapping for Feedback Control Experiments... 35
Table 2.3 - H ot-film Specifications ... 37
Table 2.4 - Servo Motor Transfer Function Parameters ... 43
Table 2.5 - M ass Flow Calibration Parameters ... 51
Table 3.1 - Transm ission M atrix Parameters... 57
Table 4.1 - Coherence Level Sym bols... 86
Table 4.2 - TF Parameters: Actuator Command Voltage to Magnitude BP... 87
Table 4.3 - TF Parameters: Actuator Command Voltage to Extent BP... 88
Table 4.4 - TF Parameters: Actuator Command Voltage to Hot-film... 90
Table 4.5 - Time Delays in the Feedback Control Experimental Setup ... 90
Table 4.6 - Acoustic Wave Time Delay Analysis ... 91
Table 5.1 - Summary of Results using Single Frequency Feedback Control... 99
Table 5.2 - Single Frequency Controller Input Parameters ... 99
Table 5.3 - LQR Compensator Transfer Function Parameters ... 113
Table 5.4 - Feed-forward Controller Nomenclature ... 117
Table A. 1 - De-Laval Compressor Operating Conditions during the Experiments... 130
LIST OF FIGURES
Figure 2.1 - Experimental Test Section ... 26
Figure 2.2 - Typical Configuration of the Test Section (Sensor Ring not shown)... 28
Figure 2.3 - Pro/E Rendering of Northrop Grumman UCAV ... 29
F igure 2.4 - Sen sor R ing ... 32
Figure 2.5 - Probe Layout of Instrument Can (View looking into IC)... 33
Figure 2.6 - Unsteady Pressure Instrument Can ... 35
Figure 2.7 - Hot-film Sensor Location ... 37
Figure 2.8 - Typical Actuator Servo Motor Transfer Function ... 42
Figure 2.9 - Actuation System Assembly ... 43
Figure 2.10 - A ctuator D uct D esign ... 45
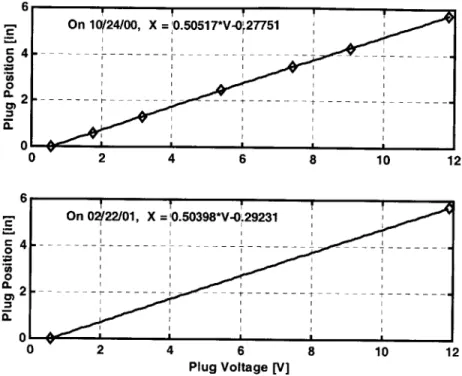
Figure 2.11 - Throttle Plug Voltage to Position Calibration ... 49
Figure 2.12 - Northrop Grumman Throttle Plug Calibration... 49
Figure 2.13 - B ellm outh C alibration... 53
Figure 2.14 - Verification of Bellmouth Calibration ... 53
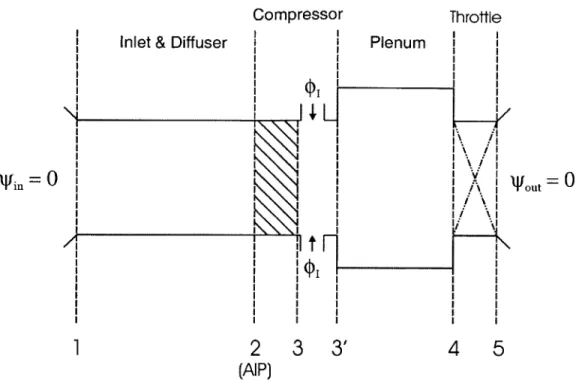
Figure 3.1 - Experiment Acoustic Model ... 59
Figure 3.2 -Actuator Injection to AIP Pressure Transfer Function V'AIP 6...62
01)
Figure 3.3 - Lumped Compressor Model ... 65Figure 3.4 - Compressor Emulation Transfer Function 0. ... 67
y
AIP) Figure 4.1 - Textbook Owl-Face Separation ... 70Figure 4.2 - Flow Visualization (Both Halves) ... 71
Figure 4.3 - Flow Direction in Flow Visualization Field ... 72
Figure 4.4 - Hot-film Placement in Flow Visualization Field ... 73
Figure 4.5 - AIP Total Pressure Profile, MIT Experiment ... 74
Figure 4.6 - AIP Total Pressure Profile, Northrop Grumman CFD... 75
Figure 4.7 - AIP Pressure Recovery as a Function of Mass Flow ... 76
Figure 4.9 - Characterization of Coherence and Cross-Correlation Between Hot-film
Measurements and AIP Total Pressure Probe 23... 80
Figure 4.10 - Characterization Coherence and Cross-Correlation Between Hot-film Measurements and AIP Total Pressure Probe 13... 80
Figure 4.11 - Characterization of Coherence and Cross-Correlation Between Hot-film Measurements and ALP Total Pressure Probe 83... 81
Figure 4.12 - Characterization of Coherence and Cross-Correlation Between AlP Total Pressure Probe 13 and AIP Total Pressure Probe 83 ... 81
Figure 4.13 - ARP-1420 Distortion Characterization... 84
Figure 4.14 - Actuator Command Voltage to Magnitude BP (psi-rad/V) TF... 87
Figure 4.15 - Actuator Command Voltage to Extent BP (rad/V) TF ... 88
Figure 4.16 - Actuator Command Voltage to Hot-film (V/V) TF... 89
Figure 5.1 - Physical Description of Active Control ... 94
Figure 5.2 - Single Frequency (100 Hz) Feedback Control of Magnitude ... 100
Figure 5.3 - Single Frequency (100 Hz) Feedback Control of Extent... 100
Figure 5.4 - Single Frequency (100 Hz) Feedback Control of Hot-film 4 ... 101
Figure 5.5 - Single Frequency (200 Hz) Feedback Control of Magnitude ... 101
Figure 5.6 - Single Frequency (200 Hz) Feedback Control of Extent... 102
Figure 5.7 - Single Frequency (200 Hz) Feedback Control of Hot-film 4 ... 102
Figure 5.8 - Single Frequency (300 Hz) Feedback Control of Magnitude ... 103
Figure 5.9 - Single Frequency (300 Hz) Feedback Control of Extent... 103
Figure 5.10 - Single Frequency (300 Hz) Feedback Control of Hot-film 4 ... 104
Figure 5.11 - Residual Effect on Magnitude by Reducing Extent (300 Hz) ... 104
Figure 5.12 - Residual Effect on Extent by Reducing Magnitude (100 Hz) ... 105
Figure 5.13 - Residual Effect on Magnitude by Reducing Hot-film 4 (300 Hz)... 105
Figure 5.14 - Residual Effect on Magnitude by Reducing Hot-film 4 (200 Hz)... 106
Figure 5.15 -Single Frequency Controller Schematic ... 107
Figure 5.16 - Theoretical Feedback Control @ 100Hz ... 109
Figure 5.17 - Theoretical Feedback Control @ 200Hz ... 109
Figure 5.18 - Theoretical Feedback Control @ 300Hz ... 110
Figure 5.19 - LQG Feedback Controller Schematic ... 111
Figure 5.20 - LQG Compensator Transfer Functions for the Bulk Parameters... 112
Figure 5.21 - LQG Compensator Transfer Function for the Hot-film... 113
Figure 5.23 - Experimental Results of Broadband LQG Controller on Magnitude BP... 115
Figure 5.24 - Feed-forward Controller Schematic... 116
Figure A. 1 - De-Laval Operating Chart... 129
Figure A.2 - Unsteady I.C. Calibration Setup ... 130
Figure A.3 - Throttle Plug Control System Schematic... 132
Figure B. 1 - Total Pressure Probe Fabrication Drawing ... 133
Figure B.2 - Actuator Duct Fabrication Drawing (Sheet 1) ... 134
Figure B.3 - Actuator Duct Fabrication Drawing (Sheet 2) ... 135
Figure B.4 - Sensor Ring Fabrication Drawing ... 136
Figure C. 1 - Linearized Bulk Parameter Schematic ... 137
NOMENCLATURE
ACRONYMS:
MAFC Micro Adaptive Flow Control
MIT Massachusetts Institute of Technology
GTL Gas Turbine Laboratory
NASA National Aeronautics and Space Administration DARPA Defense Advanced Research Programs Administration
UCAV Uninhabited Combat Air Vehicle
RMS Root Mean Square
AIP Aerodynamic Interface Plane
PR Pressure Recovery
MIMO Multiple Input Multiple Output
SISO Single Input Single Output
IC Instrument Can
SDIU Scan-valve Digital Interface Unit
MFF Mass Flow Factor
CFD Computational Fluid Dynamics
PSD Power Spectral Density
ROMAN:
L Length
M Mach number
rh Mass flow rate
P Pressure
R Universal Gas Constant
A Area; Magnitude Bulk Parameter T Temperature, Transmission Matrix
a Speed of Sound
V Velocity
u Time average x component of velocity R Universal Gas Constant
GREEK:
, Non-dimensional Pressure , CD Non-dimensional Velocity
y Ratio of specific heats
p Density
A Location Bulk Parameter
E
Extent Bulk Parametertr Time Delay
o
Angular Distance to Angular Velocity 8 Perturbation Operator SUBSCRIPTS: A Axialout Exit condition
in Inlet condition
S Static
oo Ambient
T Total
Act Actuator Duct
BM Bell-mouth
Diff Diffuser
SR Sensor Ring
IC Instrument Can
Plug Throttle Plug
AD Acoustic Duct Thrt Throttle LP Lumped Plenum Comp Compressor REF Reference I Injection BP Bulk Parameter HF Hot-film
1
INTRODUCTION
1.1
BACKGROUND AND MOTIVATION
The propulsive systems of most tactical military aircraft include some form of inlet to condition the airflow before it reaches the compressor. The purpose of the inlet is to ensure that the airflow delivered to the compressor is adequate for successful compressor operation. This relationship between inlet flow and the compression system is outlined in AIR-1419: Inlet Total-Pressure-Distortion Considerations for Gas-Turbine Engines [21] and ARP-1420: Gas Turbine Engine Inlet Flow Distortion Guidelines [12]. These documents discuss acceptable levels of distortion delivered
by inlets and the effect of this inlet distortion on compressor performance.
The overall purpose of this thesis is to study and control the behavior of distortion unsteadiness in a tactical aircraft inlet. The research that constitutes this thesis describes a portion of a joint research project between the Massachusetts Institute of Technology (MIT), Caltech, NASA Glenn and Northrop Grumman. The aircraft inlet that serves as the test section for this project is part of a Northrop Grumman uninhabited combat air vehicle (UCAV) prototype. Due to certain design requirements such as radar signature, UCAV performance depends heavily on the inlet design. The radar signature requirement implies that these aircraft must be able to fly without detection from radar. Therefore, the compressor blades must not be visible (via radar) from the exterior of the vehicle. This requirement leads to the curved (S-shaped) inlet design shown in Figure 2.3. The bi-product of a curved inlet is potentially poor flow properties at the Aerodynamic Interface Plane (AIP) or increased inlet length. In order to curve the flow without causing loss of pressure recovery, the inlet must be relatively long. Conversely, if inlet length is decreased then the flow properties suffer. Therefore, inlet length and the quality of the inlet flow are traded when designing these types of inlets.
The length of the propulsion system in the UAV often dictates its size and consequently the mass of the vehicle. Therefore, a reduction in inlet length results in either increased payload capacity or
increased fuel efficiency. Similarly, an improvement in the flow properties (pressure recovery and unsteadiness) at the AIP increases the propulsive efficiency of the system. Improved propulsive efficiency leads to higher vehicle thrust or better maneuverability. Additionally, reduction of distortion at the compressor face may lead to lower stall margins, thus improving the designed capabilities of the propulsion system. As mentioned earlier reduction of inlet length and the quality of the flow properties are inversely related. Therefore, realizing the performance benefits associated with both of these improvements requires an enabling technology. This project attempts to improve both pressure recovery and steady and unsteady distortion caused by the short, curved inlet geometry. The approach used to improve these conditions will be to apply active flow control at both the compressor face and the separation point.
1.2
PRIOR RESEARCH IN ACTIVE FLOW CONTROL
The flow structure in the UCAV inlet consists of a region of separated flow caused by the inlet's curved profile. The energy losses associated with boundary layer separation account for the poor flow properties at the AIP. Mohamad Gad-el-Hak's 1991 article titled "Separation Control: Review" [27] gives a comprehensive description of flow separation and previous techniques for control. This article identifies that both steady and unsteady separation exists in three-dimensional flows such as the UCAV inlet. Gad-el-Hak's article presents a review of the methods used to control the steady separation. These methods include shaping the inlet geometry to eliminate adverse pressure gradients and changing the velocity profile at the wall by withdrawing near wall fluid through slots or by wall heat transfer. These methods are classified as steady because the mechanism used to control the separation is constant. More recently, a joint venture by Lockheed Martin and NASA Glenn involved research into new methods of steady separation control. In a paper presented at the 2 2nd International
Congress of the Aeronautical Sciences [26], a technique using 36 co-rotating microvane vortex generators is shown to have positive effects on the pressure recovery and spatial distortion. These results demonstrate the effectiveness of suppressing steady separation via steady control in high Mach number flows (M = 0.60).
In addition to the work by Lockheed Martin and NASA Glenn, research has been performed to control steady separation via unsteady control. This research, performed at the United Technologies Research Center, uses "directed synthetic jets" [28] located at the separation point. These jets periodically excite the leading edge of separation using oscillating slot flow. In McCormick's article
[28] it was shown that directed synthetic jets can fully suppress steady separation of subsonic flows
(M = 0.05).
The overall goal of this research project is to eliminate or reduce both the steady and unsteady effects of separation in the UCAV inlet. The experiments mentioned above describe methods for controlling steady separation, however, very few results are known pertaining to the control of unsteady separation. In fact, a study by Kwong and Dowling [23] concluded that steady injection could cause unsteady oscillations in the flow to become larger. This research attempts to examine methods for controlling unsteady separation, while at the same time reducing steady separation. The mechanism proposed to mitigate unsteady separation is an actuation system located at the compressor face. Prior research at MIT uses compressor face actuation to stabilize and control rotating stall [5,6,10]. However, the potential effect of such actuation (downstream of the separation point) on separation unsteadiness is unknown. In particular, the physical mechanism by which active control influences the upstream flow field has not been explained. However, research by Cho [25], aimed at reducing inlet distortion using downstream speakers, indicates that it is physically possible to alter inlet flows using global (acoustic) rather than local actuation. Research by Kwong and Dowling [23] support this by showing that feedback control of unsteady blowing successfully reduces unsteadiness in conical and rectangular diffusers.
This thesis focuses on the use of unsteady feedback control to reduce separation unsteadiness in a tactical aircraft inlet. The feedback control techniques in this thesis are similar to those employed by Kwong and Dowling. The main difference is that this research attempts to control separation unsteadiness from downstream of the inlet separation point. Other differences include; the fact that the test section in this research is an industrially designed three-dimensional inlet, the Mach number in the UCAV inlet is high (M ~ 0.60), and the frequency bandwidth of the unsteadiness is high
(200-500 Hz).
1.3
RESEARCH OBJECTIVES
The objective of this research is to determine if flow control using actuators at the compressor face can improve the flow properties of a UCAV inlet. More specifically, the goal is to experimentally determine if the introduction of planar acoustic waves downstream of the inlet can be used to reduce unsteadiness caused by flow separation. Both open loop and closed loop means of actuation are
tested. However, the main focus is on feedback control approaches. Given this goal, this thesis concentrates on two areas of research: characterizing inlet unsteadiness and feedback control experiments designed to suppress this unsteadiness.
1.4
THESIS OVERVIEW
The remainder of this thesis focuses on four topics: MIT's experimental setup, acoustic modeling of the UCAV inlet test section, characterization of the flow in the test section, and active control of flow unsteadiness. Since this research is experimentally based, Chapter 2 provides a detailed description of the experimental setup used to test flow control in the Northrop Grumman UCAV. Chapter 3 addresses the acoustic modeling of the inlet test section. The 1-D acoustic model developed in this chapter is used to gain understanding of the acoustics in the test section. Switching back to the experiments, Chapter 4 discusses the series of experiments performed to characterize the flow properties in the UCAV inlet. This chapter includes flow visualization of the separated region, characterization of the separation unsteadiness, development of bulk parameters to quantify unsteadiness at the AIP, and the experimental construction of transfer functions between the actuators and sensors. Chapter 5 concentrates on feedback control of unsteadiness in the inlet from downstream actuators. This chapter includes experimental results from simplified control laws, as well as a theoretical development of more complex control systems. Finally Chapter 6 provides a summary of the experimental results and conclusions.
2
EXPERIMENTAL SETUP
This thesis focuses on a series of active control experiments performed on the unsteady flow in a
UCAV inlet. The experimental setup, located at the MIT Gas Turbine Laboratory (GTL), consists of
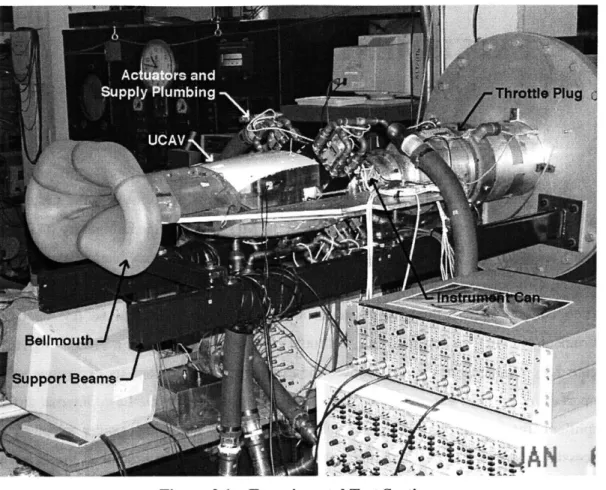
various subsystems. The test section, shown in Figure 2.1, is a combination of components from Northrop Grumman and NASA Glenn, as well as parts designed and fabricated at MIT. The test section consists of a bellmouth, a one-sixth-scale Northrop Grumman UCAV inlet diffuser, an instrument can (IC), an actuator duct, a throttle plug, and when needed a sensor ring (not shown in Figure 2.1). Aside from the test section, the experimental setup consists of various subsystems to support the active flow experiments. These subsystems include the De-Laval internal airflow system, amplifiers, the control law hardware system, air supply plumbing, power supplies, and signal processing instrumentation. Although all of these subsystems are crucial to the experiments, this chapter focuses only on the test section components and the data acquisition systems. Other elements of the experiment are briefly reviewed here and are discussed in more detail in Appendix A.
To perform high Mach number experiments (M - 0.65) on the scaled UCAV inlet, a downstream suction source must pull air through the inlet at rates in the range of 2.5-3.7 lb/s. The turbomachinery used to create this suction supply is the De-Laval compressor located in the basement of the GTL. The flow path is an open loop system; air is drawn into the UCAV inlet via the bell-mouth, flows through the De-Laval compressor, and is expelled through an exhaust pipe located on the roof of the
GTL. Section A.3 contains a detailed description on how to operate the De-Laval turbomachinery
Figure 2.1 - Experimental Test Section
Due to the high cost and fragility of the test section components, the method used to mount the test section to the De-Laval ducting determined the overall layout (see Figure 2.1). A throttle plug
attaches to a suction supply duct via an adapter plate designed specifically for this experimental setup. Two cantilevered beams bolted to this adapter plate support the throttle plug, the UCAV wing-plate and the interface between the actuator duct and instrument can. This support structure configuration isolates the experimental setup from the ground, thus minimizing shear and bending stresses at the component interfaces. The cantilevered support also allows for easy access to all of the components within the test section. This feature proved to be very valuable during configuration changes and when plumbing the actuator air supply.
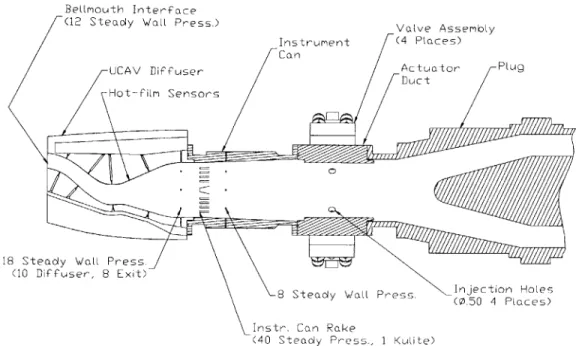
Depending on the purpose of the experiment being performed, the configuration of the sensor ring, actuator duct and IC may vary within the test section. For example, the experiments performed to characterize the AIP unsteady total pressure used the unsteady IC as the AIP measurement source, while feedback flow control experiments require the use of the sensor ring in place of the IC. Figure
2.2 shows the configuration used for the unsteady flow characterization experiments. Table 2.1 lists the configurations used for the various experiments.
Component Configuration Experiment Description Dates
Bellmouth, Diffuser, Steady IC, Throttle Measurement of the steady 11/9/00 - 11/21/00 Plug pressure profile at the AlP.
Bellmouth, Diffuser, Steady IC, Throttle 1 Flow Visualization 11/27/00
Plug Experiment
Bellmouth, Diffuser, Sensor Ring, Unsteady flow characterization
Bellm uth Thler Pnrg, tusing sensor ring (static and 11/30/00 - 12/22/00
Steay IC ThrttlePlugtotal pressure).
Test effects of constant
. Dactuation on AIP pressure
Actuator Duct, Steady IC, Throttle Plug rove Measure unstensor 1901 - 2/12/01 ring (total and static pressure).
2nd Flow Visualization
Bellmouth, Diffuser, Sensor Ring*, Experiment. Starred (*)3801 - 3/1201 Actuator Duct*, Throttle Plug components used to replace
displaced length of IC.
Unsteady flow characterization
Bell-mouth Diffuser, Unsteady IC, using unsteady instrument can.
Actuator Duct, Throttle Plug These experiments include 3/23/01 - 5/24/01
unsteady AIP movies and building of transfer functions.
Bell-mouth, Diffuser, Sensor Ring, Feedback Control Experiments 6/27/01 - 7/17/01
Actuator Duct, Throttle PlugerimentPhaseDescriptionandTimeline
Belmouth Interface
18 Steady Wat Press. (10 Diffuser, 8 Exit)
\_Instr. Can Rake
(40 Steady Press., 1 Kutite)
Figure 2.2 - Typical Configuration of the Test Section (Sensor Ring not shown)
The following sections describe the components that constitute the experimental test section. This chapter also discusses the systems used to acquire data and monitor the operation of the experimental setup. Lastly, this chapter describes the various calibrations required to set the experimental conditions and record data.
2.1
UCAV DIFFUSER
The tactical aircraft inlet used in the active flow control experiments at MIT is the inlet from a Northrop Grumman UCAV prototype, shown in Figure 2.3. This inlet, chosen because of the potential benefits that flow control technology offers, is S-shaped with a length to diameter ratio of approximately 2.6. The inlet is part of a one-sixth-scale wind tunnel model of an entire UCAV vehicle fabricated out of epoxy resin via stereo-lithography. Along with the UCAV vehicle, Northrop Grumman also furnished MIT with an epoxy resin bellmouth. The bellmouth is used to simulate flow into the inlet diffuser during cruise conditions. The UCAV inlet is equipped with eighteen static wall pressure taps; eight evenly spaced circumferentially at the AlP, six along the axial centerline of the inlet and two taps on each side of the inlet. The bellmouth, shown in Figure 2.1, is equipped with ten static wall pressure taps located around the exit of the bell-shaped section. These taps prove useful in calibrating the bellmouth mass flow, described in Section 2.6.2.
The UCAV supplied to MIT contains the first generation of inlet designs for Northrop's UCAV vehicle. The geometry of the inlet is not optimal for AIP pressure recovery. In fact, later versions of the Northrop UCAV design demonstrate improved pressure recovery properties compared to this inlet. However, the non-optimal design is a better test subject to demonstrate the benefits of active flow control because of its poor flow characteristics.
Figure 2.3 - Pro/E Rendering of Northrop Grumman UCAV
2.2
INSTRUMENTATION
The instrumentation used in the UCAV inlet experiments can be classified into two categories, instrumentation for steady measurements and instrumentation for unsteady measurements. The steady instrumentation includes forty total pressure probes located in a steady IC and numerous wall static pressure taps located in the diffuser and bellmouth. The unsteady instrumentation includes hot-film sensors located in the region of flow separation, forty total pressure probes in an unsteady IC1
Both instrument cans have the same mounting interfaces, so either the steady or unsteady IC can be used during an experiment.
and up to eight pressure probes located in the sensor ring. See Figure 2.2 for the locations of these sensors.
2.2.1
UNSTEADY INSTRUMENTATIONSince this research pertains to high Mach number flows, with high levels of unsteadiness, the instrumentation used to measure the inlet flow must capture time varying perturbations in the flow. Due to the limited bandwidth of the actuators, the characteristic frequencies of interest for this research are less than 1 kHz. To guarantee accuracy in the measurement and logging of unsteady data, the instrumentation and data acquisition systems were chosen to operate at rates greater than 5 kHz. Therefore, signal-processing problems associated with aliasing at relevant frequencies are avoided.
Unlike most of the steady instrumentation, the location of the unsteady instrumentation is not fixed within the test section. Placement of the hot-films, sensor ring probes and to a limited degree the unsteady IC are flexible within the test section. Since the purpose of this research is to study the effect of separation control on distortion, the two obvious locations of interest for measuring unsteadiness are the AIP and the separation point. The devices used to measure unsteady pressure at the AIP are the unsteady IC and the sensor ring, while hot-film sensors measure unsteadiness at the separation point. In some configurations, specifically those employing both the IC and the sensor ring, a third location for taking unsteady measurements possible. As previously discussed in Table 2.1, the IC can be used to characterize the unsteady flow while the sensor ring is used for feedback control. Chapters 4 and 5 discuss reasons for each variant of the experimental configuration. The following sections briefly describe each unsteady component.
2.2.1.1 SENSOR RING
The sensor ring provides great flexibility within the test section for measuring unsteady data. The original purpose of the sensor ring was to supplement the unsteady IC by allowing the placement of additional unsteady sensors at various locations in the setup. However, during the course of the experiments the sensor ring became not only a supplement to, but also a substitute for the unsteady
IC. The axial length of the sensor ring is short, 1.3 in., to minimize its impact on the layout the test
section. The reduced length of the sensor ring and lack of mounting flanges (see Figure B.4) enables its placement between any of the components in the test section. Since the sensor ring contains no
mounting flanges, it relies on a compression fit between its two mating components. For instance, in the configuration shown in Figure 2.4, telescoping bolts from the UCAV to the actuator duct flange supply the mating force to support the sensor ring.
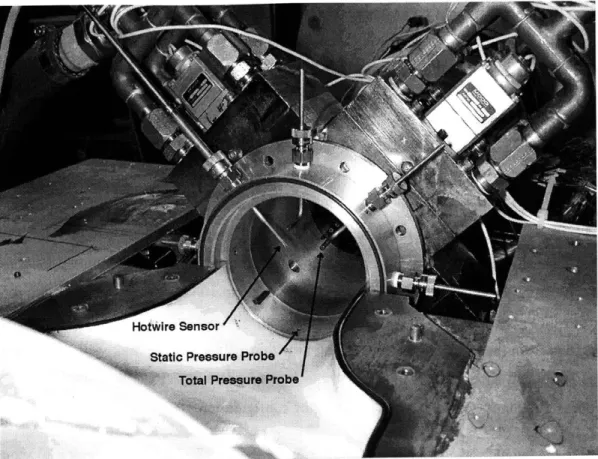
The sensor ring features eight evenly spaced, radial probe holes. Each hole is designed to accommodate a 1/8-inch diameter probe supported by a 1/8" NPT fitting. The three types of probes used in the sensor ring are total pressure, static pressure and hot-wire. The hot-wire data proved irrelevant for this thesis; therefore no further discussion of the hot-wire setup is necessary. The total and static pressure probes, both fabricated at MIT of 1/8-inch steel tubing (see Figure B.1), connect to 5-psi unsteady pressure transducers (Kulites). These transducers can accurately measure unsteady total pressure perturbations in a frequency range of up to 10 kHz. The static pressure probes mount flush with the inner duct wall, while the total pressure probes can be manually traversed in the radial direction from the center of the sensor ring to within 1/2-inch of the duct wall. The sensor ring can also be rotated about its axis of symmetry to accommodate any circumferential configuration of the probes. See Figure 2.4 for a typical sensor ring configuration.
Due to the length of the pressure probes (3.5 in. for the total and 2.5 in. for the static) acoustic modes generated in the probes appear in the 3000-5000 Hz range. This source of measurement error is acceptable for this research because the frequencies of interest in these experiments are less than 1000 Hz. However, future research may require higher frequency measurements, in which case the sensor ring will be ineffective.
Figure 2.4 - Sensor Ring
2.2.1.2 UNSTEADY INSTRUMENT CAN
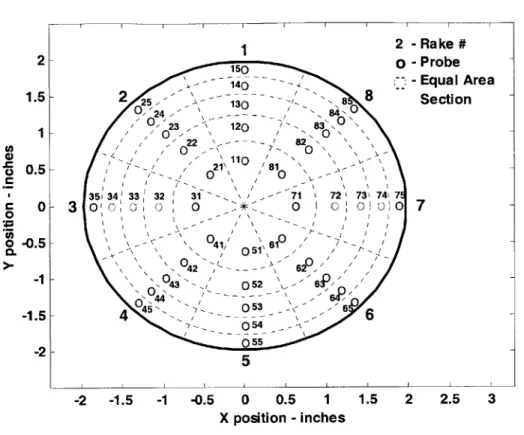
In order to measure the pressure at the AIP, Northrop Grumman designed an instrument can containing forty total pressure probes. The layout of the probes within the instrument can, shown in Figure 2.5, complies with Section 7.2.2 of ARP-1420: Gas Turbine Engine Inlet Flow Distortion Guidelines [12]. This layout locates each probe at the centroid of an equal area section of the duct. Therefore, the total pressure recovery at the AIP is simply the average of the measured total pressures at the forty probes, divided by the ambient inlet pressure.
1 2 ake # robe qual Area ection 2- 1.5--2 -1.5 -1 -0.5 0 0.5 1 X position - inches 1.5 2 2.5 3
Figure 2.5 - Probe Layout of Instrument Can (View looking into IC)
Northrop Grumman provided MIT with two such instrument cans, the first equipped with steady pressure probes and the second equipped with unsteady probes. The steady IC was used to obtain pressure recovery information under various flow conditions and create color contour maps of the total pressure at the AIP. This information helped validate the experimental setup by comparing MIT experimental results to the Northrop Grumman CFD solutions and experimental data (see Chapter 4). After using the steady IC to validate the experimental setup and its operation2, Northrop Grumman
supplied MIT with the unsteady IC.
The unsteady instrument can is equipped with forty unsteady differential pressure transducers, each with the capability of measuring perturbations up to 10 kHz. The unsteady IC also contains forty
2 During the initial runs of the De-Laval compressor, the threat of surge was considered too high to risk using the more expensive unsteady IC. Once a high level of confidence in the De-Laval turbomachinery and operational sequences was attained, there was no risk in using the unsteady IC.
150 0 -33 3 ' 3 -~ - 71 7E3 - 4 2 3 \25\ 8 8 24 ---- 8 023" 120 83 022 -82 1110 021\ /810 35 34 33 32 31 71 72 73 74 7 3 0 0 o o 7 051\ 42 -620/ 043 - 052 \, 63/ 055 5 1 In 0 0 0.5 OF -0.5
F
-1 -1.5F
-2 V I - Fsteady pressure probes that perform the same function as the steady IC. The transducers in the unsteady IC have the capability of measuring D/C pressure levels. However, these transducers display high D/C drift rates during calibration. To eliminate this drift, the signal from the unsteady
transducers is A/C coupled by the amplifiers. The steady pressure probes in the unsteady IC are then used to measure the D/C portion of the total pressure. Thus, the total pressure is the combination of the A/C coupled data from the unsteady transducers and the D/C level measured by the steady probes. Figure 2.5 shows the probe layout in the instrument can. One of the transducers in the unsteady IC,
probe 23, has a scaling problem in its output. The transient output from this probe is approximately an order of magnitude less than the other probes. Unfortunately, the location of probe 23 makes it important for characterizing the AIP distortion. Therefore, the scaling error must be accounted for in the post-processing of the data by multiplying the output by a scaling factor. The appropriate scaling factor is determined by comparing the RMS values of probe 23 with those of probes 22, 82 and 833.
The transducers in the sensor ring and/or the unsteady IC connect to a bank of 2310 Strain Gage Conditioning Amplifiers, made by the Instruments Division of Measurements Group, Inc. These amplifiers perform the dual function of filtering the unsteady data and conditioning the output signal before it is recorded by the data acquisition system. The amplifiers condition the input signal in accordance with the calibration discussed in Section 2.6.3. The calibration of the unsteady transducers involves individually tuning each amplifier gain such that the output voltage from each amplifier has a one-to-one correspondence with the transducer pressure measurement. Therefore, the resulting calibration constant is I V/psi.
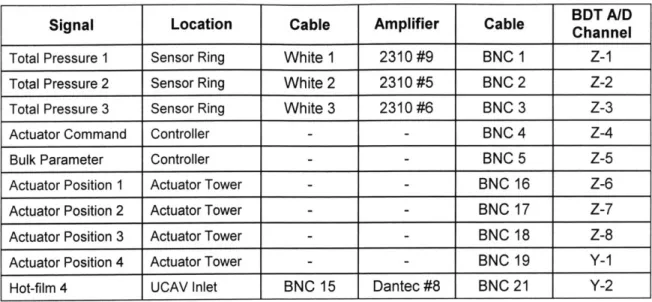
The cables used to connect the IC transducers to the amplifiers were fabricated at MIT. These cables mate to the ITT strip connectors on the unsteady IC (see Figure 2.6). The cable mapping schematic from the IC transducers to the amplifiers and from the amplifiers to the data acquisition system is very important to accurately reduce the unsteady data. This mapping information must be recorded for each experiment. Likewise, the mapping of the steady pressure tubing from the IC to the steady data Scani-valve transducer ports must be recorded for each experiment. Table 2.2 is an example of the unsteady data acquisition mapping for the feedback control experiments.
3 Probe 22 is used for comparison because of its relative location to probe 23. Probes 82 and 83 are used because they are
Signal Location Cable Amplifier Cable BC anne
Total Pressure 1 Sensor Ring White 1 2310 #9 BNC 1 Z-1 Total Pressure 2 Sensor Ring White 2 2310 #5 BNC 2 Z-2 Total Pressure 3 Sensor Ring White 3 2310 #6 BNC 3 Z-3
Actuator Command Controller - - BNC 4 Z-4
Bulk Parameter Controller - - BNC 5 Z-5
Actuator Position 1 Actuator Tower - - BNC 16 Z-6
Actuator Position 2 Actuator Tower - - BNC 17 Z-7
Actuator Position 3 Actuator Tower - - BNC 18 Z-8
Actuator Position 4 Actuator Tower - - BNC 19 Y-1
Hot-film 4 UCAV Inlet BNC 15 Dantec #8 BNC 21 Y-2 Table 2.2 - Instrumentation to Data Acquisition Mapping for Feedback Control Experiments
2.2.1.3 HOT-FILM SENSORS
In order to analyze the relationship between inlet separation and total pressure at the AIP, it is necessary to place hot-film sensors in the separated region of the inlet. Due to the limited number of film sensors available, selecting the placement of these sensors is crucial. To ensure that the hot-film sensors capture the separation flow characteristics, the results of the flow visualization experiments (Section 4.1) were studied to determine the sensor locations with the greatest potential for capturing unsteady shedding events. The white "X's" in Figure 4.4 indicate where the sensors were placed based on flow visualization. Figure 2.7 shows the actual locations of the hot-film sensors on the upper inlet surface. Michael Brear [9], who has experience with this flow visualization technique, assisted in these experiments and helped in selecting the sensor locations. Steve Braddom installed the five hot-film sensors.
The hot-film sensors are SENFLEX SF9902 single element shear stress sensors. Hot-film sensors measure the instantaneous wall shear stress by relating the shear stress to the thermal dissipation through the constant temperature anemometer. In order to maintain constant temperature, the current across the film must vary to account for changes in the hot-film resistance. These changes in hot-film resistance are due to direct relationship between temperature and electrical resistivity. As the shear stress increases the thermal dissipation from the hot-film increases, causing the hot-film temperature to decrease. The temperature decrease lowers the electrical resistance of the hot-film circuitry, thus requiring more current to maintain constant voltage. Kenneth Kalumuck's Ph.D. [17] contains a detailed description of hot-film sensor theory. Table 2.3 lists the important hot-film specifications necessary to use the sensors.
The active portion of each hot-film sensor is a . 004 in. wide by .057 in. long by .20 pm thick nickel element. These elements connect to .0005 in. thick by .030 in. wide copper leads; both the element and wires mount to a polyamide substrate (dark maroon color). As shown in Figure 2.7, kapton tape (translucent yellow tape) shields the wire signal leads from the inlet flow. The outputs of the hot-film sensors connect to a bank of Dantec constant temperature anemometers. The anemometers control the overheat ratio, gain and filter settings. Switching the control setting on the anemometers to "flow" activates the hot-film sensors. Note that the hot-film sensors should only be activated when the experiment is running. Otherwise, the hot-film elements may overheat and become defective. The total thickness of the hot-film sensor is important because of its potential influence on separation.
layer thickness, then the hot-film will act like a trip wire for the flow. Although no rigorous calculations were performed, it is assumed that the boundary layer thickness is on the order of one millimeter. Therefore, the thickness of the sensor (115 pn) does not have an effect on the separation properties in the inlet.
Parameter Value Description
TRC 0.0235 (YOC Temperature Coefficient of Resistance
R
4.9 12 Ambient Condition Resistance for Hot-film #3R
6.112 Ambient Condition Resistance for Hot-film #4OH 1.5 Overheat Ratio (Ratio of Hot-film to Ambient Resistances)
y 115 pm Total Thickness of Hot-films (including Glue and Leads)
Table 2.3 - Hot-film Specifications
2.2.2
STEADY
INSTRUMENTATIONThe steady instrumentation serves three purposes: providing total pressure measurements at the AIP, determining the mass flow through the test section, and identifying the operating conditions of the De-Laval compressor. A Scani-valve differential pressure transducer takes all of the steady pressure measurements. The Scani-valve has forty-eight available ports, of which one port is used to measure ambient pressure and two ports (3 and 6) are non-functional. The remaining forty-five ports are allocated to the various steady pressure probes, depending on the purpose of the experiment. The Scani-valve has two modes of operation, measuring steady pressure continuously at a single port or incrementally stepping through all forty-eight ports. For these experiments the incremental stepping mode is used.
The steady pressure probes in the experimental setup include forty total pressure probes located in both instrument can rakes, sixteen wall static pressure taps in the inlet, ten wall static pressure taps in the bellmouth, a static pressure tap downstream of the throttle plug, and two taps to measure the inlet and exit pressure of the De-Laval compressor. Only five pressure measurements are required during all experiments; the static pressure downstream of the throttle plug, the De-Laval inlet and exit pressures, and two static pressure taps in the bellmouth. The pressure measurement downstream of the throttle plug is used to determine if the throttle plug is choked. The ratio of throttle inlet pressure (assumed to ambient) to throttle exit pressure must be greater than 2.0 to guarantee choked flow through the plug. Choking the throttle plug is required to ensure accuracy of the throttle plug calibration (see Section 2.6.1). The measurement of the De-Laval inlet and exit static pressures enables the operator of the experiment to determine the pressure ratio across the De-Laval compressor. This pressure ratio indicates the operating point of the De-Laval compressor (see Appendix A). The bellmouth static pressure taps are used to determine the mass flow through the bellmouth (see Section 2.6.2). A typical experiment configuration uses the five Scani-valve ports for the pressure measurements listed above, and forty ports for the AIP pressure measurements in the IC.
2.3
DATA ACQUISITION
As for the instrumentation, there are two separate data acquisition systems in the experimental setup, steady data acquisition and unsteady data acquisition. Additionally, various aspects of the data acquisition systems are classified as being either hardware or software.
2.3.1
STEADY DATA ACQUISITION
2.3.1.1 HARDWARE
The Scan-valve Digital Interface Unit (SDIU) is responsible for controlling the Scani-valve transducer and displaying the output of the Scani-valve transducer. An executable program (see Section 2.3.1.2) running on a PC remotely controls the SDIU. The SDIU processes commands from the executable program, including homing the Scani-valve and triggering data acquisition. The SDIU performs the steady pressure data acquisition and converts the transducer analog response to absolute pressure. The PC then writes the pressure data from the SDIU to a MATLAB variable (.mat) file.
2.3.1.2 SOFTWARE
The software program used to control the SDIU is called scanmanw.exe. Dr. Jim Paduano maintains this program, which is compiled in "C" programming language. The executable program prompts the user for various input data, such as ambient pressure, ambient temperature, and plug voltage. Then, the program initializes the system by setting the Scani-valve port to its home position. Finally, the program supplies the SDIU with the steady pressure calibration coefficients and the data acquisition rate4. The calibration of the SDIU / Scani-valve system was performed for earlier research, thus this experimental setup inherited a fully calibrated system. A data acquisition rate of two ports per second is used for these experiments. This rate is chosen to balance total acquisition time (24 sec) with adequate transducer accuracy. The transducer accuracy decreases as the data acquisition rate increases.
After the initialization steps are completed, the program prompts the operator to either trigger data acquisition, consisting of a complete cycle through each of the forty-eight ports, or quit the program and save the data. Unlike the unsteady data acquisition system, the steady software stores multiple experiment runs in a single data file. For example, if an experiment consists of six different data sets, then six unsteady data files and one steady data file containing the steady data of each of the six runs.
4 The Scani-valve transducer scans through the forty-eight available ports at variable step rate ranging form one to eight
ports per second. The error in the transducer measurement decreases for lower step rates because of the settling time in the transducer.
Aside from commanding the SDIU and writing the data to a file, the scanmanw.exe program performs much of the steady pressure data reduction. The Scani-valve is a differential pressure transducer, and for these experiments the backpressure is atmospheric. Therefore, the pressure output of the SDIU is the difference between the measured pressure and ambient pressure. The scanmanw.exe program takes this pressure difference and computes the absolute pressure, of every port, by adding the input ambient pressure5. The program then calculates the bellmouth mass flow (see Section 2.6.2), the De-Laval compressor pressure ratio, and the throttle plug pressure ratio. Finally, the program uses the throttle plug pressure ratio and the throttle plug position (from a linear displacement transducer) to determine if the throttle is choked. If the plug is choked, then scanmanw.exe calculates the mass plug mass flow (see Section 2.6.1). All of these reduced quantities, along with the absolute pressure of each Scani-valve port are saved in a MATLAB variable file.
2.3.2 UNSTEADY DATA ACQUISITION
2.3.2.1 HARDWARE
To capture the data from the unsteady IC and hot-films a high-speed data acquisition system is required. The original high-speed system, consisting of two multiplexed AID cards, proved to be unreliable. Therefore, the thoroughly tested data acquisition system from the Blow Down Turbine (BDT) is used for the A/D conversion of the unsteady response signals. The A/D converters have a variable peak-to-peak voltage setting; a setting of ±5V is used for these experiments. The only drawback of the BDT system is the lack of available channels for recording data (maximum of sixteen). This constraint is severe because, of the eight five-probe rakes in the unsteady IC, it is only possible to record the measurements of three rakes per experiment. This limitation only affects the characterization of AIP total pressure unsteadiness. The feedback control experiments, which use the sensor ring, only require twelve high-speed channels (see Table 2.2). Despite this limitation, the BDT system provides reliable 20 kHz data for time segments in excess of twelve seconds (well more than required).
2.3.2.2 SOFTWARE
A software program called MMADCAP controls the BDT data acquisition and organizes the digital
output into a data file. For each data acquisition set MMADCAP requires initialization, where the peak-to-peak voltage setting, acquisition time and acquisition rate must be specified. The units of the data written to the data file are counts, and the conversion to engineering units resides in the experiment setup file. Conversion from the raw counts data file to a useable MATLAB file is performed by the Adtektomatz.m MATLAB code. The output of the Adektomatz.m conversion is a MATLAB data file (e.g. data.mat) containing the raw data converted to engineering units. Dr. Jerry Guenette [8], Principle Researcher at the GTL, created and maintains these programs and the BDT data acquisition system. Any questions concerning the use of the BDT data acquisition system should be directed to Dr. Guenette.
2.3.3 SPECTRUM ANALYZER AND OSCILLOSCOPE
The previous two sections discussed the data acquisition systems used to record experimental data. This section describes the two pieces of equipment used to study the real-time unsteady behavior of the experimental system. An oscilloscope is used to examine the signals from the unsteady sensors and the actuators while the experiment is running. With respect to the actuators, it is important to view the actuator position signal to ensure that each actuator is functioning properly. It is also beneficial to use the oscilloscope to view the signals from the unsteady instrumentation to ensure that each sensor, especially the hot-film, is functional.
The spectrum analyzer is used during the single-frequency feedback control experiments (Section 5.1) to study the effectiveness of feedback control. The spectrum analyzer generates a time averaged RMS frequency profile of the parameter subject to feedback control. This real-time description of the broadband RMS allows the operator to adjust the control law during the experiment, to optimize the effects of feedback control.
2.4
ACTUATION SYSTEM
NASA Glenn supplied MIT with the four Moog actuators used in the active flow control experiments.
The purpose of these actuators is to modulate high-pressure airflow through a valve that feeds an injector. Each actuator has a bandwidth of 500 Hz and an input voltage range of ± 10 V. Along with
the actuators, shown in Figure 2.9, NASA supplied the equipment necessary to control and monitor the actuator valve position.
-10--- - --- -- - -- - -- - -- - -- - - - - -
-o
50 100 150 200 250 300 350 400 450 500 0I --- --- ---- L -- -- -- --- ---5 1 L I I I I I I I I I I I I -15 -- - --- - - - -- - - - | - -- -0 50 100 150 200 250 300 350 400 450 500 Frequency (Hz)Figure 2.8 - Typical Actuator Servo Motor Transfer Function
Figure 2.8 shows the typical command voltage to position voltage transfer function for an actuator servo motor. It is important to note that this transfer function does not include the factor of ten reduction from command to position voltage. For example, a command voltage of 4 V at 200 Hz produces a position voltage of 0.28 V rather than 2.8 V. The model for the servo motor transfer function is a third order system, including one zero, three poles, and a slight time delay. Equation 2.1 and Table 2.4 describe the model used to generate the transfer function in Figure 2.8. A detailed description of the actuator dynamics, including the servo motor transfer functions for each actuator, is presented in Section 2.3.3 of Harald Weigl's Ph.D. Thesis [10].
TF = .sz 1 c s
(s
p)(s
- p2)- (s
- p3)Parameter Value Description
s j -co Laplace Variable
zi -3456 radls [-550 Hz] First Zero
p1 2 -503 ±j-2388 rad/s [-80 ±j.380 Hz] Complex Pole Pair
p3 -1068 radls [-170 Hz] Third Pole
T 0.00015 sec Time Delay
k
1.472 x 10⁶ GainTable 2.4 - Servo Motor Transfer Function Parameters
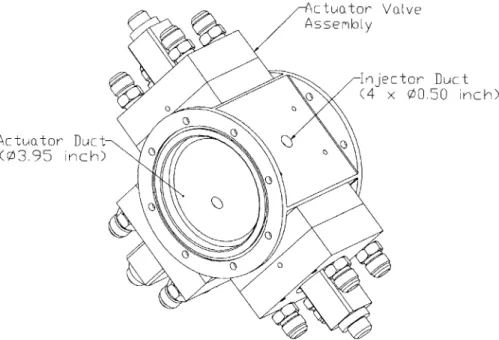
Figure 2.9 - Actuation System Assembly
The air supply for the actuators is a 100-psi oil free air compressor. The 100-psi air supply connects to a regulator, allowing the operator of the experiment to adjust the supply pressure feeding the actuators. Downstream of the regulator, a manifold splits the supply air into four lines, each supplying one actuator. Care was taken in plumbing the actuators to ensure that each actuator is subject to equal supply pressures. However, there is no means of determining if the supply pressures
![[PDF] Formation PrestaShop : Module TNT Express | Formation à télécharger en PDF](data:image/gif;base64,R0lGODlhAQABAIAAAP///wAAACH5BAEAAAAALAAAAAABAAEAAAICRAEAOw==)