https://doi.org/10.1007/s13201-019-1132-4
REVIEW ARTICLE
Characterization and frequency analysis of flooding solid flow
in semi‑arid zone: case of Mekerra catchment in the north‑west
of Algeria
M. Diaf1 · A. Hazzab1 · A. Yahiaoui2 · A. Belkendil3
Received: 20 December 2018 / Accepted: 23 December 2019 / Published online: 20 January 2020 © The Author(s) 2020
Abstract
In this study, we evaluate the soil erosion and solid transport in the oued Mekerra watershed in north-west Algeria. The study area is subject to a semi-arid climate characterized by irregular rainfall and showers, which are often accompanied by significant floods. These floods of large volumes transport large amounts of solid input to the Sarno dam, which is in the outlet of oued Mekerra. Therefore, the water storage capacity of this dam is gradually decreasing, and it might reach the volume of dead water. For this study, we utilized the hydrometric database provided by the National Agency of Water Resources (ANRH). The operating period was 24 years, from 1988 to 2012. This period was extended by classic regression to 65 years, which allowed extracting a series of annual maximum instantaneous flow rates (QIXA) and subsequently quanti-fied the sediment yield during floods. The specific degradation mean created by the 11 floods was quite high, in the order of 20 t km2 year−1. The highest value of solid contribution was observed during the floods of October 2000 (250,000 t), and
the value of liquid contribution was 7,151,608 m3. The extracted results from the analysis of the graphs of concentration as a
function of the liquid flow (C = f′(Ql)) showed four types of hysteresis curves: clockwise loop, counterclockwise loop, shape of eight, and straight line curve. Class II (clockwise loop) was the dominant class in the four events, namely the floods that occurred on 09/22/1992, 09/21/1998, 09/27/1999, and the 08/24/2002. From these results, the water resource sector manag-ers could formulate various methods for protection from floods and against the risk of sedimentation in storage structures.
Keywords Solid transport · Oued Mekerra · Semi-arid · Sediment concentration · Liquid flow
Introduction
Owing to its geographical location and climate regime, Algeria remains severely limited in terms of water resources. The volume of water lost by siltation in the dams is recog-nized as one of the main problems of the country.
The phenomenon of loss of water is growing and threat-ens more than 20 Algerian dams (Remini and Mokeddem
2018). The effect of erosion is not limited to the siltation of dams, but it also deals with major problems such as degrada-tion of fertile land, water quality, and the destabilizadegrada-tion of hydraulic structures.
The occurrence of flood is conditioned by the intensity and quantity of the rainfall. The flow rate of each flood event depends essentially on several hydrological and morphologi-cal parameters, such as drainage density, slope, compactness index, and the confluence ratio (Pallard et al. 2009; Yles and Bouanani 2016). The high speed of the flow causes detach-ment of soil particles from the bulk soil mass, which might
Electronic supplementary material The online version of this
article (https ://doi.org/10.1007/s1320 1-019-1132-4) contains supplementary material, which is available to authorized users. * M. Diaf diafrima@gmail.com A. Hazzab hazzabdz@yahoo.fr A. Yahiaoui yahiaouidz@hotmail.com A. Belkendil algeria7002@gmail.com
1 Modeling and Computational Methods Laboratory, University Dr. Moulay Tahar of Saïda, P.O. Box 138, 20000 En-Nasr, Saïda, Algeria
2 Department of Civil and Hydraulic Engineering, Faculty of Technology, University of Tahri Mohammed in Bechar, P.O. Box 417, 08000 Béchar, Algeria
3 Laboratory 60: Water Resources Valorisation, Science and Technology Faculty, University Abou-Bekr Belkaid of Tlemcen, P.O.Box 119, 13000 Tlemcen, Algeria
lead to transport of detached sediments (Hajigholizadeh et al. 2018).
In Algeria, the specific erosion rate reaches consider-able values, which exceeds 103 t km−2 year−1. It reaches up
to 1120 t km−2 year−1 in the High Tafna (Megnounif et al.
2004), 1330 t km−2 year−1 in the Tafna sub-basin (Ghenim
et al. 2008), and 1875 t km−2 year−1 in the Chelif sub-basin
(Meddi 1999). The watershed of the oued Mekerra con-tributes to the siltation in the Sarno dam (commissioned in 1954), resulting in a significant amount of suspended solids in the dam.
The main objective of the solid transport data analysis is to determine the origin of the transported sediments, through the analysis of concentration curves as a function of flow rates (C = f(Q)). Several studies have focused on the study of transport and quantification of solids (Nones 2019; Mrokowska and Rowinski 2019; Di Francesco et al. 2016; Tabarestani and Zarrati 2015; Vrolix and Pissart 1990). In Algeria, several researchers have evaluated the sediment transport associated with the floods in the country. A few examples include the studies done for the watershed region of the Tafna river in the north-west Algeria (Bouchelkia et al. 2011; Ghenim et al. 2007; Megnounif et al. 2004; Ter-fous et al. 2001) and for the region of Wahrane watershed (Benkhaled and Remini 2003).
The diversity of relationships between liquid and solid flows as a function of spatial and temporal disparity inter-ested several researchers to carry out probability modelling using frequency analysis for western Algeria (Yahiaoui and Touaibia 2011), the eastern Algerian watersheds (Mouas and Souag 2017), and the Walloon region of Belgium (Dautre-bande et al. 2006). The hysteresis graph is one of the meth-ods used to analyse sediment concentration as a function of flow rates (C–Q) (Pagano et al. 2019; Sadeghi et al. 2018; Zhao et al. 2017; Lloyd et al. 2016). Williams (1989) is the first to categorize the hysteresis according to the shape of each graph into five classes: clockwise loop, counter-clockwise loop, eight loops, straight line, and complex loop (Hamshaw et al. 2019). Hysteresis classes are used to identify physical processes in the watersheds. For example, clockwise hysteresis indicates that the source of sediment could be the outlet of the watershed, while counterclockwise loop hysteresis indicates that the source of sediments is in the headwaters (Delaney et al. 2018; Chalov et al. 2017; Baca 2008).
The dam of Sarno was built between 1947 and 1954 in the outlet of the oued Mekerra watershed. At commission-ing, it had a theoretical starting capacity of about 22 Mm3.
oued Mekerra contributes to the silting of the dam of Sarno by an average specific degradation of about 38 t km2 year−1
(Cherif et al. 2017). To put forward a better strategy to fight against this problem, it is necessary to have a precise under-standing of the variations in the sedimentation rates during
each hydro-rainfall period. The determination on erosion rate is based on the graphical analysis of the hysteresis traced according to the relation Qs = f(Ql). The
classifica-tion proposed by Williams (1989) of the different loops of hysteresis is adopted to determine the sources of origin of the sediments.
Study area
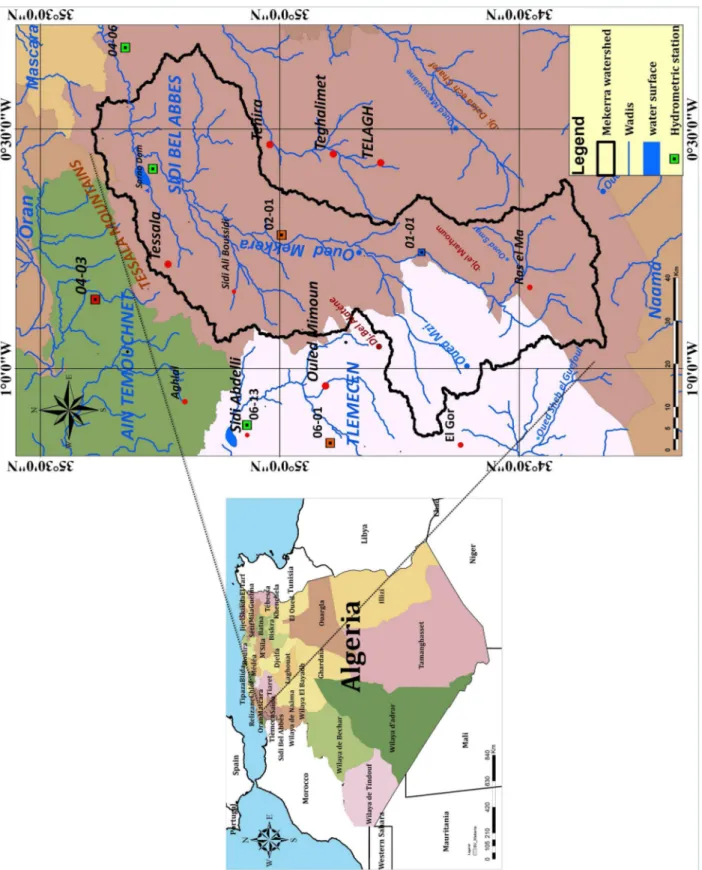
The watershed of the oued Mekerra is a sub-basin of the Macta watershed, mostly located in the Sidi-bel-Abbes region in western Algeria. It is about 400 km west of Algiers (between 1°–0° 30′ W and 34° 20′–35° 15′ N). The basin is limited to the north by the Tessala mountain range, to the south by the highlands (Ras El Maa), to the east by the Telagh plateau and the Saïda Mountains, and to the west by the Tlemcen Mountains (Fig. 1).
The main stream of oued Mekerra has its origin in the high valleys; it drains an area of about 3000 km2 and has a
course of 125 km and an average slope of 5.5%, a perimeter of 280 km with a compactness coefficient of 1.43 that reflects well the elongated shape of the watershed. The elevation of mountain ranges is 1000–1100 m in the north, 1200 m in the west, 1200–1260 m in the south, and 870–1460 m in the east. 48% of the watershed is located above 1000 m above sea level.
The oued Mekerra crosses two zones of very distinct reliefs, the Daya mountainous massif in the south, with an altitude between 800 and 1600 m, and the plain of the Mekerra, where the city of Sidi-bel-Abbes is located, in the north, with an average altitude of 550 m. The Mekerra watershed is a result of drainage of several small streams and tributaries. In the south, there are the El Kheoua, Sekhana, El-Lellelah, Ras El Ouiden, and Farat Ezziet streams. In the south-west are the Et-Touifza and Tadjmout streams and in the north-west are the Lemtar, Bukhenafis, Anefress, and Tissaf streams. All these streams contribute to the oued Mekerra as the main stream in the catchment. It has its source in the south at an altitude of 1100 m and crosses the city of Sidi-bel-Abbes at an average altitude of 500 m, with an average slope of about 1%. The vegetal cover in the watershed is irregularly developed. Downstream from the town of Ras El Ma appears Alfa covered land, which, to the north, gives way to brush covered land. In the region of Sidi Ali Benyoub, the Alfa gives way to cereals, vines, and citrus fruits. About 20% of the basin area is forest-covered (Otmane et al. 2018).
The following are some of the factors that favour the phe-nomenon of erosion in the Mekerra region:
• A well-defined hydrographic network with a drainage density of 1.67 km km−2 and a torrential coefficient of
Fig . 1 Geog raphical location of t he oued Mek er ra catc hment
0.23 indicates a torrential regime where the predomi-nant soil erosion gives a very strong solid flow (Fig. 2).
• The prolongation of the dry period during several months has destroyed the plant cover that character-izes as the main soil protector against the splash effect (Benkhadra 1997).
• Only a part (20%) of the Macta watershed has forest cover, consisting mainly of Aleppo pine and holm oak, and hence provides a very weak protection against soil erosion (Hallouche et al. 2017).
• The elongated shape of the watershed and the irregular-ities in the rainfall and the vegetation cover are linked to the fragility of the soil
Data acquisition
The climatological data for the period from 1990 to 2003 were provided by the National Agency for Hydraulic Resources (ANRH). The climatology of the watershed gives an average yearly rainfall of 300 mm. During the wet years, rainfall can reach up to 400 mm, and during dry years, it can decrease to less than 200 mm (Fig. 3).
The oued Mekerra catchment is under the influence of a semi-arid Mediterranean climate characterized by a hot and dry summer and a relatively mild and humid win-ter. The prevailing winds are from the north-west and west; the average maximum inter-annual velocity is about 20 m s−1 (Otmane et al. 2018). The temperature values
vary between a minimum value of 10 °C and a maximum of 24 °C, with an annual average of 17 °C. The cold and rainy period extends from the beginning of October until the end of April, while the dry period starts from May and last until September (Atallah et al. 2016). The evapo-transpiration has an average value of 1670 mm year−1,
between a maximum of 1883 mm year−1 and a minimum
of 1588 mm year−1, resulting in the rapid drying up of
soils and the degradation of the vegetation cover. These variations favour, in case of showers, the development of a fast surface flow and significant erosion.
Fig. 2 Map of land cover of oued Mekerra catchment
Fig. 3 Rainfall variation (1990–2003)
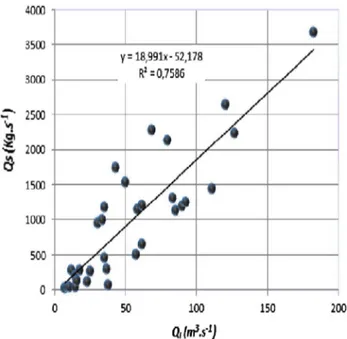
Fig. 4 Correlation of maximum solid flow as a function of maximum
The hydrometric series from the Sidi-bel-Abbes station (station code—110301), which is located at the outlet of the watershed (1° 00′–0° 30′ W; 34° 20′–35° 15′ N), extends from January 1, 1988, to December 30, 2012, and includes 10,048 instantaneous data of liquid flow rates Ql (m3 s−1),
solid flow rates Qs (kg s−1), concentration of suspended
mat-ter (g l−1), and heights (cm).
These data are recorded every 2 days. During floods, data survey is intensified up to 1 h or even 30-min time intervals depending on the flow level. However, this series has missing data gaps for the years 1997, 2004, 2005, and 2007. These deficiencies are corrected by applying clas-sical regression in the form of (Qs= aQl − b). The method
used is a numerical method based on the application of a classical regression model with the hydrometric series of (1988–2012). The law of regression is deduced with a cor-relation coefficient of R = 0.87 (Fig. 4). The series consid-ered was extended for a 65-year period from 1943 to 2008. Extension of the period of study is justified by the need for continuous observation series over a sufficiently long period (Vrolix and Pissart 1990).
The analysis of the variation of the maximum flows between the years from 1943 to 2008 (Fig. 5) gave two
dry periods that prolonged over the years 1947–1950 and 1955–1986. The other years were wet with the year 1994 recording 228 m3 s−1 of liquid flow and solid flow of
4030.86 kg s−1, along with suspended matter concentration
of 20 g l−1. The year 2008 recorded 183 m3 s−1 of liquid
flow and a significant solid flow of 3667.87 kg s−1, which
confirms the irregularity of the flow rates in the basin. The extreme flow of floods occurs twice a year, one during autumn (October and September) with maximum value reach-ing up to 200 m3 s−1 and another during spring, especially in
March and April, according to the cycles of annual flows from the Sidi-bel-Abbes station. The torrential coefficient indicates a torrential flow regime where soil erosion is predominant and consequently a very strong solid flow. The stream flows in the north of Algeria allow distinguishing two types of regimes: a simple regime where the high waters occur in the cold season, with a maximum between January and March, and the low flows taking place in July–August. It characterizes the coastal streams, and a complex regime with two annual maxima, more or less marked, occurs in autumn and spring, the main low water being in summer (Taibi et al. 1993); the latter character-izes the flow in the stream of oued Mekerra.
Fig. 5 The variability of solid
flows and maximum liquid flows from 1942 to 2008 at the Sidi-bel-Abbes station
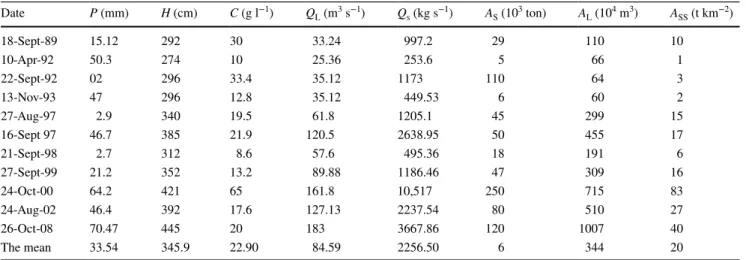
Table 1 The estimation of different solid–liquid contributions specific to the flood periods
P precipitation, H height, C concentration, QL liquid flow, Qs solid flow, AS solid input, AL liquid intake, ASS specific solid input Date P (mm) H (cm) C (g l−1) Q L (m3 s−1) Qs (kg s−1) AS (103 ton) AL (104 m3) ASS (t km−2) 18-Sept-89 15.12 292 30 33.24 997.2 29 110 10 10-Apr-92 50.3 274 10 25.36 253.6 5 66 1 22-Sept-92 02 296 33.4 35.12 1173 110 64 3 13-Nov-93 47 296 12.8 35.12 449.53 6 60 2 27-Aug-97 2.9 340 19.5 61.8 1205.1 45 299 15 16-Sept 97 46.7 385 21.9 120.5 2638.95 50 455 17 21-Sept-98 2.7 312 8.6 57.6 495.36 18 191 6 27-Sept-99 21.2 352 13.2 89.88 1186.46 47 309 16 24-Oct-00 64.2 421 65 161.8 10,517 250 715 83 24-Aug-02 46.4 392 17.6 127.13 2237.54 80 510 27 26-Oct-08 70.47 445 20 183 3667.86 120 1007 40 The mean 33.54 345.9 22.90 84.59 2256.50 6 344 20
Characterization of solid transport
Generally, suspended flow Qs is related to liquid flow rates Ql (Wood 1977; Walling and Webb 1981; Walling 1983; Etchan-chu and Probst 1986) by the following equation:
Ql is measured in m3 s−1, Q
s in kg s−1 and C the
concentra-tion in g l−1.
Solid flows (As) are calculated by the following formula:
(ti+1 − ti) being the time duration between two successive
withdrawals, where ti is the time corresponding to the flow
rate and n is the number of withdrawals. The specific inputs (ASS) tonne per square kilometre per year are:
where A is the area of the catchment area in km2.
Liquid inputs (Al) in m3 are calculated by:
For the period from 1980 to 2012, we obtained 11 floods, which are represented in Table 1.
To understand the solid transport mechanism and its ori-gin, it is necessary to study the relation between the concen-tration C (g l−1) and the liquid flow Q
l (Williams 1989). The
classification of the models from the analysis of the concen-tration and liquid flow curves C − Ql is given in Table 2.
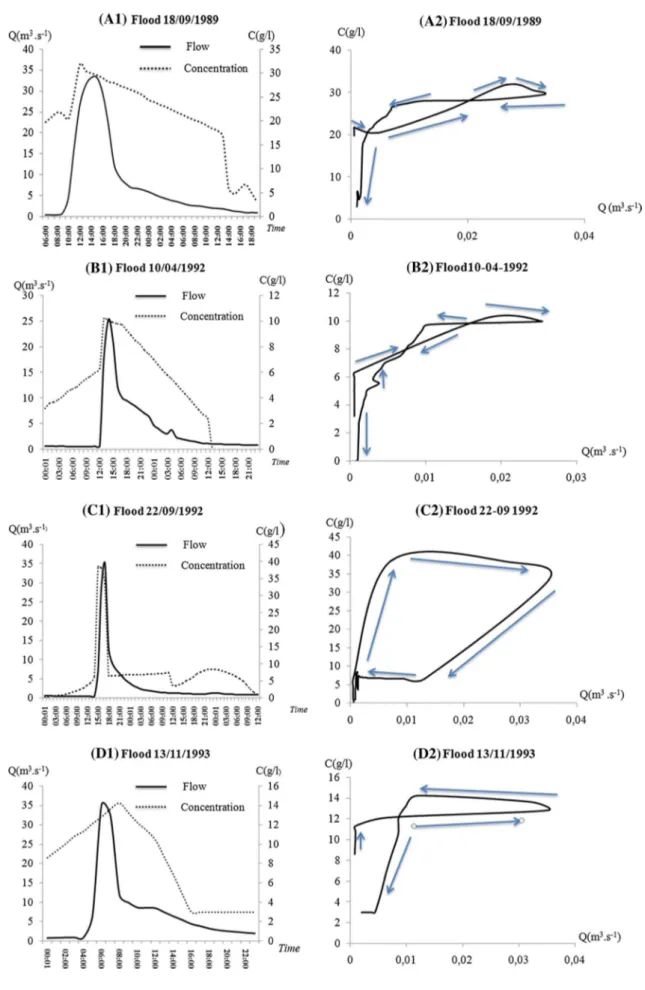
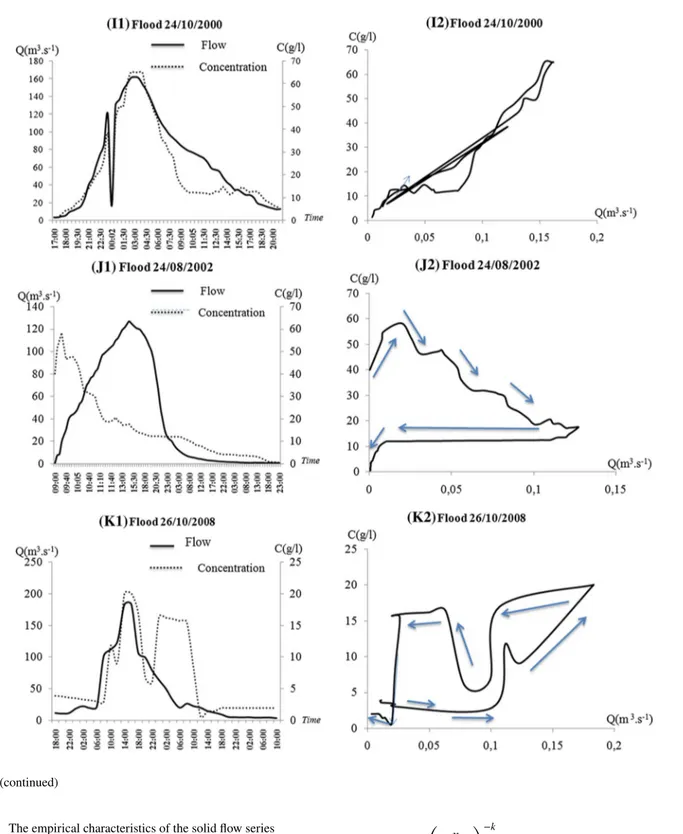
The fundamental relationship of the concentration as a function of the liquid flow is illustrated in Fig. 6, in the form of hysteresis, for the eleven floods that occurred dur-ing 1989–2008. (1) Qs= c × Ql (2) As= n ∑ i=1 (ti+1− ti) × (Qi× Ci) × 10−3 (3) Ass = As× 106∕A (4) Al= n ∑ i=1 (ti+1− ti) × Qi
Frequency analysis of solid flow
Extreme flows are responsible for the damage caused by floods (Henstra and Thistlethwaite 2017). It is interesting to model the extremes of flows using a frequency analysis. The purpose of the analysis is to determine quantiles based on the return period (Botero and Francés 2010). The series of extreme solid flows has a sufficient size of 43 values and has the empirical characteristics presented in Table 3 to perform the adjustment of a statistical law.
The quality of the sample is verified using several statis-tical tests proposed in previous studies (Wald 1943; Mann and Whitney 1947; Grubbs and Beck 1972; Forthofer and Lehnen 1981), to test the independence stationarity, homo-geneity, and singularity of the sample. The decision support system identifies the most appropriate class for adjusting a flow sample and estimating the QT quantile of high return
period (Ouarda et al. 1994; El Adlouni et al. 2008; Yahiaoui and Touaibia 2011). The methods developed in this system allow identifying the most suitable class for a series adjust-ment. These methods are as follows:
• The log–log graph used to differentiate between classes C (distributions with regular variations), D (sub-expo-nential distributions), and E (expo(sub-expo-nential law);
• The average function of excesses (FME), used to differ-entiate classes D and E; and
• Two statistical methods: Hill’s report and Jackson’s statistics that could be used to perform a confirmatory analysis of suggested conclusions from the two previous methods.
The log–log diagram consists of the adjustment of the series (x1, x2, … , xn
)
to the power law of Pareto or Zipf whose probability density function is:
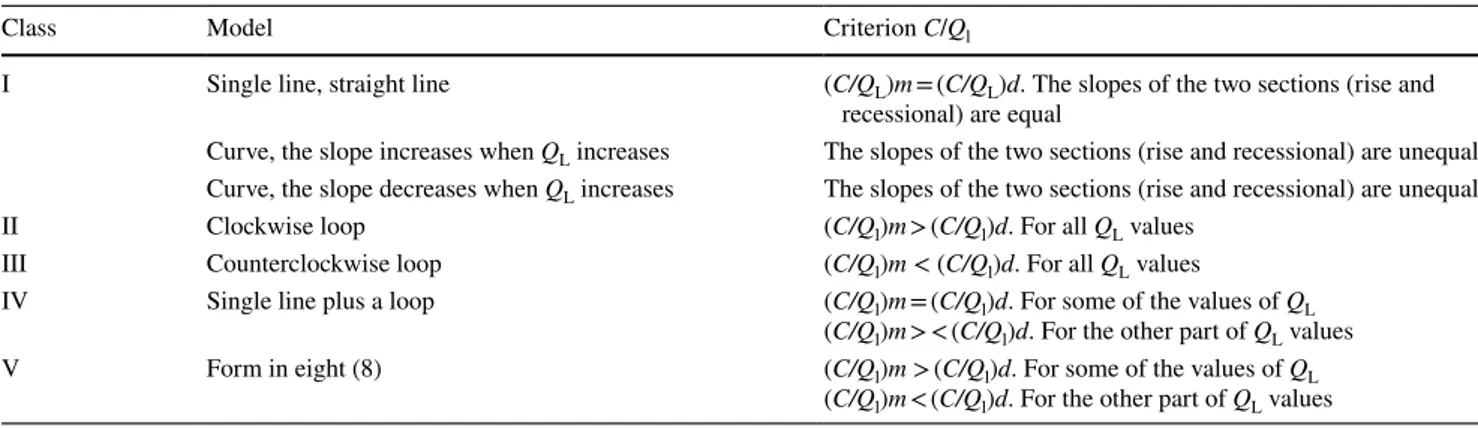
Table 2 Classes of C–Ql relations (Williams 1989)
Class Model Criterion C/Ql
I Single line, straight line (C/QL)m = (C/QL)d. The slopes of the two sections (rise and recessional) are equal
Curve, the slope increases when QL increases The slopes of the two sections (rise and recessional) are unequal Curve, the slope decreases when QL increases The slopes of the two sections (rise and recessional) are unequal
II Clockwise loop (C/Ql)m > (C/Ql)d. For all QL values
III Counterclockwise loop (C/Ql)m < (C/Ql)d. For all QL values
IV Single line plus a loop (C/Ql)m = (C/Ql)d. For some of the values of QL
(C/Ql)m > < (C/Ql)d. For the other part of QL values
V Form in eight (8) (C/Ql)m > (C/Ql)d. For some of the values of QL
where k and xmin are the parameters of form and scale of the
Pareto law. In the case of oued Mekerra and by the method of moments, I = 2.4 and xmin = 565 kg s−1.
The graphical adjustment of the QIX solid series to the
power distribution can be an exponential distribution (class E) or one of the class D distributions.
(5) P(X = x) = k ( x xmin )−k Fig. 6 (continued)
Table 3 The empirical characteristics of the solid flow series
Characteristics Value Unit
Size 43 – Mean 1010 kg s−1 Standard deviation 1050 kg s−1 Skewness 1.35 – Kurtosis 3.62 – Median 519 kg s−1 Variation 1.04 –
The average function of the excesses is constant for an exponential distribution of the scale parameter a (e(u) = a). The e(u) varies around an average of 13.3 m3 s−1, between the
two extremes 12.4 and 0.89 m3 s−1, which leads to adjusting
the QIX solid series to the exponential law (class E).
Discussion
Relationship between suspended matter (MES) flows and hydrological conditions
According to the morphometric data of the watershed, it is possible to distinguish the factors that favour erosion in the Mekerra region as well as the elongated shape of the watershed, irregular rainfall, and a weak vegetation cover (Benkhadra 1997, Hallouche et al. 2017). The thermal regime may increase evapotranspiration, rapid soil drying, and degra-dation of vegetation cover. These variations favour, in case of showers, the development of rapid surface flow and significant erosion.
Relationship between flow and climatological conditions
Annual maximum flow rates have generally been observed in autumn (October and September) with a value of up to 200 m3 s−1 and another in the spring of March and April.
According to Taibi et al. (1993), stream flows in northern Algeria have two types of regimes, a simple regime and a complex regime; the complex regime with almost two annual maxima, occurring in autumn and spring and the main low water occurring in summer. This characterizes the flow of our current oued Mekerra.
The analysis of the variations of maximum flows during the period 1942–2008 gave two prolonged dry periods: from the years 1947 to 1950 and from 1955 to 1986. The other years are wet, among which the most important years are 2000 and 2008, which confirms the irregularity of flows in the basin. The succession of years with light humidity or drought has led either to a considerable accumulation of water supply or to a latent drought. As shown in Table 1, floods occurred even when rainfall was very low, which indi-cates that rainfall has no influence on the floods (Ramírez
2000). These floods were usually recorded during autumn (September and October), with the exception of those recorded in August 1997 and April 1992 with high flow rates and concentrations. The flood of 2008 with a maximum water height of 445 cm, that lasted for 4 days (from October 25 to October 28, 2008), was the largest flood that occurred during the study period, with a strong flow of 3668 kg s−1
and a liquid flow rate of 183 m3 s−1.
Abundant rainfall of exceptionally long duration lasted all night (from October 23 to October 24, 2000), and the volume
of rain received on the Ras El Ma heights was estimated to be 100 mm of water. The consequences of this storm were strongly felt by the population, who were surprised by the flow of water arriving in the plain with a maximum flow close to 200 m3 s−1 and a significant solid flow estimated at
10,517 kg s−1, depositing tons of sand and materials in the
streets and squares of downtown Sidi-bel-Abbés on its way. Analysis of the 11 floods for the period 1980–2012 shows that they occurred mostly in autumn (September and Octo-ber) with a frequency of 72%, causing high specific soil deg-radation of 177 t km−2. In summer (August), they caused a
degradation of 42 t km−2, and in spring (9% of frequency)
a minimal value of 1 t km−2 was recorded. The total solid
specific degradation during the 11 floods was estimated to be 220 t km−2, which is estimated as half that of the oued
Boumessaoud (541 t km−2) located in north-west Algeria
(Bouguerra et al. 2016).
As a comparison, the solid contribution of the oued Mekerra during the flood period is 250,000 t (the maximum value in floods), and it is superior to that of certain zones forming part of the same semi-arid region, such as the water-shed of oued Saida (9261 t), and lower than that of high Tafna watershed (2,686,000 t).
Table 2 shows that the variation of the solid flows has a relative relation with the liquid flow, with the exception of some cases; for example (October 24, 2000) where we found that the increasing fluid flow causes a solid flow decline due to the draining of the aquifers coming from a large flood (August 24, 2002).
Relationship between concentration and flows by hysteresis
The hysteresis analysis shows that the oued Mekerra is sub-ject to four classifications: Class II (clockwise loop) is the dominant class in the four events, namely the 09/22/1992, 09/21/1998, 09/27/1999 and the 08/24/2002 floods (Fig. 6
(C-1 and C-2) (G-1 and G-2) (H-1 and H-2) (J-1 and J-2)). Class II dominance indicates that the sediments have a source close to the outlet of the watercourse either at the bottom or in the areas surrounding the outlet (Rodríguez-Blanco et al. 2010; Alexandrov et al. 2007).
Another interpretation shows that the class II relation indicates strong rain intensity at the beginning of the flood. The time of arrival of flood explains the cause of the high concentration of sediment. These floods occur during the transition period between the end of the dry season (sum-mer) and the beginning of the rainy season (autumn), and the rainfalls on very dry ground without plant cover. This accel-erates the appearance of a “splash” phenomenon (instan-taneous erosion that causes the dissociation of soil parti-cles). Generally, one can distinguish the class II hysteresis from the graph of C/Q, where the sediment concentration
peak appears just before the liquid flow peak. According to Arnborg et al. (1962), high concentration of sediment is the index of existence of a pavement layer formed on the streambed. This layer is created by a vertical deposit of the soil particles according to the size of the elements, which play a bed stabilizer role; some rocks are detached under the strong floods effect by releasing the materials in suspension.
The concentration/flow relationship is of class III (coun-terclockwise loop) and is the second dominant class in the studied floods series, where we can distinguish this relation-ship in the 11/13/1993, 08/27/1997, and 10/26/2008 floods (Fig. 6 (D-1 and D-2) (E-1 and E-2) (K-1 and K-2)). The graph shows that the maximum concentration is recorded after the liquid flow rates reach their maximum (Mokadmi
2012). According to Williams (1989), the concentration val-ues during the rising are lower than the liquid flow valval-ues during the recession (C/Q(rising) < C/Q(recession)). Floods of this relationship type were characterized by high rainfall and relatively free run-off from the solid particles, as most of the sediments were transported by the first floods of fall season. Tananaev (2015) and Mokadmi (2012) cited three causes for manifestation of this relationship (counterclockwise loop): one of the main causes is the significant soil erodibility at the same time as the prolonged erosion during the flood (Megnounif et al. 2013). Another cause is the irregularity in rainfall during the season, which has a direct influence on the sediment production in the watershed (Benkhaled and Remini 2003). The third cause is the shift between the flood wave that affects the water bodies and the slower transport of materials produced from the streams.
The class V hysteresis (shape of eight) combines two rela-tions: that of a clockwise loop and its opposite, which is a counterclockwise loop (Benkhaled and Remini 2003). This form of hysteresis was recorded in two hydrological events: the 09/18/1989 flood and that of 04/10/1992 (Fig. 6 (A-1 and
A-2) (B-1 and B-2)). The first floods are positioned in the transition phase between the end of summer and the begin-ning of autumn (beginbegin-ning of rainfall). According to the concentration/flow curves, the concentration peaks appear before the flow by forming a loop in the clockwise direc-tion. During the recession, the peak concentration begins to decrease slightly relative to the liquid flow; this will form a loop in the counterclockwise direction. The possible expla-nation for this relationship at this time could be that the year 1989 was a hydrological wet year, which helped recharging of the aquifer to saturation by facilitating surface run-off and recorded large liquid and solid flow values at the beginning of the flood season (El Mahi et al. 2012). The second flood was recorded in the spring season; this period of the year is characterized by very high saturation of the soil after the heavy rains in winter season, which explains the accentua-tion of superficial run-off and large values of liquid and solid flow in the first moments of the flood.
The marked third relation is that of class I (simple curve or straight line), observed for the flood that occurred on October 24, 2000 (Fig. 6 (I-1 and I-2)). According to Wil-liams (1989), the values of the concentration during the ris-ing are equal to the liquid flow values durris-ing the recession (C/Q(rising) = C/Q(recession)). The variation of suspended solids is directly related to the flow of water (Megnounif et al. 2013). This curve, of linear shape, indicates a strong relationship between suspended sediment concentration and liquid flow with uninterrupted supply throughout the flood; the main source of suspended matter comes from dragging soil particles from stream beds according to soil particle sizes (Hudson 2003).
The flood that occurred on September 16, 1997, is assessed to be a complex flood (Fig. 6 (F-1 and F-2)). The complexity of this kind of flood comes from the succession of the floods in a short period, which contributes to the sud-den increase in liquid flow values in the recession phase of
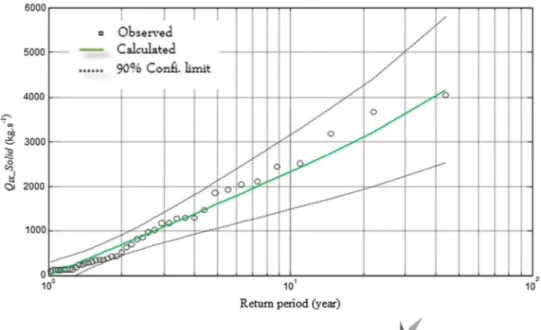
Fig. 7 Fitting and confidence
limits at 95% of the QIX_solid series to the exponential distri-bution
the previous flood in an irregular way. Liquid inputs and solid inputs are highly variable during the flood years.
Quantiles determining according to the return period using the frequency analysis
With the objective of assessing the risks of floods in future, a frequency analysis is applied using the adjust-ment of the QIX solid flow series of the oued Mekerra
to an exponential distribution (Fig. 7) by the method of moments that leads to the estimation of the scale param-eter a = 972.21 kg s−1 from the function of the distribution
not exceeding:
After estimating the distribution parameter, a fit test consists in defining a decision rule concerning the validity of the hypothesis concerning the agreement of an empiri-cal distribution with theoretiempiri-cal distribution adjusted to observations; the three fit tests are applied:
• For the Kolmogorov–Smirnov test, the observed value is
Dob= 0.121 and the theoretical value for a level of sig-nificance 𝛼 = 5% is Dth= 0.2074 , the fit test is accepted
for Dob<Dth
• The production possibilities curve (PPC) coefficient test, which reflects the correlation between the observed and theoretical values of the same experimental frequencies, is accepted for PPC = 0.992 which is close to 1.
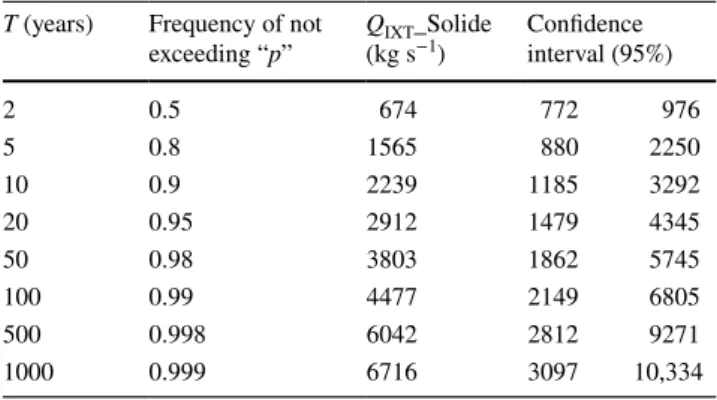
• The root-mean-square deviation (RMSD) test, which expresses the quadratic relative error, is equal to 0.3 and is strictly less than 1. So the good-fit test is accepted. Therefore, quantiles and corresponding confidence intervals for a significance level 𝛼 = 5% are summarized in Table 4.
(6)
P(X ≤ x) = 1 − exp(−x
a
)
The series of solid flows were subjected to a static treatment that gave periodic flood flows. The flow values increased depending on the period of return. For a 95% con-fidence interval, we have for every 2 years a flood of solid flow equal to 674 kg s−1.
The solid flows QIXT_Solide in table 4 provide val-ues that exceed the average value of the eleven (11) floods (2256.5 kg s−1) for the periods after 50 and 100 years, and
even millennia which seem significant of 6716 kg s−1.
Find-ings from earlier works show that:
The series of maximum flow for northern Algeria gener-ally fits the Gumbel distribution and the log-normal law that estimates values of flood flows from 1000 years (Hallouche et al. 2017).
The normal log distribution is most appropriate for the humid region, and the exponential distribution is preferable for the semi-arid and arid regions (Mouas and Souag. 2017).
• The stations at the north-west Algerian watershed belong to the class “D” of the sub-exponential distributions (Meddi and Abbes 2014).
• The results of the statistical adjustment to the Mejjate plain of Morocco (Boukhari et al. 2008) show that the series of observations are well correlated with laws of the logarithmic type (Pearson V) or exponential (Galton), with test values ranging from 0.7 to 3. The normal law, meanwhile, has high-test values.
The specific degradation for the 11 floods varies between 1 and 83 t km−2. The flow regime of the oued Mekerra is
complex with two annual maxima; one that occurred in autumn (September 22) and other in spring (April 10) in the year 1992.
Conclusion
Among the causes favouring soil erosion in the Mekerra region are the irregularities in the rainfall and the vegeta-tion cover, which consequently lead to significant flow. The liquid and solid flow rates are strongly correlated with a correlation coefficient R = 0.87. This obtained relation gave an extension of the flows up to 65 years. Statistical estimation of extreme flows using the annual maxima method for the data yielded 11 floods. The spe-cific degradation for the 11 floods is estimated between 1 and 83 t km2 year−1. The stream flow regime is complex
with two more or less marked annual maxima occurring in autumn (September 22) and spring (April 10) of the same year 1992.
The evolution of the concentrations as a function of the liquid flows, during the 11 floods, was subjected to four models; the most dominant is class II in the four events
Table 4 Quantiles and confidence intervals estimated by the
exponen-tial law
T (years) Frequency of not
exceeding “p” Q(kg sIXT_Solide −1) Confidence interval (95%)
2 0.5 674 772 976 5 0.8 1565 880 2250 10 0.9 2239 1185 3292 20 0.95 2912 1479 4345 50 0.98 3803 1862 5745 100 0.99 4477 2149 6805 500 0.998 6042 2812 9271 1000 0.999 6716 3097 10,334
(09/22/1992, 09/21/1998, 09/27/1999 and 08/24/2002), which indicated high intensity of rainfall at the beginning of the flood. The arrival time of these floods explains the cause of high concentration of sediments. Class III (counterclockwise loop) is the second dominant class in the flood series (those of 11/13/1993, 08/27/1997 and 10/26/2008), and the maximum concentration was recorded after the liquid flows reached their maximum. Floods of this type are characterized by strong rainfall and run-off that is relatively free of solid particles. The hys-teresis of class V (shape of eight) combines two relations: that of a loop in the clockwise direction and its opposite. This form of hysteresis was recorded in two hydrologi-cal events: the floods that occurred on 09/18/1989 and 04/10/1992. Class I (simple curve or straight line) relation was observed for the flood on 10/24/2000. According to Williams (1989), the values of the concentration during the rising are equal to the liquid flow values during the recession C/Q(rising) ≈ C/Q(recession).
The modelling of extreme flow events was performed by frequency analysis using the extreme flow data of the floods responsible of damages. The purpose of the analy-sis was to determine quantiles based on the return period. For the rare and stronger floods, it was possible to know the decennial, fiftieth, and centennial frequencies with the respective quantiles: 2239 kg s−1, 3803 kg s−1, and
4477 kg s−1.
Acknowledgements The authors would like to thank the Regional
Director of the ANRH in the Wilaya of Oran, for having made avail-able all the necessary data to accomplish this work. We would like to acknowledge the contribution of Mr. Baghli Abderrazak, Professor at the University of Tlemcen, in writing this article, my thanks to Editing (www.edita ge.com) for the English edition. We would also like to thank the reviewers for reading and editing this article. Their comments and suggestions have improved the quality of this work.
Open Access This article is licensed under a Creative Commons
Attri-bution 4.0 International License, which permits use, sharing, adapta-tion, distribution and reproduction in any medium or format, as long as you give appropriate credit to the original author(s) and the source, provide a link to the Creative Commons licence, and indicate if changes were made. The images or other third party material in this article are included in the article’s Creative Commons licence, unless indicated otherwise in a credit line to the material. If material is not included in the article’s Creative Commons licence and your intended use is not permitted by statutory regulation or exceeds the permitted use, you will need to obtain permission directly from the copyright holder. To view a copy of this licence, visit http://creativecommons.org/licenses/by/4.0/.
References
Alexandrov Y, Laronne J, Reid I (2007) Intra-event and inter-seasonal behaviour of suspended sediment in flash floods of the semi-arid northern Negev, Israel. Geomorphology 85(1):85–97. https ://doi. org/10.1016/j.geomo rph.2006.03.013
Arnborg L, Walker HJ, Peippo J (1962) Suspended load in the Colville river, Alaska. Geogr Ann Ser A Phys Geogr 49(2/4):131–144 Atallah M, Hazzab A, Seddini A, Ghenaim A, Korichi K (2016)
Hydraulic flood routing in an ephemeral channel: Wadi Mekerra, Algeria. Model Earth Syst Environ 2(4):1–22. https ://doi. org/10.1007/s4080 8-016-0237-0
Baca P (2008) Hysteresis effect in suspended sediment concentration in the Rybárik basin, Slovakia. Hydrol Sci J 53(1):224–235. https ://doi.org/10.1623/hysj.53.1.224
Benkhadra H (1997) Battance, ruissellement et érosion diffuse sur les sols limoneux cultivés. Déterminisme et transfert d’échelle de la parcelle au petit bassin versant. PhD thesis of the University of Orleans, France
Benkhaled A, Remini B (2003) Analysis of the power relation-ship: solid flow—liquid flow at the scale of the Oued Wahrane watershed(Algeria). Revue des sciences de l’eau/Journal of Water Science 16(3):333–356. https ://doi.org/10.7202/70551 1ar
Botero BA, Francés F (2010) Estimation of high return period flood quantiles using additional non-systematic information with upper bounded statistical models. Hydrol Earth Syst Sci 4(12):2617– 2628. https ://doi.org/10.5194/hess-14-2617-2010
Bouchelkia H, Belarbi F, Remini B (2011) Quantification du transport solide en suspension par analyse statistique: cas du bassin-versant de l’oued Mouillah. Rev Sci Tech 19:29–41
Bouguerra S, Bouanani A, Baba-Hamed K (2016) Transport solide dans un cours d’eau en climat semi-aride: cas du bassin versant de l’Oued Boumessaoud (nord-ouest de l’Algérie). J Water Sci 29(3):179–195. https ://doi.org/10.7202/10389 23ar
Boukhari K, Er-Rouane S, Jaffal M, Gouzrou A, Enanaa N (2008) Caractérisation de la structure du bassin de Mejjate (Haouz occi-dental, Maroc): implications hydrogéologiques. Afr Geosci Rev 15:33–40
Chalov S, Golosov V, Tsyplenkov A, Theuring P, Zakerinejad R, Marker M, Samokhin M (2017) A toolbox for sediment budget research in small catchments. Geogr Environ Sustain 10(4):43–68.
https ://doi.org/10.24057 /2071-9388-2017-10-4-43-68
Cherif HM, Bouannani A, Boukerma B (2017) A rating-curve method for determining specific suspended sediment yieldin the catchment area of sidi bel abbes (Algeria). http://dspac e.univo uargl a.dz/jspui /handl e/12345 6789/14018
Dautrebande S, Pontégnie D, Gailliez S, Bazier G, Dewil P (2006) Esti-mate of rare events flood discharges for Walloon rivers (Belgium). La Houille Blanche 6:87–92. https ://doi.org/10.1051/lhb:20061 06
Delaney I, Bauder A, Werder MA, Farinotti D (2018) Regional and annual variability in subglacial sediment transport by water for two glaciers in the Swiss Alps. Front Earth Sci 6:175–192. https ://doi.org/10.3389/feart .2018.00175
Di Francesco S, Biscarini C, Manciola P (2016) Characterization of a flood event through a sediment analysis: the Tescio River case study. Water J 8(7):308–328. https ://doi.org/10.3390/w8070 308
El Adlouni S, Bobée B, Ouarda TBMJ (2008) On the tails of extreme event distributions in hydrology. J Hydrol 355(1–4):16–33. https ://doi.org/10.1016/j.jhydr ol.2008.02.011
El Mahi A, Meddi M, Bravard JP (2012) Analyse du transport solide en suspension dans le bassin versant de l’Oued El Hammam (Algérie du Nord). Hydrol Sci J 57(8):1–20. https ://doi.org/10.1080/02626 667.2012.71770 0
Etchanchu D, Probst JL (1986) Erosion et transport des matières en suspension dans un bassin versant en region agricole. Methode de mesure du ruisselement superficiel, de sa charge et des deux composantes du transport solide dans un cours d’eau. Comptes Rendus de l’Academie des Sciences 302(17):1063–1068 Forthofer RN, Lehnen RG (1981) Rank correlation methods. In:
Pub-lic program analysis. Springer, Boston, MA, pp 146–163. https ://doi.org/10.1007/978-1-4684-6683-6_9
Ghenim A, Terfous A, Seddini A (2007) Etude du transport solide en suspension dans les régions semi-arides méditerranéennes: cas du bassin versant de l’oued Sebdou (nord-ouest algérien). Sécheresse 18(1):39–44. https ://doi.org/10.1684/sec.2007.0067
Ghenim A, Seddini A, Terfous A (2008) Variation temporelle de la dégradation spécifique du bassin versant de l’Oued Mouilah (nord-ouest Algérien). Hydrol Sci J 53(2):448–456. https ://doi. org/10.1623/hysj.53.2.448
Grubbs FE, Beck G (1972) Extension of sample sizes and per-centage points for significance tests of outlying observations. Technometrics 14(4):847–854. https ://doi.org/10.1080/00401 706.1972.10488 981
Hajigholizadeh M, Melesse A, Fuentes H (2018) Raindrop-induced erosion and sediment transport modelling in shallow waters: a review. J Soil Water Sci 1(1):15–25
Hallouche B, Marok A, Benaabidate L, Berrahal Y, Hadji F (2017) Geochemical and qualitative assessment of groundwater of the High Mekerra watershed, NW Algeria. Environ Earth Sci 76:340–352. https ://doi.org/10.1007/s1266 5-017-6649-y
Hamshaw S, Denu D, Holthuijzen M, Wshah S, Rizzo D (2019) Automating the classification of hysteresis in event concentra-tion-discharge relationships. In: Conference: SEDHYD 2019 conference, At Reno, Nevada. https ://www.sedhy d.org/2019/ openc onf/modul es/reque st.php?modul e=oc_progr am&actio n=view.php&id=70&file=1/70.pdf
Henstra D, Thistlethwaite J (2017) Climate change, floods, and municipal risk sharing in Canada. Institute on Municipal Finance & Governance Munk School of Global Affairs, Univer-sity of Toronto, 1 Devonshire Place, Toronto, Ontario, Canada M5S 3K7. http://munks chool .utoro nto.ca/imfg/. Series edi-tors: Philippa Campsie and Selena Zhang © Copyright held by authors ISBN 978-0-7727-0974-5 ISSN 1927-1921
Hudson PF (2003) Event sequence and sediment exhaustion in the lower Panuco Basin, Mexico. Catena 52(1):57–76. https ://doi. org/10.1016/S0341 -8162(02)00145 -5
Lloyd CEM, Freer JE, Johnes PJ, Collins AL (2016) Using hyster-esis analysis of high-resolution water quality monitoring data, including uncertainty, to infer controls on nutrient and sediment transfer in catchments. J Sci Total Environ 543:388–404. https ://doi.org/10.1016/j.scito tenv.2015.11.028
Mann HB, Whitney DR (1947) On a test of whether, one of two ran-dom variables is stochastically larger than the other. Ann Math Stat 18(1):50–60. https ://doi.org/10.1214/aoms/11777 30491
Meddi M (1999) Étude du transport solide dans le bassin versant de l’oued Ebda (Algérie). Z Géomorphol 43(2):167–183
Meddi M, Abbes ASB (2014) Statistical analysis and forecast of flood flows in the Oued Mekerra watershed (West of Algeria). Nat Tech-nol (10):21
Megnounif A, Terfous A, Ghenaim A, Poulet J (2004) Rôle des crues dans la production de sédiments transportés en suspension dans un cours d’eau des bassins versants méditerranéens. VIIème Journées Nationales Génie Côtier - Génie Civil. https ://doi. org/10.5150/jngcg c.2004.038-m
Megnounif A, Terfous A, Ouillon S (2013) A graphical method to study suspended sediment dynamics during flood events in the Wadi Sebdou, NW Algeria (1973–2004). J Hydrol 497:24–36.
https ://doi.org/10.1016/j.jhydr ol.2013.05.029
Mokadmi S (2012) Etude hydrologique et modélisation du trans-port solide en suspension dans le sous bassin versant de l’oued Mekerra, Magister thesis of Oran University of Science and Technology—Mohamed Boudiaf
Mouas A, Souag D (2017) Analyse fréquentielle des débits de crues: Application aux bassins de l’Est Algérien. jspui, pp 1–4 Mrokowska M, Rowiński PM (2019) Impact of unsteady flow events
on bedload transport: a review of laboratory experiments. Water 11(5):907–923. https ://doi.org/10.3390/w1105 0907
Nones M (2019) Dealing with sediment transport in flood risk man-agement. Acta Geophys 67(2):677–685. https ://doi.org/10.1007/ s1160 0-019-00273 -7
Otmane A, Baba-Hamed K, Bouanani A, Kebir LW (2018) Highlight-ing drought by the study of climate variability in the watershed of Mekerra River (Northern-West Algerian). Tech Sci Methodes 9:23–37. https ://doi.org/10.1051/tsm/20180 9023
Ouarda T, Ashkar BMJ, Bensaid F, Hourani I (1994) Distributions statistiques utilisées en hydrologie: Transformations et propriétés asymptotiques. Université de Moncton, Moncton
Pagano SG, Rainato R, García-Rama A, Gentile F, Lenzi MA (2019) Analysis of suspended sediment dynamics at event scale: compari-son between a Mediterranean and an Alpine basin. Hydrol Sci J 64(8):948–961. https ://doi.org/10.1080/02626 667.2019.16064 28
Pallard B, Castellarin A, Montanari A (2009) A look at the links between drainage density and flood statistics. Hydrol Earth Syst Sci 13:1019–1029. https ://doi.org/10.5194/hess-13-1019-2009
Ramírez JA (2000) Prediction and modeling of flood hydrology and hydraulics. In: Wohl EE (ed) Inland flood hazards. Cam-bridge University Press, CamCam-bridge, pp 293–333. https ://doi. org/10.1017/cbo97 80511 52941 2.012
Remini B, Mokeddem FZ (2018) Boukourdane (Algeria): a reservoir dam with low siltation rate. Larhyss J 35:29–44
Rodríguez-Blanco ML, Castro MM, Palleiro L, Taboada-Castro MT (2010) Temporal changes in suspended sediment transport in an Atlantic catchment NW Spain. Geomorphology 123(1):181–188. https ://doi.org/10.1016/j.geomo rph.2010.07.015
Sadeghi SH, Singh VP, Kiani-Harchegani M, Asadi H (2018) Analysis of sediment rating loops and particle size distributions to charac-terize sediment source at mid-sized plot scale. Catena 167:221– 227. https ://doi.org/10.1016/j.caten a.2018.05.002
Tabarestani K, Zarrati AR (2015) Sediment transport during flood event: a review. Int J Environ Sci Technol 12(2):775–788. https :// doi.org/10.1007/s1376 2-014-0689-6
Taibi R, Fleureau JM, Kheirbek-Saoud S, Soemitro R (1993) Behaviour of clayey soils on drying–wetting paths. Can Geotech J 30(2):287– 296. https ://doi.org/10.1139/t93-024
Tananaev N (2015) Hysteresis effects of suspended sediment trans-port in relation to geomorphic conditions and dominant sediment sources in medium and large rivers of Russian Arctic. Hydrol Res 46(2):232–243. https ://doi.org/10.2166/nh.2013.199
Terfous A, Megnounif A, Bouanani A (2001) Study of the suspended load et the river Mouilah (North West Algeria). J Water Sci 14(2):173–185. https ://doi.org/10.7202/70541 6ar
Vrolix M, Pissart A (1990) Étude des variations de la charge en suspen-sion de la Meuse entre Hastière et Lixhe. Bulletin de la sociéte géographique de Liège 25:27–38
Wald A (1943) On the efficient design of statistical investigations. Ann Math Stat 14(2):134–140. Retrieved from www.jstor .org/ stabl e/22358 15
Walling DE (1983) The sediment delivery problem. J Hydrol 65(1– 3):209–237. https ://doi.org/10.1016/0022-1694(83)90217 -2
Walling DE, Webb BW (1981) The reliability of suspended load data. In: Erosion and sediment transport measurement, vol 133. IAHS Publ., pp 177–194
Williams GP (1989) Sediment concentration versus water discharge during single hydrologic events in rivers. J Hydrol 111(1):89–106.
https ://doi.org/10.1016/0022-1694(89)90254 -0
Wood PA (1977) Controls of variation in suspended sediment concen-tration in the River Rother, West Sussex, England. Sedimentology 24(3):437–445. https ://doi.org/10.1111/j.1365-3091.1977.tb001 31.x
Yahiaoui A, Touaibia B (2011). Using decision support system tech-nique for hydrological risk assessment. Case of oued Mekerra in the western of Algeria. In: 4th international workshop on hydro-logical extremes, Italy. https ://slide playe r.com/slide /41351 27/
Yles F, Bouanani A (2016) Sédiments en suspension et typologie des crues dans le bassin versant de l’oued Saïda (Hauts plateaux algé-riens). J Water Sci 29(3):213–229. https ://doi.org/10.7202/10389 25ar
Zhao G, Yue X, Tian P, Mu X, Xu W, Wang F, Gao P, Sun W (2017) Comparison of the suspended sediment dynamics in two loess
plateau catchments, China. Land Degrad Dev 28(1):1398–1411.
https ://doi.org/10.1002/ldr.2645
Publisher’s Note Springer Nature remains neutral with regard to