3-GHz, ultrafast Yb-fiber laser sources: closing the spectral gaps
The MIT Faculty has made this article openly available. Please share
how this access benefits you. Your story matters.
Citation
Chen, Hung-Wen, Jinkang Lim, Shanhui Xu, Zhongmin Yang, Franz
X. Kärtner, and Guoqing Chang. “3-GHz, Ultrafast Yb-Fiber Laser
Sources: Closing the Spectral Gaps.” Edited by Zhiwen Liu. Ultrafast
Nonlinear Imaging and Spectroscopy II (September 5, 2014). © 2014
Society of Photo-Optical Instrumentation Engineers (SPIE)
As Published
http://dx.doi.org/10.1117/12.2060745
Publisher
SPIE
Version
Final published version
Citable link
http://hdl.handle.net/1721.1/100523
Terms of Use
Article is made available in accordance with the publisher's
policy and may be subject to US copyright law. Please refer to the
publisher's site for terms of use.
3-GHz, ultrafast Yb-fiber laser sources: closing the spectral gaps
Hung-Wen Chen,
1Jinkang Lim,
1Shanhui Xu,
3Zhongmin Yang,
3Franz X. Kärtner,
1,2,4and Guoqing Chang
1,2,*1
Research Laboratory of Electronics, Massachusetts Institute of Technology,
77 Mass Ave Cambridge MA 02139
2
Center for Free-Electron Laser Science, DESY, Notkestraße 85,
D-22607 Hamburg, Germany
3
State Key Laboratory of Luminescent Materials and Devices and Institute of Optical
Communication Materials, South China University of Technology,
Guangzhou 510640, China
4
Physics Department, University of Hamburg, Luruper Chaussee 149,
22761 Hamburg, Germany
*
guoqing.chang@desy.de
ABSTRACT
Many applications require GHz femtosecond pulses with the center wavelength tunable over a broad range. Recently we have demonstrated a 3-GHz, femtosecond Yb-fiber laser system with >12-W average power using the pre-chirp management method. Nonlinear wavelength conversion based on this powerful laser source has enabled us to derive 3-GHz femtosecond sources at other useful wavelengths: using stimulated Raman scattering inside photonic crystal fibers, we have implemented a femtosecond Raman soliton source tunable between 1.06-1.35 μm; using fiber-optic Cherenkov radiation, we have demonstrated a 14-fs source centered at 850 nm with >300-mW average power.
Keywords: Fiber-optic Cherenkov radiation, photonic crystal fiber, generalized nonlinear Schrödinger equation, coherence length, continuum generation
1. INTRODUCTION
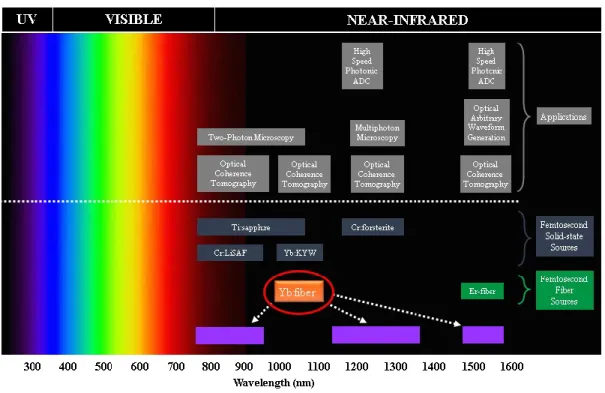
Many applications require femtosecond lasers with high repetition rate. In the time domain, a higher repetition rate means more pulses in a fixed time period. For nonlinear bio-optical imaging [1] (e.g., two-photon fluorescence excitation microscopy) in which photoinduced damage is caused by pulse energy rather than average power, increasing pulse repetition-rate will improve signal-to-noise ratio and reduce data acquisition time [2,3]. In the frequency domain, a higher repetition rate means that the comb line spacing is larger. This permits access to and manipulation of each individual comb line. Such capabilities have opened numerous frequency-domain applications including optical arbitrary waveform generation [4–6], and high-resolution spectroscopy [7]. Furthermore, femtosecond optical sources in the optical spectral range between 0.7 μm and 1.55 μm have found many applications such as optical coherence tomography [8–10], high speed optical sampling [11,12], photonic analog-to-digital conversion [13], and multi-photon spectroscopy [14], to name a few. To date, femtosecond solid-state lasers are mainly employed in these applications. Figure 1 shows the wavelength coverage of different solid-state lasers and the wavelength range required for various applications. Take the two most common femtosecond solid-state lasers for example: a Ti:sapphire laser [15–17] can cover 0.7–1.1 μm, useful for optical coherence tomography and multi-photon biological imaging. A Cr:forsterite laser [18–20] can operate in the wavelength range from 1.15 to 1.35 μm, an important wavelength regime for multi-photon microscopy because light in this wavelength range experiences lower scattering loss and higher penetration depth for most biology samples. The generated two-photon and three-photon signals in the visible range facilitate the signal detection. Solid-state lasers are usually expensive, bulky, and prone to misalignment. The gain crystals often require water cooling. These
UV
VISIBLE NEAR- INFRARED tosecond Fíber oorces 300 400 500 600 700 800 900 1000 1100 1200 1300 1400 1500 1600 Wavelength (run)disadvantages prevent their wide usage outside a lab environment. The mentioned versatile applications can be even more practical if we are able to make the overall system less expensive, flexible, and easy to maintain.
Fig. 1. Femtosecond sources and applications at djfferent optical spectral range.
To solve the issues of cost, portability, and the cooling of the gain crystal in the wavelength range of 0.7 μm to 1.35 μm, we resort to fiber laser technology. Among the well-developed active fibers (e.g., Yb-fiber, Er-fiber, Tm-fiber, Ho-fiber, etc.), Yb-fiber excels for its excellent power scalability due to a low quantum defect. Yb-fiber lasers provide wavelength coverage of 1.01–1.08 μm, making them a good candidate to perform broadband frequency conversion to cover the wavelength range from 0.7 μm to 1.35 μm. Furthermore, we can also use difference frequency generation to develop an alternative source to Er-fiber lasers.
2. 3-GHZ YB-FIBER BASED MODELOCKED OSCILLATOR
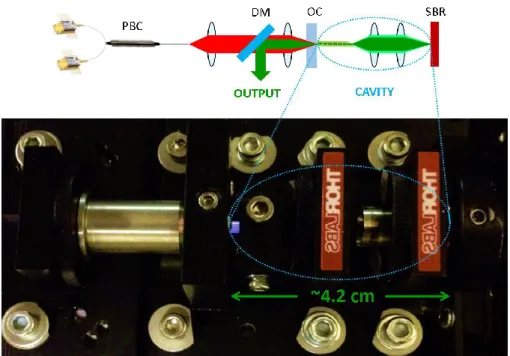
Constructing fundamentally mode-locked Yb-fiber lasers with >1-GHz repetition rate [21] and femtosecond pulse duration demands two crucial elements: (1) a short (<10 cm), highly doped Yb-fiber to provide enough round-trip gain and self-phase modulation, and (2) a dispersion compensating device to provide enough negative group-delay dispersion (GDD) to compensate for the positive GDD from the Yb-fiber and other intra-cavity components (e.g., lens). In our experiment the Yb-doped phosphate glass fiber has the highest reported Yb3+ concentration of 15.2 wt% and exhibits
46-dB/cm absorption at 976 nm. The net gain coefficient of the phosphate glass fiber was measured to be 5.7 46-dB/cm [22]. The 1-cm long fiber is encapsulated in a ceramic ferrule. The polished end of the fiber is directly attached to an output coupler. The cavity dispersion is compensated by a specially designed coating on the output coupler. It is customized to compensate the normal dispersion from a 7-cm long fused silica fiber and allows >97% pump transmission at 976 nm and 10% ± 2% signal transmission at 1010-1050 nm. It is designed to provide -1000 fs2 ± 200 fs2 GDD at 1010-1050 nm, when attached to fused silica (i.e. input medium: fused silica), in order to render a negative-dispersion laser cavity for soliton pulse formation. The thickness of the coating is ~10 um with alternating layers of Ta2O5 and SiO2.
PBC
DM OC SBR
OUTPUT /
`
CAVITY
Fig. 2. (Top) schematic setup of the 3-GHz Yb-fiber oscillator. PBC: polarization beam combiner, DM: dichroic mirror, OC: output coupler, and SBR: saturable Bragg reflector. (Bottom) Photos of the oscillator cavity.
As shown in Fig. 2, the laser is configured as a linear cavity (indicated by the blue dotted circle) with a total length of ~4.2 cm. Two fiber-coupled pump diodes are power combined using a fiber-based polarization beam combiner, providing up to 1.2-W average power centered at 976 nm. A 22.5° incident angle dichroic mirror inserted between the combiner and the laser cavity separates the output laser power from the pump. The polished end of the fiber is directly attached to an output coupler. The pump beam after the dichroic mirror will be focused first, propagate through the output coupler, and then coupled into the polished end of the fiber. The other end of the Yb-fiber is angle polished (~8 degree) to avoid back reflection. Two aspheric lenses are used to re-image the fiber output onto a saturable absorber reflector (SBR) in order to initiate the mode-locking. The commercially available SBR has a non-saturable loss of 3%, a modulation depth of 5%, a saturation fluence of 40 µJ/cm2, and recovery time 1 ps.
Fig. 3. (a) Optical spectrum of the output pulse with 1073-mW pump power. (b) The RF spectrum with a resolution bandwidth of 3 kHz. (Adapted from Ref. [21].)
Mode-locking self-starts as the pump power reaches ~800 mW. With increasing pump power from 800 mW to 1.15 W, the modelocked output power grows accordingly from 32 mW to 53 mW. We characterized the laser at 1073-mW input pump power, corresponding to a laser power of 49 mW. The measured optical spectrum, shown in Fig. 3(a), has 5.5-nm
1.0050 1.015 1.025 1.035 1.045 0.2 0.4 0.6 0.8 1 Wavelength (um) P o w er ( a. u .) 3.008 3.0085 3.009 -100 -80 -60 -40 -20 RF Frequency (GHz) P o w er ( d B m )
(b)
(a)
bandwidth at full width at half maximum (FWHM). The RF spectrum recorded in Fig. 3(b) indicates a 3-GHz repetition rate with a signal to background ratio >60 dB. The output pulse duration is also measured by a background free autocorrelator; the resulting autocorrelation trace plotted in Fig. 4(a) shows a 319-fs FWHM duration (black line). As a comparison, the autocorrelation trace of the transform limited pulse calculated from the optical spectrum in Fig. 3(a) is plotted in Fig. 4(a) as the red dashed line. With a de-convolution factor of 1.54 (assuming a hyperbolic secant pulse profile), the pulse duration is estimated to be ~206 fs. It is about 56-fs longer than the calculated transform-limited duration shown in Fig. 4(b) (i.e. 150 fs), showing that the optical pulses are slightly chirped.
Fig. 4. (a) The measured autocorrelation trace of the output pulse (black line) and the calculated autocorrelation trace of the transform-limited pulse (red dashed line). (b) The transform limited pulse. (Adapted from Ref. [21].)
3. FIBER AMPLIFIER OPTIMIZATION ON HIGH-QUALITY PULSE
COMPRESSION
Yb-doped fiber amplifiers (YDFAs) feature superior power scalability, large single-pass gain (~30 dB), high electrical-to-optical conversion efficiency, excellent beam quality, as well as compactness and robustness. To avoid detrimental effects from fiber nonlinearities when amplifying ultrashort pulses, YDFAs normally operate in a low-nonlinearity regime using chirped pulse amplification (CPA) [23,24], in which the spectral bandwidth of the amplified pulse only changes slightly during the amplification.
For some applications, strong nonlinear effects are preferred in YDFAs such that the amplified pulse acquires substantial extra bandwidth, and therefore can be compressed to be much shorter than the pulse prior to the amplification. This operation regime is of particular importance for implementing high repetition-rate (>1 GHz) master-oscillator-power-amplification (MOPA) systems Primarily limited by the available pump power (~1W) from single-mode laser diodes and low intra-cavity pulse energy, these multi-GHz fiber oscillators typically produce sub-picosecond/picosecond pulses with <100 mW average power. The poor performance on pulse duration and average power prevents multi-GHz fiber oscillators from most nonlinear optical applications that usually demand femtosecond (~100 fs) pulses of several nano-joules for pulse energy. Such a limitation can be overcome by nonlinear amplification in YDFAs which broadens the input pulse spectrum. The spectrally-broadened, power amplified pulses are then de-chirped by a subsequent optical compressor to much shorter pulse duration. However, the relatively narrow gain bandwidth (~40 nm) of Yb-doped fibers and the gain narrowing effect during the power amplification usually generates compressed pulses >100-fs with considerable pedestal. We both numerically and experimentally study the dependence of the compressed pulse quality on the parameters of the fiber amplifier and the input pulse from the fiber oscillator) [25]. We find that the input pulse pre-chirp—a quantity that can be easily tuned in experiments—is critical for optimizing the system to achieve high-quality compressed pulses [25]. -1000-750 -500 -2500 0 250 500 750 1000 0.2 0.4 0.6 0.8 1 Time (fs) P o w er ( a. u .) -10000 -500 0 500 1000 0.2 0.4 0.6 0.8 1 Time (fs) P o w er ( a. u .)
(a)
(b)
200 150 100 (a) -4 -3 -2 -1 0 1 2 3 4 Pre- chirping GDD (fs2) x104 200 E rn a a 2 50 a 0 1000 1020 1040 1060 Wavelength (nm) 200 0.1 0.08 E 150 m 0.06 ó100 ó 0.04 to' ß o. 2 50 0.02 a-1000 1020 1040 1060 Wavelength (nm) 200 0.04 0.035 ---E 150 -0.03 a, U C --0.025 -0.02 g 100 -0.015 a 10.01 á 50 0.005 0 0 1000 1020 1040 1060 Wavelength (nm) 0.04 0.035 0.03 0.025 0.02 0.015 0.01 0.005 Fig. 5. Optimum RMS duration of the compressed-pulse and the corresponding transform- limited RMS duration as a function of pre-chirping GDD for the input pulse. Insets: compressed pulses and transform-limited pulses for three different pre-chirp. (Adapted from Ref. [25].)
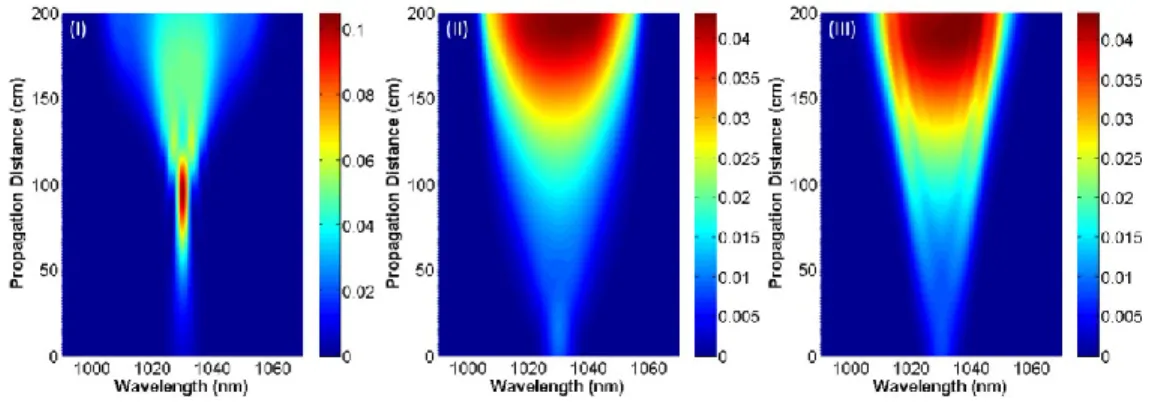
Fig. 6. Spectral evolution for three different pre-chirping GDD: (I) -5×10⁴ fs2, (II) 0 fs2, and (III) 1.9×10⁴ fs2.
We combine the steady-state propagation-rate equations and the GNLSE to model an ultrafast Yb-fiber amplifier configured in co-pumping scheme (i.e., pump and seed propagate in the same direction.). We use our model to investigate the effect of pre-chirping the signal pulse on pulse compression at a fixed Yb-fiber length of 1.8 m. As Fig. 5 shows, the transform-limited RMS duration (green, dashed line) slightly varies within the pre-chirp ranging from -7×10⁴-
2×10⁴ fs2. However the optimum RMS duration for the compressed pulse strongly depends on the pre-chirp. Insets of
Fig. 5 plots the compressed pulse (blue, solid line) and transform-limited pulse (red, dashed line) for three different pre-chirps: (I) -5×10⁴ fs2, (II) 0 fs2, and (III) 1.9×10⁴ fs2. Fig. 6 illustrates the spectral evolution along the Yb-fiber for these
three pre-chirping cases. Note that for negatively pre-chirped input-pulse (e.g., case I), its spectrum (blue, solid line) experiences an initial spectral compression and then subsequent spectral broadening. While the case III generates the broadest spectrum, both the transform-limited pulse and the optimum compressed-pulse are longer than the other two
PBC1 3 GHz Yb -fiber oscillator
Of0
00t lit D
go
Transmission Grating HW1 WDM1 PBÇ2i
O
O
WDM2 WIt
BC HW2 tJ O Double -Clad Yb -Fiberir
Diffraction Grating HW4 HW3 z 0.5 -0 -500 0 500 o_ Time (fs) Measured AC of Compressed Pulses Calculated AC of Transform-limited Pulses sz 0.5 a. 0 0.99 1 1.0- 1 1.02 1.03 1.04 1.05 1.06 1.07 Wavelength (um) - Oscillator - Pre-Amplifier - Power Amplifiercases due to the existence of a strong pedestal. It suggests that varying input pulse’s pre-chirp leads to different spectra, some of which exhibit a considerable temporal pedestal that compromises the compressed-pulse quality. There exists an optimum pre-chirp that leads to a compressed pulse with the shortest duration close to its transform-limited duration (see case I inside Fig. 5) though the spectrum is compressed first and subsequently broadened.
Fig. 7. Schematic setup of the 3-GHz high power femtosecond laser system. HW: half-wave plate; PBC: polarization beam combiner; BC: (6+1) x 1 beam combiner; SPF: short-wavelength-pass optical filter that only transmits wavelength components below 950 nm; and DCM: double-chirped mirror.
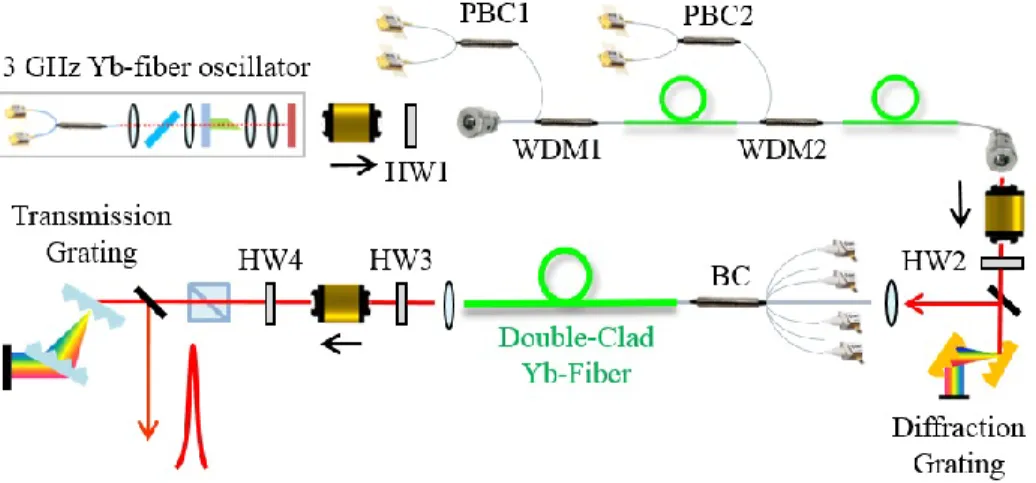
We employ this pre-chirp management for building a high power 3 GHz femtosecond laser system. Such a laser system enables us to demonstrate an ultrafast few-cycle source at the Ti:Sa wavelength range (section 4) and a Watt-level femtosecond tunable Raman soliton source (section 5). Fig.7 shows the schematic setup of the high power 3-GHz laser source, mainly consisting of: 1) a 3-GHz fundamentally mode-locked Yb-fiber oscillator, 2) a two-stage polarization-maintaining (PM) fiber amplifier to pre-amplify the oscillator pulses, 3) a diffraction-grating pair for pre-chirp management prior to further power amplification, 4) a double-clad Yb-fiber power amplifier, 5) a transmission-grating pair to compress the amplified pulses.
Fig. 8 Optical spectra at the output of the 3-GHz oscillator (blue line), pre-amplifier (red line), and power amplifier (green line), respectively. Inset: measured autocorrelation (AC) trace of the compressed pulses after the power-amplifier (solid line) and the calculated autocorrelation trace of the transform-limited pulse (dotted line). (Adapted from Ref. [28].)
The 3-GHz Yb-fiber oscillator, centered at 1027 nm with 3.5 nm bandwidth (blue line in Fig. 8), produces 32 mW average power. The output pulses are amplified to 1.05 W by a two-stage pre-amplifier constructed from single-mode PM fibers; the resulting optical spectrum is broadened to 7 nm (red line in Fig. 8). Before the pre-amplified
Output Spectrum Fitered Output Spectrum
CM
.lD a a 1pm
11lD CO 1333Winelenth(1
pulses enter the power amplifier, we employ the pre-chirp management method to achieve high-quality compressed pulses after the power amplifier. The pulses are pre-chirped by a diffraction-grating (600 line/mm) pair, and then amplified by a power amplifier constructed from 2.4-m double-clad Yb-fiber (10-μm core diameter) spliced to a PM (6+1) x 1 beam combiner. The amplified pulses are spectrally broadened to 30-nm bandwidth (green line in Fig. 8) during the amplification and are then compressed by a transmission-grating (1000 line/mm) pair. By properly pre-chirping the pre-amplified pulses, we achieve compressed pulses with 12-W average power and the measured autocorrelation trace is 140 fs in duration shown as the solid curve in the inset of Fig. 8. As a comparison, the autocorrelation trace of the transform-limited pulse calculated from the optical spectrum is plotted as the dotted curve, showing an autocorrelation duration of 95 fs.
4. 3 GHZ YB-FIBER LASER BASED FEW-CYCLE SOURCE AT THE TI:SAPPHIRE
WAVELENGTH
Kerr-lens mode-locked Ti:sapphire lasers have become the workhorses in the field of ultrafast optics. Due to the remarkable gain bandwidth ranging from 650 to 1100 nm, Ti:sapphire lasers with precise cavity-dispersion management emit optical pulses as short as 5 fs—the record short optical pulses ever directly generated from mode-locked lasers [15]. Besides countless time-domain applications utilizing the extremely short pulses, the wavelength range covered by Ti:sapphire lasers is of particular importance for many applications. For example, ultrafast Ti:sapphire lasers are the dominant light source in the field of nonlinear optical microscopy largely because optical pulses with wavelength around 800 nm are able to excite a wide range of important fluorophores via two-photon absorption [1]. Despite their extreme success, the lack of efficient and direct diode pumping has hampered the wide use of Ti:sapphire lasers outside research laboratories, which has spurred much research effort in developing alternative laser sources.
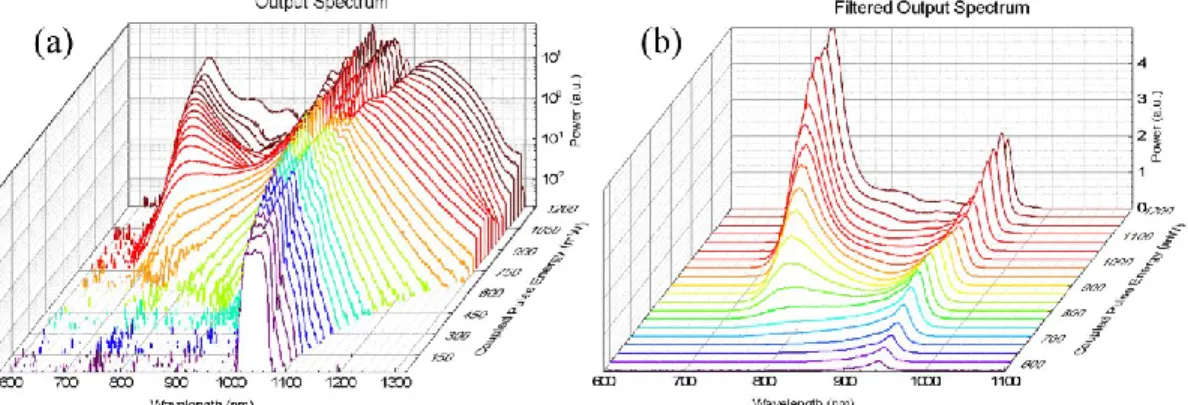
Fig. 9. (a) Measured output spectra versus coupled pulse energy into 3.7-cm PCF NL-3.2-945. Spectral power is shown on a logarithm scale. (b) Measured output spectra after a short-wavelength-pass optical filter that blocks spectral components above 950 nm. Spectral power is shown on a linear scale.
In this section, we demonstrate a compact ultrafast source centered at 850 nm with >200-nm bandwidth (full width at half maximum) based on the 3-GHz Yb-fiber master-oscillator-power-amplifier system discussed in the last section. The output pulses (with up to 13 W average power) from the laser system are coupled into a 37-mm PCF (NL-3.2-945). As the coupled pulses propagate in the PCF, dispersive waves at shorter wavelength are generated due to the perturbation of high-order fiber dispersion—a phenomenon known as fiber-optic Cherenkov radiation (FOCR). Figure 9(a) shows the measured spectra from the PCF’s output as a function of coupled pulse energy. To observe the evolution of FOCR spectra, we use a short-wavelength-pass optical filter to collect the spectral components below 950 nm, and plot them in Fig. 9(b), shown on a linear scale. It clearly shows that a spectral gap begins to form around 850 nm as pulse energy increases beyond 780 pJ, and an isolated FOCR spectrum appears with its center wavelength blue-shifted with the increased pulse energy. The curve in Fig. 10(a) denotes the average power of the filtered spectrum, which increases monotonically for higher coupled pulse energy. At 780-pJ coupled pulse energy, 184-mW average power (i.e., 61-pJ pulse energy) is achieved. It is noteworthy that the optimum pulse energy corresponding to the broadband, non-isolated FOCR depends on the PCF length: shorter PCF requires more input pulse energy [26, 27]. In addition to the 37-mm PCF, we have tested another two fiber lengths and found that the required input pulse energy to achieve a broadband FOCR is
1.0 Wavelength (nm) 0.0 (b)
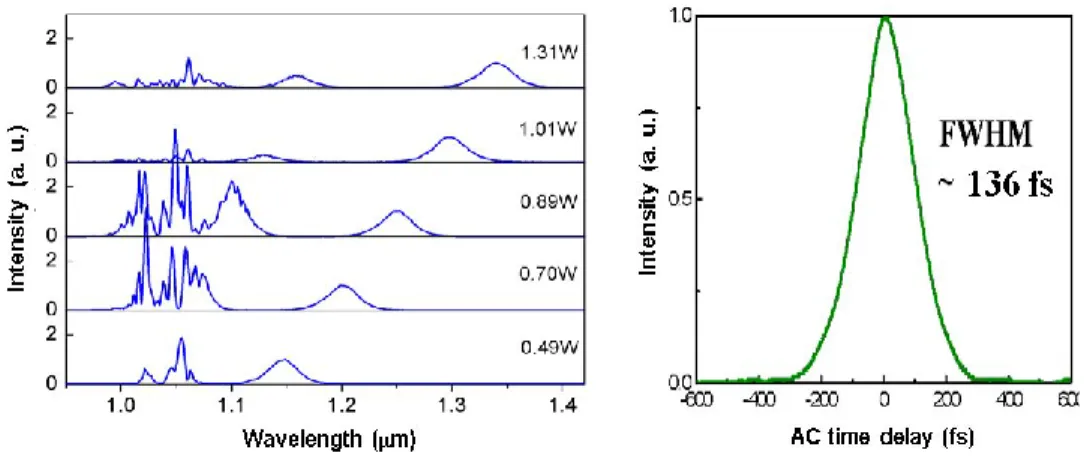
FWHM
-100 -75 -50 -25 0 25 50 75 100 Time Delay ((s) 2 0 2 0 2 0 N 2 5 0 2 0 31W 1.01W .n 0.89W 0.70W 0.49W 1.0 1.1 1.2 1.3 Wavelength (W) 1.4 1.0ä
0.0 {-00 -017 -203 0 210 470 AC time delay (fs) E1:Oabout 440 pJ for 48-mm PCF and 1430 pJ for 28-mm PCF with similar spectral shapes. The average filtered power is 94 mW and 384mW, respectively.
Fig. 10. (a) Filtered spectra of broadband FOCR generated by the 37–mm PCF. (b) Black solid line: measured autocorrelation trace of the compressed FOCR pulse using DCMs to phase compensate for FOCR spectrum (the spectrum shown in (a)) generated from the 37-mm PCF with 780-pJ input pulse energy. Red dashed line: calculated autocorrelation trace of the transform-limited pulse given by the FOCR spectrum in (a). (Adapted from Ref. [28].)
Since the FOCR is initiated by nonlinearity interacting with higher-order dispersion, the compressibility of the FOCR continuum remains questionable. To answer this, we use a 950-nm short-pass filter to slice out the FOCR continuum from the output spectrum of a 3.7-cm PCF. The filtered continuum, shown in Fig. 10(a), has >200-nm bandwidth (FWHM) with an average power 184 mW. The calculated transform-limited pulse duration is 8-fs. We then compensated for the spectral phase using double-chirped mirrors (DCM); each bounce provides a group-delay dispersion of -70 fs2.
The corresponding pulses were measured by an autocorrelator. Figure 10(b) shows the measured shortest autocorrelation trace (black line); it has a duration (FWHM) of 19.5 fs. Also shown in this figure (red dotted curve) is the calculated autocorrelation trace of the transform-limited pulse (red dotted line); the autocorrelation duration is 11 fs. We estimated that the compressed pulses using 8 DCM bounces have a duration of ~14 fs [28].
5. WATT-LEVEL, 3-GHZ FEMTOSECOND RAMAN SOLITON SOURCES
In this section, we present a 3-GHz femtosecond Raman soliton source tunable from 1.15 μm to 1.35 μm, yielding ultrashort pulses with up to 0.9 W average power at 1.35 μm [29]. Such a Raman soliton source exhibits both the highest repetition rate and average power to the best of our knowledge.
Fig. 11. Raman soliton generation as a function of input power for 87-cm PCF NL-3.2-945. (left)The average power coupled into the PCF is also shown for each spectrum. The spectra are normalized to the peak of the first Raman soliton spectrum respectively. (right) Measured autocorrelation trace of the Raman soliton pulse at 1.35 m.
1.35
r
1.30 o C 9 1.25 r. t 1.20j
1.15 -(a).
/-I/
/ / -s-I--
NL-3.2-945: 54cm1
. fi
NL-3.2-945: 30cm/.
11
4 1 2 3 4 5Coupled power into PCF (W)
1.00 0.80 0.60 0.40 0.20 1.15 1.20 1.25 1.30 1.35
24. of the 1" Raman soliton (µm)
peak
b)
NL 3.2-945: 87cm-k-
NL-3.2-945: 54cm 7 NL-3.2-945: 30cm 1'.'
The same pre-chirp managed pulses are launched into PCFs to generate Raman soliton pulses. We record the output spectra from 87-cm PCF NL-3.2-945 (NKT photonics) for different input average powers in Fig. 11(a). As the power increases, the Raman soliton peak wavelength (peak) is further red-shifted and a second Raman soliton starts to emerge.
When the input power is 1.31-W, the 1st Raman soliton peak was generated at 1.35 m with 30-nm (FWHM) spectral bandwidth. We filtered out this Raman soliton spectrum and measured the autocorrelation trace in Fig. 11(b), which has 210-fs (FWHM) in duration; it corresponds to a hyperbolic secant pulse of 136-fs with a de-convolution factor 1.54. We also measured the peak wavelength (peak) and average power of the 1st Raman soliton generated from PCF
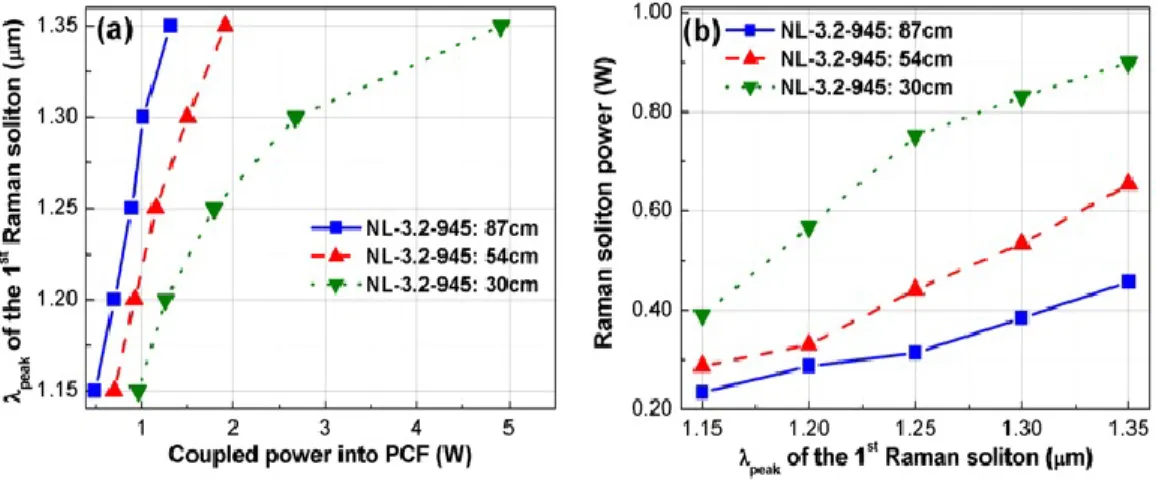
NL-3.2-945 at three lengths: 87 cm, 54 cm, and 30 cm (Fig. 12). As Fig. 12(a) shows, when shorter PCFs are used to generate Raman solitons at the same wavelength higher input power is required. For example, the power requirement to produce a Raman soliton pulse at 1.35 m is 1.31-W, 1.91-W, and 4.90- W for PCF length of 87 cm, 54 cm, and 30 cm, respectively. Figure 12(b) plots the average power of the 1st Raman soliton as a function of its peak wavelength for the three PCF lengths. As expected, we observe that the average power monotonically increases with respect to the peak wavelength. At the same peak wavelength, using shorter PCF leads to stronger Raman soliton pulse; especially, the Raman soliton pulse peak at 1.35 m from 30-cm PCF NL-3.2-945 has an average power of 0.9 W.
Fig. 12. (a) Peak wavelength of the first Raman soliton as a function of input power for PCF NL-3.2-945 at three different lengths; 87cm, 54cm, and 30cm. (b) Average power of the first Raman soliton as a function of the first Raman soliton peak wavelength for PCF NL-3.2-945 at three different lengths. (Adapted from Ref. [29].)
6. CONCLUSION
We demonstrate a fundamentally mode-locked, femtosecond (~206 fs) Yb-fiber laser with the highest repetition-rate of 3
GHz. With 1-cm heavily Yb-doped phosphate glass fiber as the gain medium and a high-dispersion (-1300 fs2) output
coupler for dispersion compensation, the laser self-starts and produces up to 53-mW average power. With this oscillator seeding a chain of Yb-fiber amplifiers followed by a diffraction-grating based compressor, we obtain ~110-fs pulses with >12-W average power. we demonstrate that a combination of a high power 3-GHz Yb-fiber laser system and fiber-optic Cherenkov radiation provides new capabilities to ultrafast laser technology: generation of ~14 fs pulses with smooth spectra and broadband wavelength coverage overlapping with the Ti:sapphire lasers wavelength range. We also demonstrate a 3 GHz, femtosecond Raman soliton source tunable from 1.15 µm to 1.35 µm. Using 30-cm photonic crystal fiber, the resulting Raman soliton pulse at 1.35 µm has 0.9 W average power.
REFERENCES
[1] B. R. Masters and P. T. C. So, Handbook of Biomedical Nonlinear Optical Microscopy (Oxford University Press, 2008).
[2] N. Ji, J. C. Magee, and E. Betzig, "High-speed, low-photodamage nonlinear imaging using passive pulse splitters," Nat. Methods 5, 197–202 (2008).
[3] S.-W. Chu, T.-M. Liu, C.-K. Sun, C.-Y. Lin, and H.-J. Tsai, "Real-time second-harmonic-generation microscopy based on a 2-GHz repetition rate Ti:sapphire laser," Opt. Express 11, 933 (2003).
[4] E. Ippen, A. Benedick, J. Birge, H. Byun, L.-J. Chen, G. Chang, D. Chao, J. Morse, A. Motamedi, M. Sander, G. Petrich, L. Kolodziejski, and F. Kärtner, "Optical Arbitrary Waveform Generation," in Conference on Lasers and Electro-Optics 2010, OSA Technical Digest (CD) (Optical Society of America, 2010), p. JThC4.
[5] S. Yoo, "Monolithically integrated optical arbitrary waveform generators by line-by-line amplitude and phase modulation," in IEEE Lasers and Electro-Optics Society, 2008. LEOS 2008. 21st Annual Meeting of the (2008), pp. 425–426.
[6] S. T. Cundiff and A. M. Weiner, "Optical arbitrary waveform generation," Nat. Photonics 4, 760–766 (2010). [7] S. A. Diddams, "The evolving optical frequency comb," J. Opt. Soc. Am. B 27, B51–B62 (2010).
[8] D. Huang, E. A. Swanson, C. P. Lin, J. S. Schuman, W. G. Stinson, W. Chang, M. R. Hee, T. Flotte, K. Gregory, C. A. Puliafito, and J. G. Fujimoto, "Optical coherence tomography," Science 254, 1178–1181 (1991).
[9] J. M. Schmitt, "Optical coherence tomography (OCT): a review," IEEE J. Sel. Top. Quantum Electron. 5, 1205–1215 (1999).
[10] J. G. Fujimoto, "Optical coherence tomography for ultrahigh resolution in vivo imaging," Nat. Biotechnol. 21, 1361–1367 (2003).
[11] J. A. Bell, M. C. Hamilton, D. A. Leep, T. D. Moran, H. F. Taylor, and Y.-H. Lee, "Extension of electronic A/D converters to multi-gigahertz sampling rates using optical sampling and demultiplexing techniques," 1, 289– 293 (1989). [12] A. Yariv and R.G.M.P. Koumans, "Time interleaved optical sampling for ultra-high speed A/D conversion," Electron. Lett. 34, 2012–2013 (1998).
[13] A. Khilo, S. J. Spector, M. E. Grein, A. H. Nejadmalayeri, C. W. Holzwarth, M. Y. Sander, M. S. Dahlem, M. Y. Peng, M. W. Geis, N. A. DiLello, J. U. Yoon, A. Motamedi, J. S. Orcutt, J. P. Wang, C. M. Sorace-Agaskar, M. A. Popović, J. Sun, G.-R. Zhou, H. Byun, J. Chen, J. L. Hoyt, H. I. Smith, R. J. Ram, M. Perrott, T. M. Lyszczarz, E. P. Ippen, and F. X. Kärtner, "Photonic ADC: overcoming the bottleneck of electronic jitter," Opt. Express 20, 4454–4469 (2012).
[14] W. Denk, J. H. Strickler, and W. W. Webb, "Two-photon laser scanning fluorescence microscopy," Science 248, 73–76 (1990).
[15] R. Ell, U. Morgner, F. X. Kärtner, J. G. Fujimoto, E. P. Ippen, V. Scheuer, G. Angelow, T. Tschudi, M. J. Lederer, A. Boiko, and B. Luther-Davies, "Generation of 5-fs pulses and octave-spanning spectra directly from a Ti:sapphire laser," Opt. Lett. 26, 373–375 (2001).
[16] U. Morgner, F. X. Kärtner, S. H. Cho, Y. Chen, H. A. Haus, J. G. Fujimoto, E. P. Ippen, V. Scheuer, G. Angelow, and T. Tschudi, "Sub-two-cycle pulses from a Kerr-lens mode-locked Ti:sapphire laser," Opt. Lett. 24, 411–413 (1999). [17] L.-J. Chen, A. J. Benedick, J. R. Birge, M. Y. Sander, and F. Kärtner, "Octave-spanning, dual-output 2.166 GHz Ti:sapphire laser," Opt. Express 16, 20699–20705 (2008).
[18] A. Seas, V. Petričević, and R. R. Alfano, "Generation of sub-100-fs pulses from a cw mode-locked chromium-doped forsterite laser," Opt. Lett. 17, 937 (1992).
[19] A. Seas, V. Petričević, and R. R. Alfano, "Self-mode-locked chromium-doped forsterite laser generates 50-fspulses," Opt. Lett. 18, 891–893 (1993).
[20] V. Yanovsky, B. I. Minkov, Y. Pang, and F. Wise, "Generation of 25-fs pulses from a self-mode-locked Cr:forsterite laser with optimized group-delay dispersion," Opt. Lett. 18, 1541–1543 (1993).
[21] H.-W. Chen, G. Chang, S. Xu, Z. Yang, and F. X. Kärtner, "3 GHz, fundamentally mode-locked, femtosecond Yb-fiber laser," Opt. Lett. 37, 3522–3524 (2012).
[22] S. H. Xu, Z. M. Yang, T. Liu, W. N. Zhang, Z. M. Feng, Q. Y. Zhang, and Z. H. Jiang, "An efficient compact 300 mW narrow-linewidth single frequency fiber laser at 1.5 µm," Opt. Express 18, 1249–1254 (2010).
[23] D. Strickland and G. Mourou, "Compression of amplified chirped optical pulses," Opt. Commun. 55, 447–449 (1985).
[24] A. Galvanauskas, "Mode-scalable fiber-based chirped pulse amplification systems," IEEE J. Sel. Top. Quantum Electron. 7, 504 –517 (2001).
[25] H.-W. Chen, J. Lim, S.-W. Huang, D. N. Schimpf, F. X. Kärtner, and G. Chang, "Optimization of femtosecond Yb-doped fiber amplifiers for high-quality pulse compression," Opt. Express 20, 28672–28682 (2012).
[26] G. Chang, L.-J. Chen, and F. X. Kärtner, "Highly efficient Cherenkov radiation in photonic crystal fibers for broadband visible wavelength generation," Opt. Lett. 35, 2361–2363 (2010).
[27] G. Chang, L.-J. Chen, and F. X. Kärtner, "Fiber-optic Cherenkov radiation in the few-cycle regime," Opt. Express 19, 6635–6647 (2011).
[28] H.-W. Chen, Z. Haider, J. Lim, S. Xu, Z. Yang, F. X. Kärtner, and G. Chang, "3 GHz, Yb-fiber laser-based, few-cycle ultrafast source at the Ti:sapphire laser wavelength," Opt. Lett. 38, 4927–4930 (2013).
[29] H.-W. Chen, Z. Haider, J. Lim, S. Xu, Z. Yang, F. X. Kärtner, and G. Chang, "3 GHz, Watt-level femtosecond Raman soliton source," Opt. Lett. 39, 2060–2063 (2014).