D
YNAMIC FUNCTIONAL NETWORK CONNECTIVITY USING DISTANCE
CORRELATION
Rudas, Jorgea; Guaje, Javiera; Demertzi, Athenab; Heine, Lizetteb; Tshibanda, Luabab; Soddu,
Andreac; Laureysb, Steven; Gómez, Franciscod
aComputer Science Department, National University, Colombia bCyclotron Research Center,University of Liège,
Belgium
cPhysics and Astronomy Department, Western University,Canada dComputer Science Department, Central
University, Colombia
KEYWORDS: Disorders of consciousness, dynamical functional network connectivity, resting state
networks, windowed distance correlation
ABSTRACT
Investigations about the intrinsic brain organization in resting-state are critical for the understanding of healthy, pathological and pharmacological cerebral states. Recent studies on fMRI suggest that resting state activity is organized on large scale networks of coordinated activity, in the so called, Resting State Networks (RSNs). The assessment of the interactions among these functional networks plays an important role for the understanding of different brain pathologies. Current methods to quantify these interactions commonly assume that the underlying coordination mechanisms are stationary and linear through the whole recording of the resting state phenomena. Nevertheless, recent evidence suggests that rather than stationary, these mechanisms may exhibit a rich set of time-varying repertoires. In addition, these approaches do not consider possible non-linear relationships maybe linked to feed-back communication mechanisms between RSNs. In this work, we introduce a novel approach for dynamical functional network connectivity for functional magnetic resonance imaging (fMRI) resting activity, which accounts for non-linear dynamic relationships between RSNs. The proposed method is based on a windowed distance correlations computed on resting state time-courses extracted at single subject level. We showed that this strategy is complementary to the current approaches for dynamic functional connectivity and will help to enhance the discrimination capacity of patients with disorder of consciousness.
INTRODUCTION
Recent studies on functional magnetic resonance imaging (fMRI) suggest that healthy brain in resting state is organized in large-scale of resting state networks (RSNs).1 The existence of at least
ten of these RSNs (default mode network (DMN), executive control network left (ECL), executive control network right (ECR), saliency, sensorimotor, auditory, cerebellum and three visual networks medial, lateral and occipital) have been consistently reported in healthy controls.2 Each
RSN encompasses a set of spatial regions with a common functional behavior or time-course. Several brain pathological conditions including disorders of consciousness, dementia and Alzheimer’s, among others, have been studied using the RSN approach.3, 4 These studies mainly
focus on changes of intrinsic connectivity of one RSN, usually, the DMN. However, recent evidence suggests that rather than one, multiple RSNs may be affected during pathological conditions. For instance, patients with disorders of consciousness showed alterations of the intrinsic connectivity on at least four networks:2 DMN, ECL, ECR and auditory. The alteration of multiple networks may
suggests also that the interaction mechanisms among RSNs may also be affected during neuropathological states. Therefore, interaction between RSNs may be relevant to better comprehend brain function in pathological states.5
The level of interaction during spontaneous activity among different RSNs can be used as a complementary resting state analysis strategy, through the so called functional network connectivity (FNC).5 In this approach pairwise measurements of interaction between RSNs
time-courses are computed. A measure of interaction commonly used in FNC is the Pearson correlation.5 This measurement assumes a lineal relationship among the RSNs time-courses.
Nevertheless, recent investigations suggests that neuronal function of cortical ensembles may follow non-linear behaviors during resting state, probably linked to feed-back mechanisms.6 In
addition, Pearson correlation is also supported on assumptions of stationary and non-variability across time for the RSN time-course relationship. An assumption, which was strongly debated recently in terms of novel evidence that shows that resting state dynamic is highly variable and cannot be explained just in terms of stationary behaviors.7,8 For instance, evidence on
magnetoencephalography recorded during resting state suggests that the power correlation between the DMN and the dorsal attention network is time-varying.9 Similar investigations
studying the interactions between the attentional network and the memory network have showed similar time-varying behaviors.10 In this scenario, Pearson correlation based FNC approaches may
be limited to capture the richness of the RSN interaction phenomena.
In this paper, we propose a novel FNC method that accounts for dynamic changes and non-linear relationships between different RSNs time-courses. The proposed method is based on a multiple RSN identification approach, which allows to select RSNs at individual level. Between RSN interactions were quantified across time using an slicing window version of the distance correlation.11 We show that this strategy may complement current approaches for dynamic
functional connectivity and may also improve the discrimination capacity of patients with disorder of consciousness.
MATERIALS AND METHODS
DATA AND PREPROCESSING
Data from 76 subjects, previously acquired,2 were used for this study: 27 healthy controls, 24
patients in minimal conscious state (MCS) and 25 with vegetative state/unresponsive wakefulness syndrome (VS/UWS). Data were acquired in the Hospital University Liège. For each subject, fMRI resting data were acquired in a 3T scanner (Siemens medical Solution in Erlangen, Germany). Three hundred fMRI volumes multislice T2 - weighted functional images were captured (32 slices; voxel size: 3 × 3 × 3 mm3; matrix size 64; repetition time = 2000 ms; echo time = 30 ms; flip angle =
78; field of view = 192 mm2). All patients were clinically examined using the French version of the
Coma Recovery Scale Revised (CRS-R).12 Written informed consent to participate in the study was
obtained from all patients or legal surrogates of the patients. SPM8 was used for processing of fMRI. Preprocessing includes: realignment, coregistration of functional onto structural data, segmentation of structural data, normalization into MNI space and spatial smoothing with a Gaussian kernel of 8 mm. Further correction for large head motions correction was performed using ArtRepair.
DYNAMICAL FNC METHOD
RSNS IDENTIFICATION
The fMRI signal was represented as a linear mix of sources statistically independent by using ICA (Independent component analysis). ICA aims to explain the signal into a set of statistically independent components (ICs) of brain activity. Given that the fMRI data the spatial dimension is much greater than temporal one, we used spatial ICA at single subject level, which decompose the signal into maximally independent spatial maps with an associated time course.13 For the RSNs
identification we selected the set of ICs that maximize the similarity with a set of RSN templates. After the RSN spatial map identification, a machine learning based labeling method was applied to discriminate between IC of “neuronal” or “artifactual” origin. A binary classification method based on support vector machines and an spatio-temporal feature vector was used for the ICs description.2 The RSN time-courses labeled as neuronal were subsequently used for all the FNC
computations.
RSN TIME-SERIES INTERACTION MEASUREMENT
For the computation of the RSN time-series interaction, we used the Distance correlation (DC),11
which accounts non-linear dependencies between random variables in arbitrary dimensions. DC aims to measure dependencies between two random variables X and Y with finite moments in arbitrary dimension, not necessarily of equal dimensions.11 For defining DC, we started with an
observed random sample (X, Y) = {(Xk, Yk )|k = 1, 2, . . . , n} of the joint distribution of random vectors
X in Rp and Y in Rq . Using these samples a transformed distance matrix A can be defined as follows:
With k, l = 1, 2, ..., n. Similarly, B is defined to characterize distances between samples for Y.
Following, the empirical distance is defined by .
Finally, the empirical DC corresponds to the square root of
Where (X) = (X, X). Note that A and B can be computed independently of p and q, and both contain information about between sample elements distances in X and Y . (X, Y ) is a measure of the distance between the probability distribution of the joint distribution and the product of the marginal distributions, i.e., (X, Y) quantifies ||fX,Y − fX fY ||, with fX and fY the characteristic function of X and Y , respectively, and fX,Y the joint characteristic function.11 In contrast to PC,
(X, Y) vanish if and only if X and Y are independent variables.11 The DC corresponds to a normalized
version of (X, Y), which takes values between 0 and 1, with zero corresponding to statistical independence between X and Y , and 1 total dependency. In order to explore the FNC dynamic behaviour we repeated the DC computations of across time using an sliding-window.14 In
particular, we computed T − w + 1 successive DC values from the truncated RSN time-courses in windows of size w, each one being shifted one TR with respect to the previous one, with T the number of volumes in the resting state fMRI acquisition (figure 1). For the computations, we used a fixed w of 240 s.
Figure 1. DC computations between two RSN time-courses extracted by using sliding-window running across the fMRI acquisition.
RESULTS
Figure 2 shows the differences between dynamic and static FNC approaches15 for the three
considered measurements (DC, NMI and PC). Static connectivity was computed by considering the whole time course in the interaction computations.15 To have a single estimation of the dynamic
functional connectivity, we computed the maximum of the dynamic functional connectivity across time. Connections width in figure 2 is related to the strength of the difference between static and dynamic FNC.14 As observed, dynamical FNC approaches are able to capture different information
about interaction compared to the static alternative. Interestingly, DC based computations resulted on less differences than the PC.
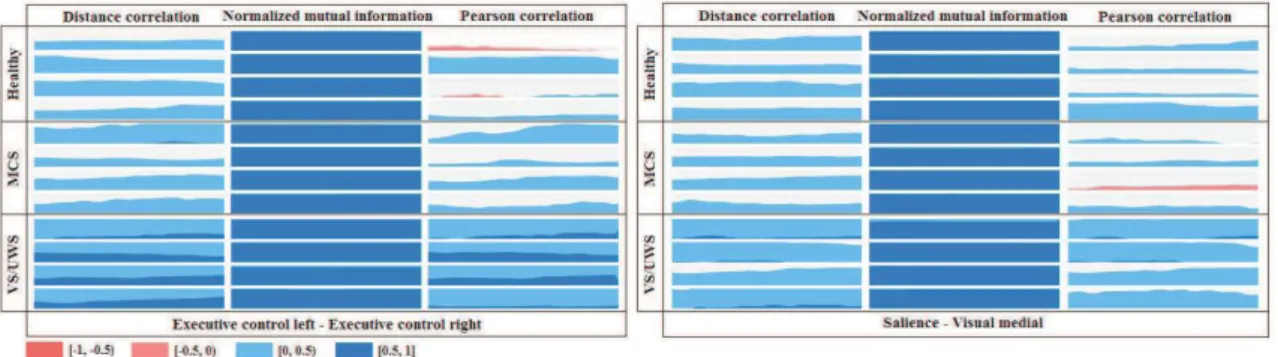
Figure 3 shows the dynamical FNC for interactions between ECL-ECL and Salience-Visual Medial, we focused this analysis in these interactions because previous study showed differences discriminating patients with DOC in these RSN connections.15 For the interaction quantification we
compared three measurements Pearson correlation (PC), normalized mutual information (NMI)16
and DC. As observed, DC captures different dynamical behavior than PC. DC also enhance possible difference between pathological conditions compared to other non-linear approaches as NMI. In order to study the strength of the discrimination capacity of the dynamical FNC approach based on PC, NMI and DC we performed a dynamical effect size analysis. For this, we computed the Cohen’s d coefficient comparing DC and PC values extracted for sliding-windows in two pathological conditions (MCS and VS/UWS). Figure 4 shows the dynamical effect size analysis. As observed, DC outperforms PC in discrimination capacity for ECL-ECR interaction. Nevertheless, in Salience-Visual Medial connection PC showed higher effect size than DC.
Figure 2. Difference between dynamic and static FNC approaches, for the three considered interaction measurements: DC, NMI and PC. Connection width is related to the strength of the difference between static and dynamic FNC. Static connectivity was computed using the whole time course, and the dynamic connectivity as computed as the maximum of the dynamic functional connectivity across time.
Figure 3. Dynamical FNC based on three measurements (Pearson correlation - left, normalized mutual information - center and distance correlation - right) for interactions between ECL-ECL and Salience-Visual Medial in randomly selected subjects in three categories (Control - top, MCS - center and VS/UWS bottom).
CONCLUSIONS
In this work, we proposed a novel method to study of dynamical functional network connectivity, in resting state fMRI. The strategy is based on a single subject RSN time-course extraction approach. Followed by a sliding window distance correlation computation. Our results indicate that dynamical FNC will highly different behaviors than linear based approaches. In addition, FNC based on DC will enhance the discriminative capacity for RSN interactions in patients with disorders of consciousness. Therefore, this measurement can be used as complementary tool to study dynamical behaviors in FNC.
ACKNOWLEDGMENT
This work was supported by the project “Caracterizacion de interacciones entre redes de descanso en pacientes con desordenes de conciencia” from Universidad Central de Colombia, the Belgian National Funds for Scientic Research (FNRS), the European Commission, the James McDonnell Foundation, the European Space Agency, Mind Science Foundation, the French Speaking Community Concerted Research Action, the Belgian interuniversity attraction pole, the Public Utility Foundation “Université Européenne du Travail” , “Fondazione Europea di Ricerca Biomedica” and the University Hospital of Liège.
References
1. M. Fox and M. Raichle, “ Spontaneous fluctuations in brain activity observed with functional magnetic resonance imaging,” Nat Rev Neurosci 8, p. 700711, 2007.
2. A. Demertzi, F. Gómez, J. Crone, A. Vanhaudenhuyse, L. Tshibanda, Q. Noirhomme, M. Thonnard, Charland-Verville, M. Kirsch, S. Laureys, and A. Soddu, “Multiple fmri system-level baseline connectivity is disrupted in patients with consciousness alterations,” Cortex 52(0), pp. 35 – 46, 2014.
3. N. Farb, C. Grady, S. Strother, D. Tang-Wai, M. Masellis, S. Black, M. Freedman, B. Pollock, K. Campbell, L. Hasher, and T. Chow, “Abnormal network connectivity in frontotemporal dementia: Evidence for prefrontal isolation,” Cortex 49(7), pp. 1856 – 1873, 2013.
4. A. Bagshaw and A. Cavanna, “Resting state networks in paroxysmal disorders of consciousness,” Epilepsy and Behavior 26(3), pp. 290 – 294, 2013. The Future of Translational Epilepsy Research.
5. M. Jafri, G. Pearlson, M. Stevens, and V. Calhoun, “A method for functional network connectivity among spatially independent resting-state components in schizophrenia,” NeuroImage 39(4), pp. 1666 – 1681, 2008. 6. X. Xiaoping, C. Zhitong, and W. Xuchu, “Spatiotemporal nonlinearity in resting-state fmri of the human brain,” NeuroImage 40(4), pp. 1672 – 1685, 2008.
7. X. Liu and J. H. Duyn, “Time-varying functional network information extracted from brief instances of spontaneous brain activity,” Proceedings of the National Academy of Sciences 110, pp. 4392–4397, Mar 2013. 8. E. Amico, F. Gómez, C. Di-Perri, A. Vanhaudenhuyse, D. Lesenfants, P. Boveroux, V. Bonhomme, J.-F. Brichant, D. Marinazzo, and S. Laureys, “Posterior cingulate Cortex-Related Co-Activation patterns: A resting state fMRI study in Propofol-Induced loss of consciousness,” PLoS ONE 9, pp. e100012+, June 2014.
9. F. de Pasquale, S. Della Penna, A. Z. Snyder, C. Lewis, D. Mantini, L. Marzetti, P. Belardinelli, L. Ciancetta, Pizzella, G. L. Romani, and M. Corbetta, “Temporal dynamics of spontaneous MEG activity in brain networks,” Proc. Natl. Acad. Sci. U.S.A. 107, pp. 6040–6045, Mar 2010.
10. J. Kang, L. Wang, C. Yan, J. Wang, X. Liang, and Y. He, “Characterizing dynamic functional connectivity in the resting brain using variable parameter regression and Kalman filtering approaches,” Neuroimage 56, pp. 1222–1234, Jun 2011.
11. G. J. Szkely, M. L. Rizzo, and N. K. Bakirov, “Measuring and testing independence by correlation of distances,” The Annals of Statistics 35, pp. 2769–2794, 12 2007.
12. C. Schnakers, S. Majerus, J. Giacino, A. Vanhaudenhuyse, M. A. Bruno, M. Boly, G. Moonen, P. Damas, B. Lambermont, M. Lamy, F. Damas, M. Ventura, and S. Laureys, “A French validation study of the Coma Recovery Scale-Revised (CRS-R),” Brain Injury 22, pp. 786–792, Sep 2008.
13. M. J. Mckeown, S. Makeig, G. G. Brown, T.-P. Jung, S. S. Kindermann, R. S. Kindermann, A. J. Bell, and T. J. Sejnowski, “Analysis of fmri data by blind separation into independent spatial components,” Human Brain Mapping 6, pp. 160–188, 1998.
14. U. Sakoglu, G. D. Pearlson, K. A. Kiehl, Y. M. Wang, A. M. Michael, and V. D. Calhoun, “A method for evaluating dynamic functional network connectivity and task-modulation: application to schizophrenia,” MAGMA 23, pp. 351–366, Dec 2010.
15. J. Rudas, J. Guaje, A. Demertzi, L. Heine, L. Tshibanda, A. Soddu, S. Laureys, and F. Gómez, “A method for functional network connectivity using distance correlation,” in Accepted at EMBC2014, 2014.
16. M. Chen, J. Liu, and X. Tang, “Clustering via random walk hitting time on directed graphs,” in Proceedings of the 23rd National Conference on Artificial Intelligence - Volume 2, AAAI’08, pp. 616–621, AAAI Press, 2008.